Introduction
Osteosarcoma (OS) is recognized as the most
prevalent primary bone malignancy, considered to stem from
bone-forming mesenchymal stem cells. The pathogenesis of OS hinges
significantly on the aberrant activation of oncogenes and the
inactivation of tumor suppressor genes, which occurs through
somatic mutations and epigenetic mechanisms (1). Worldwide, the estimated annual
incidence of OS exceeds 2 million cases, with a primary peak
occurring at ages 15-19 years (incidence, 8-11 million/year) and a
minor peak occurring at >60 years of age (2,3). OS
predominantly affects the metaphysis of long extremity bones, such
as the distal femur, proximal tibia, proximal femur, and proximal
humerus, with rare occurrences in the axial skeleton and other
sites (4). Although the combination
of surgery and chemotherapy has significantly improved outcomes for
patients with OS, the prognosis for metastatic or recurrent OS
remains unsatisfactory (5). Thus,
the identification of novel targeted drugs and therapeutic targets
is an urgent priority.
Initially, adipocyte enhancer-binding protein 1
(AEBP1) was identified as a transcriptional repressor of the
adipose P2 (aP2) gene in preadipocytes (6), and its expression is downregulated
during the progress of adipocyte differentiation and upregulated in
numerous types of solid tumors such as colorectal cancer (7), gastric cancer (8), and breast cancer (9). AEBP1 consists of an N-terminal
discoidin-like domain, a carboxypeptidase domain, and a C-terminal
DNA-binding domain (10). AEBP1 is
found equally distributed both in the nucleus and cytoplasm and can
change signal transduction through protein interaction in the
cytoplasm and by transcriptionally regulating inflammatory and
apoptotic genes in the nucleus (11).
AEBP1 was revealed to be significantly expressed in
human gastric cancer tissues and gastric cancer cells, and
silencing of AEBP1 inhibited the proliferation, migration and
invasion of gastric cancer cells (12). Furthermore, AEBP1 knockdown could
also inhibit tumor growth in vivo as confirmed by a
xenograft mouse model. Mechanistically, knockdown of AEBP1
inhibited the downstream molecules of the NF-κB/p65 pathway, which
participate in the growth and metastasis of tumors (12). The Oncomine database revealed that
AEBP1 is highly expressed in glioblastoma, and the further analysis
of results showed that the high expression AEBP1 is associated with
the poor prognosis of glioblastoma, which indicated that AEBP1
could be a potential target for the development of novel therapies
of glioblastoma (13). A novel
treatment targeting glioma stem-like cells identified ACT001 as a
regulator of the AEBP1 and AKT signaling pathways, which may
suppress the growth of glioma stem-like cells and inhibit glioma
sphere formation. Furthermore, AKT pathway activation could rescue
the inhibition of cell proliferation induced by AEBP1 knockdown
(14). The expression of AEBP1 was
also observed in colorectal cancer tissues, and analysis of the
clinical data revealed that the patients with high AEBP1 expression
exhibited poor prognosis of colorectal cancer (15). Using miR-214 to downregulate the
expression of AEBP1, Li et al (15) found that AEBP1 depletion could
inhibit the proliferation and promote the apoptosis of colorectal
cancer cell lines. AEBP1 was revealed to be upregulated in breast
cancer tissues compared with adjacent noncancerous tissues, and
overexpression of AEBP1 promoted proliferation and metastasis
through the activation of the ERK and AKT pathways and inhibited
apoptosis by blocking cleavage of caspase-9(9).
In the present study, AEBP1 was identified as a
potential therapeutic target for OS. However, the molecular
mechanism by which AEBP1 regulates OS has not been reported to
date. Therefore, further exploration of the role of AEBP1 in OS
proliferation is necessary to identify novel molecular targets.
Materials and methods
Extraction of data
A total of three expression profile datasets
[GSE16088(16), GSE197158(17) and GSE63631(18)] were selected and downloaded from the
GEO database (https://www.ncbi.nlm.nih.gov) for analysis.
Differentially expressed genes (DEGs) were analyzed by GEO2R
(19). The screening conditions
were as follows: Log2-fold change <-1.5 or >1.5, and an
adjusted P-value (adj. P) <0.05. The Venn diagram was
constructed using Xiantao tool (https://www.xiantaozi.com), a web analysis tool. Data
on AEBP1 expression from the Cancer Genome Atlas (TCGA) (https://www.cancer.gov/tcga) were extracted and
analyzed using the UALCAN platform (https://ualcan.path.uab.edu) (20). Additionally, the expression of AEBP1
was analyzed using the Cancer Cell Line Encyclopedia (CCLE)
(https://sites.broadinstitute.org/ccle).
Cell line and cell culture
Two OS cell lines (U2OS and HOS) were acquired from
the Cell Bank of the Chinese Academy of Sciences (Shanghai, China).
Briefly, the cells were maintained in Dulbecco's modified Eagle's
medium supplemented with 10% fetal bovine serum (both from Gibco;
Thermo Fisher Scientific, Inc.), 100 U/ml penicillin, and 100 µg/ml
streptomycin at 37˚C in a humidified atmosphere containing 5%
CO2.
siRNA and cell transfection
siRNAs targeting the AEBP1 sequence (sense,
5'-GGUGGUGGCUCGUUUCAUC-3' and antisense, 5'-GAUGAAACGAGCCACCACC-3')
and non-silencing sequences (sense, 5'-UUCUCCGAACGUGUCACGUTT-3' and
antisense, 5'-GUGACACGUUCGGAGAATT-3') were procured from Guangzhou
RiboBio Co., Ltd. Transfection with siRNAs was carried out using
Lipofectamine 2000 transfection reagent (Thermo Fisher Scientific,
Inc.) following the manufacturer's instructions. Briefly, 100 pmol
siRNA and Lipofectamine 2000 were added in the medium without FBS
and antibiotics. Following incubation for 20 min at room
temperature, the mixture was added in a 6-well plate and the medium
was replaced with complete medium after 4 h. The cells were
harvested after 48 h for the further determination.
Reverse transcription-quantitative PCR
(RT-qPCR)
Total RNA was extracted from OS cell lines (U2OS and
HOS) using TRIzol reagent (Invitrogen; Thermo Fisher Scientific,
Inc.) following the manufacturer's protocol. The extracted RNA was
then reversely transcribed into cDNA using the FastKing RT Kit
(ref. no. GKR116; Tiangen Biotech Co., Ltd.). Subsequently, RT-qPCR
was performed using the ChamQ Universal SYBR qPCR Master Mix Kit
(Vazyme Biotech Co., Ltd.) on an Applied Biosystems 7500 Real-time
PCR System (Applied Biosystems, Inc.; Thermo Fisher Scientific,
Inc.). Briefly, after an initial denaturation step at 95˚C for 30
sec, the amplifications were carried out with 40 cycles at a
melting temperature of 95˚C for 10 sec and an annealing temperature
of 60˚C for 30 sec; followed by a melting curve analysis at 95˚C
for 15 sec, 60˚C for 1 min, and 95˚C for 15 sec. The following
primers were used to detect the expression of AEBP1: Forward,
5'-ATGGACTATTACTTTGGGCC-3' and reverse, 5'-GGGTAGTCCTCCTGGTGTCC-3'.
β-actin was selected as the reference gene, and its expression was
detected using the following primers: Forward,
5'-GCGTGACATTAAGGAGAAGC-3' and reverse,
5'-CCACGTCACACTTCATGATGG-3'. The relative gene expression was
determined using the comparative Cq method (21), and each experiment was repeated at
least three times.
Western blot analysis
Cells (U2OS and HOS) were harvested, and total
protein was extracted using RIPA buffer supplemented with fresh
protease and phosphatase inhibitors (Beyotime Institute of
Biotechnology) following the manufacturer's instructions. The
protein concentration was determined using a BCA assay (Nanjing
KeyGen Biotech Co., Ltd.). Equal amounts of proteins (40 µg) were
subjected to SDS-PAGE using 10% gels and transferred onto PVDF
membranes. The membranes were blocked with 3% BSA (cat. no.
KGL2314-10; Nanjing KeyGen Biotech Co., Ltd.) in 10 mM Tris-HCl (pH
7.4, with 0.05% Tween-20) for 1 h at room temperature and then
incubated with primary antibodies at 4˚C for 12 h. After washing
with Tris-HCl buffer three times, the membranes were incubated with
the corresponding peroxidase-conjugated secondary antibody (Abcam)
at room temperature for 1 h. After washing with Tris-HCl buffer
three times again, the protein bands were visualized using
Super-Signal West Pico Chemiluminescent Substrate (Pierce; Thermo
Fisher Scientific, Inc.), and their densitometry was quantified
using ImageJ v1.8.0.345 software (National Institutes of Health).
The detailed information regarding the antibodies is presented in
Table SI. Each experiment was
repeated at least three times.
MTT assay
OS (U2OS and HOS) cells (5,000 cells per well) were
seeded in a 96-well plate in triplicate and cultured in a complete
medium at 37˚C for 1-5 days. Following incubation, 100 µl of MTT
(cat. no. ST316; Beyotime Insitute of Biotechnology) solution (5
mg/ml) was added to each well, and the plate was further incubated
at 37˚C for 4 h. Following incubation, the supernatant was
carefully removed, and 150 µl of DMSO was added to each well. The
plate was then oscillated for 30 min at room temperature to
dissolve the formazan crystals. The absorbance at 490 nm was
measured using a microplate reader, and the values were determined
after subtracting the background. Each experiment was conducted at
least three times.
Plate colony formation assay
Briefly, 400 cells (U2OS and HOS) were seeded in
each well of a 6-well plate for the colony formation assay. After 2
weeks of incubation, the cells were washed three times with cold
PBS at room temperature. Subsequently, the cells were fixed with 4%
paraformaldehyde for 30 min at room temperature, followed by three
washes with PBS. The cells were then stained with crystal violet
dye for 20 min at room temperature. After staining, cell colonies
were observed and imaged using a digital camera (Canon DS126211;
Canon, Inc.). The plates were washed with distilled water before
imaging. Colonies were defined as >50 cells and counted
manually.
5-Ethynyl-2'-deoxyuridine (EdU)
assay
The cell proliferation rate of U2OS and HOS cells
was determined using the EdU incorporation assay following the
manufacturer's instructions (BeyoClick™ EdU-555 EdU Kit;
cat. no. C0075S; Beyotime Institute of Biotechnology). Images were
captured under a fluorescence microscope (Leica Microsystems GmbH)
from five randomly selected areas of each group. The EdU
incorporation experiments were repeated at least three times to
ensure the reliability and reproducibility of the results.
Flow cytometry (FCM)
Cells (U2OS and HOS) were harvested, washed twice
with cold PBS, and then fixed with cold 70% ethanol overnight at
4˚C. After fixation, the cells were resuspended in PBS and stained
with propidium iodide (PI) for 30 min at room temperature or
Annexin V-APC (eBioscience, Inc.) for 30 min at room temperature.
Subsequently, the stained cells were analyzed using a BD
FACSCalibur flow cytometer (BD Biosciences). FlowJo software
(v10.0; TreeStar) was used to analyze the data. This experiment was
repeated at least three times to ensure the reliability of the
results.
Terminal deoxynucleotidyl
transferase-mediated dUTP nick-end labeling (TUNEL) assay
Cell apoptosis analysis was conducted using a TUNEL
assay kit (cat. no. KGA1407-20; Nanjing KeyGen Biotech Co., Ltd.)
following the manufacturer's instructions. Briefly, the cells were
fixed using 4% paraformaldehyde for 30 min at room temperature, and
then incubated with 0.2% Triton X-100 for 15 min at room
temperature. The cells were washed three times using PBS solution
for 5 min at room temperature. The cells were then incubated with
TUNEL reagent for 30 min at 37˚C. Finally, the nuclei were stained
with DAPI (5 µg/ml) for 10 min at room temperature and the cells
were mounted using an antifade mounting medium. A total of five
fields were then observed under a fluorescence microscope (Leica
Microsystems GmbH). This experiment was repeated at least three
times to ensure the reliability of the results.
Rescue experiment
U2OS cells (20,000 cells per well) were seeded in a
6-well plate in triplicate and cultured in complete medium at 37˚C.
Following siRNA transfection for 48 h, an AKT pathway activator, 4
µg/ml SC79 (cat. no. S7863; Selleck Chemicals), was added in the
medium. The cells were then cultured for 24 h at 37˚C and harvested
for further western blot analysis.
Statistical analysis
Statistical analysis was conducted using IBM SPSS
Statistics software version 20 (IBM Corp.). Data were derived from
a minimum of three independent experiments and are presented as the
mean ± standard deviation. Unpaired Student's t-test was used for
two-group comparisons and one-way analysis of variance (ANOVA)
analysis was used for comparisons among multiple groups followed by
Tukey's post hoc test. P<0.05 was considered to indicate a
statistically significant difference.
Results
AEBP1 is identified as a novel target
for osteosarcoma and markedly expressed in sarcoma tissues and OS
cell lines
In order to screen the new molecular target for
osteosarcoma, three GEO profiles were analyzed. GSE16088 contained
human osteosarcoma tissues and normal tissues. GSE197158 contained
osteosarcoma cell lines and normal osteoblast cell lines. GSE63631
contained mice osteosarcoma and normal tissues. Following GEO2R
analysis and Venn diagram construction, 25 genes were identified to
be upregulated in all the three datasets (Fig. 1A). In addition, there were no genes
identified to be downregulated in all the three datasets (Fig. 1B). The fold change value is
presented in Fig. 1C. There was one
gene that was identified to be upregulated, AEBP1, and to the best
of our knowledge, no studies on the association between this gene
and osteosarcoma have been reported to date. To explore the
relationship between AEBP1 expression and tumors, an analysis using
datasets from TCGA, available on the UALCAN database was conducted.
The TCGA database includes sarcoma data but does not distinctly
categorize osteosarcoma from other sarcoma subtypes. The findings
revealed a high expression of AEBP1 (ranked 8th among all 33 types
of tumors) in sarcoma tissue compared with other tumor tissues
(Fig. 1D). Although sarcoma also
includes tumors originating from muscle and adipose tissue, the
results suggested that AEBP1 may be associated with osteosarcoma.
Furthermore, the expression of AEBP1 was analyzed in cancer cell
lines using the CCLE database and markedly high expression was
identified in bone cancer cell lines (Fig. 1E and F). Based on these findings, two OS cell
lines, U2OS and HOS were selected for further research on AEBP1
expression in OS.
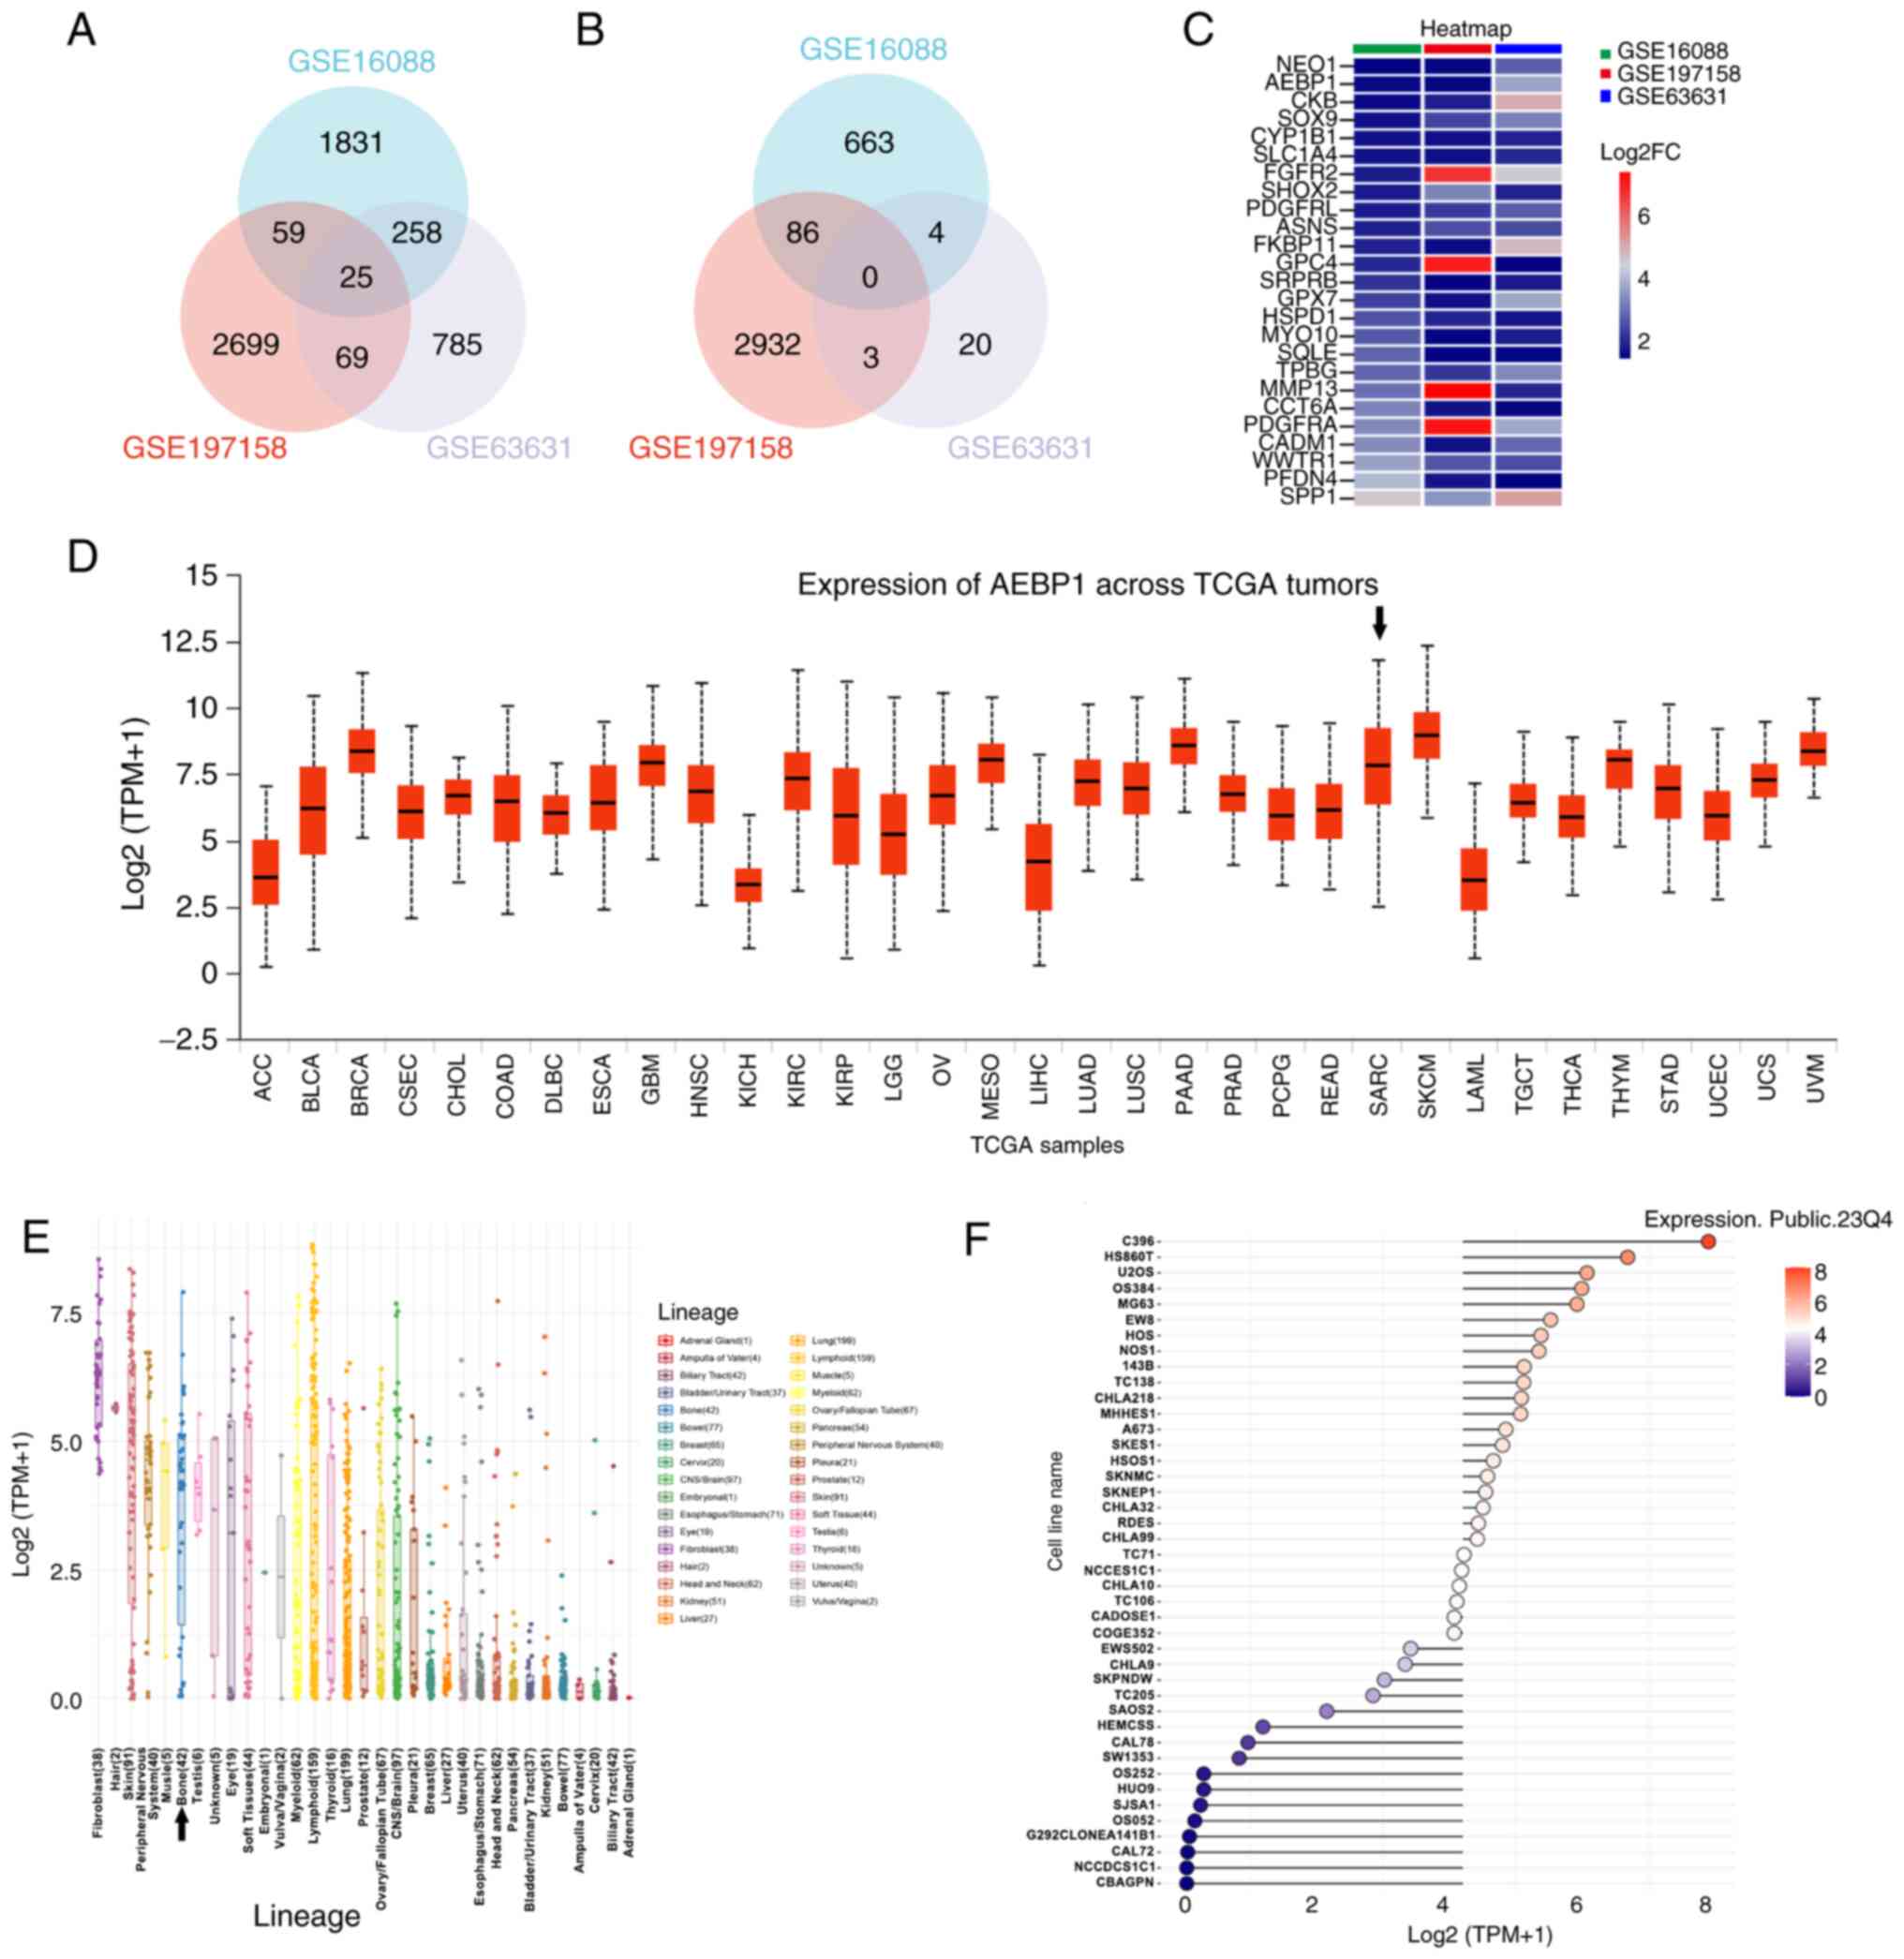 | Figure 1AEBP1 is a novel target for
osteosarcoma and is markedly expressed in sarcoma and bone cancer
cell lines. (A) Upregulated genes in 3 datasets (GSE16088,
GSE197158 and GSE63631). (B) Downregulated genes in 3 datasets
(GSE16088, GSE197158 and GSE63631). (C) The fold change of 25
upregulated genes of 3 datasets (GSE16088, GSE197158 and GSE63631).
(D) Expression of AEBP1 across TCGA tumors. The black arrow
indicates sarcoma. (E) Expression of AEBP1 in 33 types of cancer
cell lines. The black arrow indicates bone cancer cell lines. (F)
Expression of AEBP1 in bone cancer cell lines. Adipocyte
enhancer-binding protein 1; TCGA, The Cancer Genome Atlas; ACC,
adrenocortical carcinoma; BLCA, bladder urothelial carcinoma; BRCA,
breast invasive carcinoma; CESC, cervical squamous cell carcinoma
and endocervical adenocarcinoma; CHOL, cholangiocarcinoma; COAD,
colon adenocarcinoma; DLBC, lymphoid neoplasm diffuse large B-cell
lymphoma; ESCA, esophageal carcinoma; GBM, glioblastoma multiforme;
HNSC, head and neck squamous cell carcinoma; KICH, kidney
chromophobe; KIRC, kidney renal clear cell carcinoma; KIRP, kidney
renal papillary cell carcinoma; LGG, brain lower grade glioma; OV,
ovarian serous cystadenocarcinoma; MESO, mesothelioma; LIHC, liver
hepatocellular carcinoma; LUAD, lung adenocarcinoma; LUSC, lung
squamous cell carcinoma; PAAD, pancreatic adenocarcinoma; PRAD,
prostate adenocarcinoma; PCPG, pheochromocytoma and paraganglioma;
READ, rectum adenocarcinoma; SARC, sarcoma; SKCM, skin cutaneous
melanoma; LAML, acute myeloid leukemia; TGCT, testicular germ cell
tumors; THCA, thyroid carcinoma; THYM, thymoma; STAD, stomach
adenocarcinoma; UCEC, uterine corpus endometrial carcinoma; UCS,
uterine carcinosarcoma; UVM, uveal melanoma. |
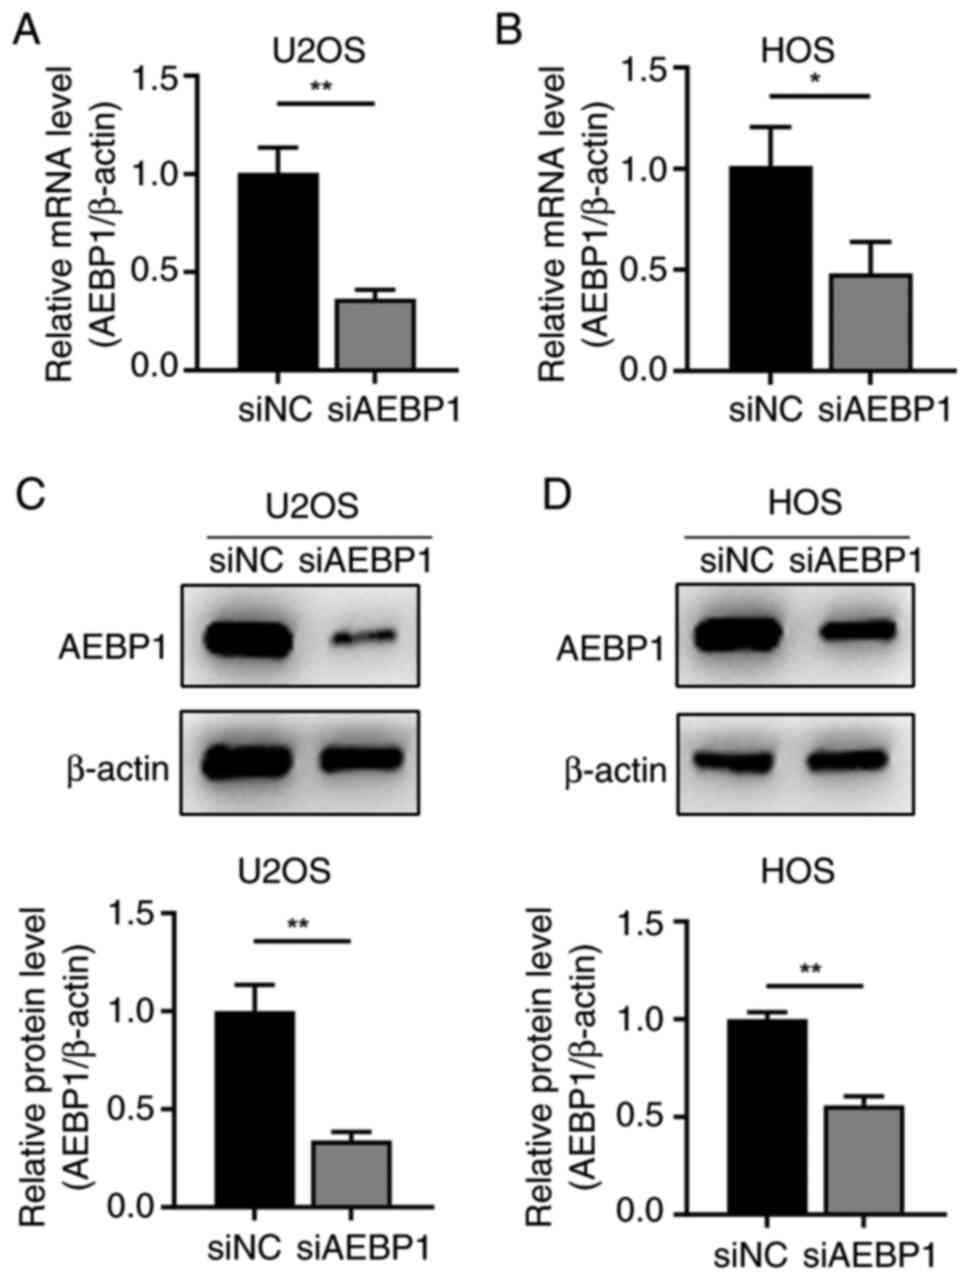
Silencing of AEBP1 increases the
cytotoxicity and inhibits the proliferation of human OS cells
To investigate the role of AEBP1 in regulating OS,
AEBP1 was silenced by transfecting siRNA targeting AEBP1 into OS
cells. Following siRNA transfection, the expression of AEBP1 at the
both mRNA and protein levels was significantly decreased in U2OS
and HOS cells (Fig. 2A-D).
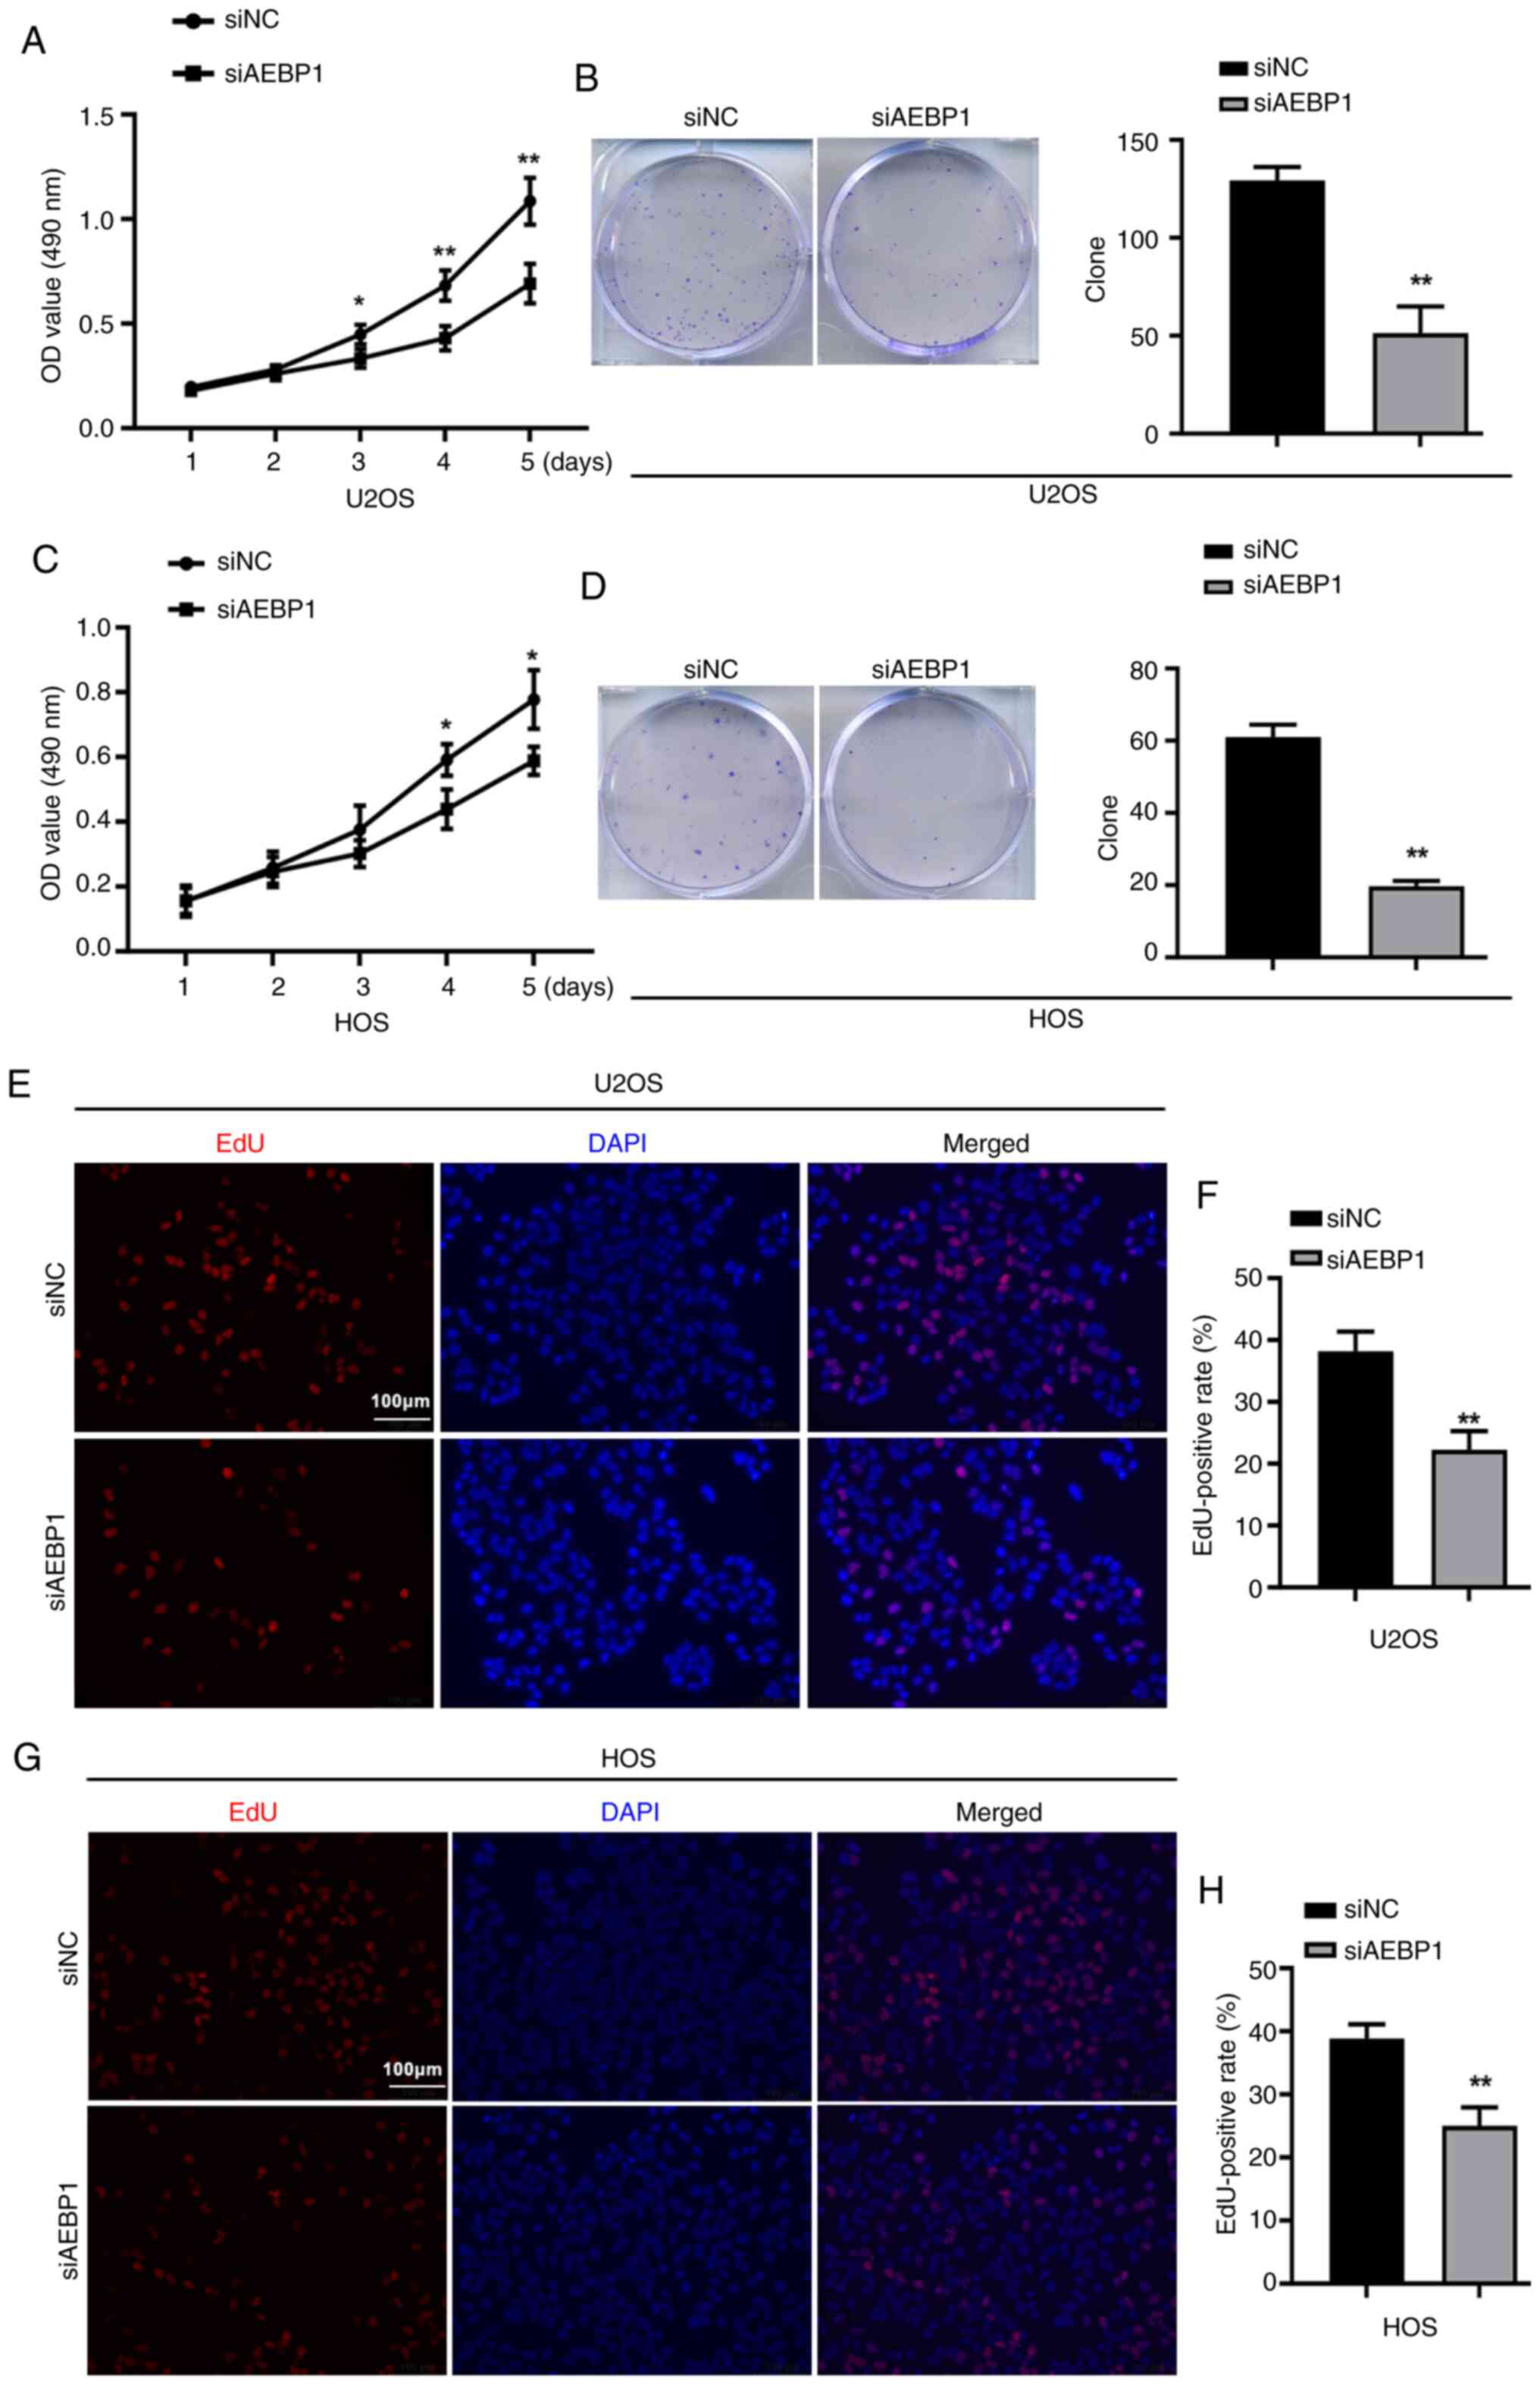
The effect of AEBP1 silencing on cell proliferation
was then examined using MTT, colony formation assays, and EdU
assays. The results of MTT assays revealed that silencing of AEBP1
increased the cytotoxicity of OS cells (Fig. 3A and C). Additionally, the formation of cell
colonies was significantly inhibited after silencing of AEBP1, with
the number of colonies decreasing by 60.5% in U2OS cells and 67.2%
in HOS cells (Fig. 3B and D).
The EdU assay further indicated a significant
decrease in proliferation following silencing of AEBP1. The number
of EdU-positive cells was significantly reduced in AEBP1-silenced
cells compared with control cells, with U2OS cells showing a
decrease from 38.2 to 22.3% and HOS cells showing a decrease from
38.8 to 25.0% (Fig. 3E-H).
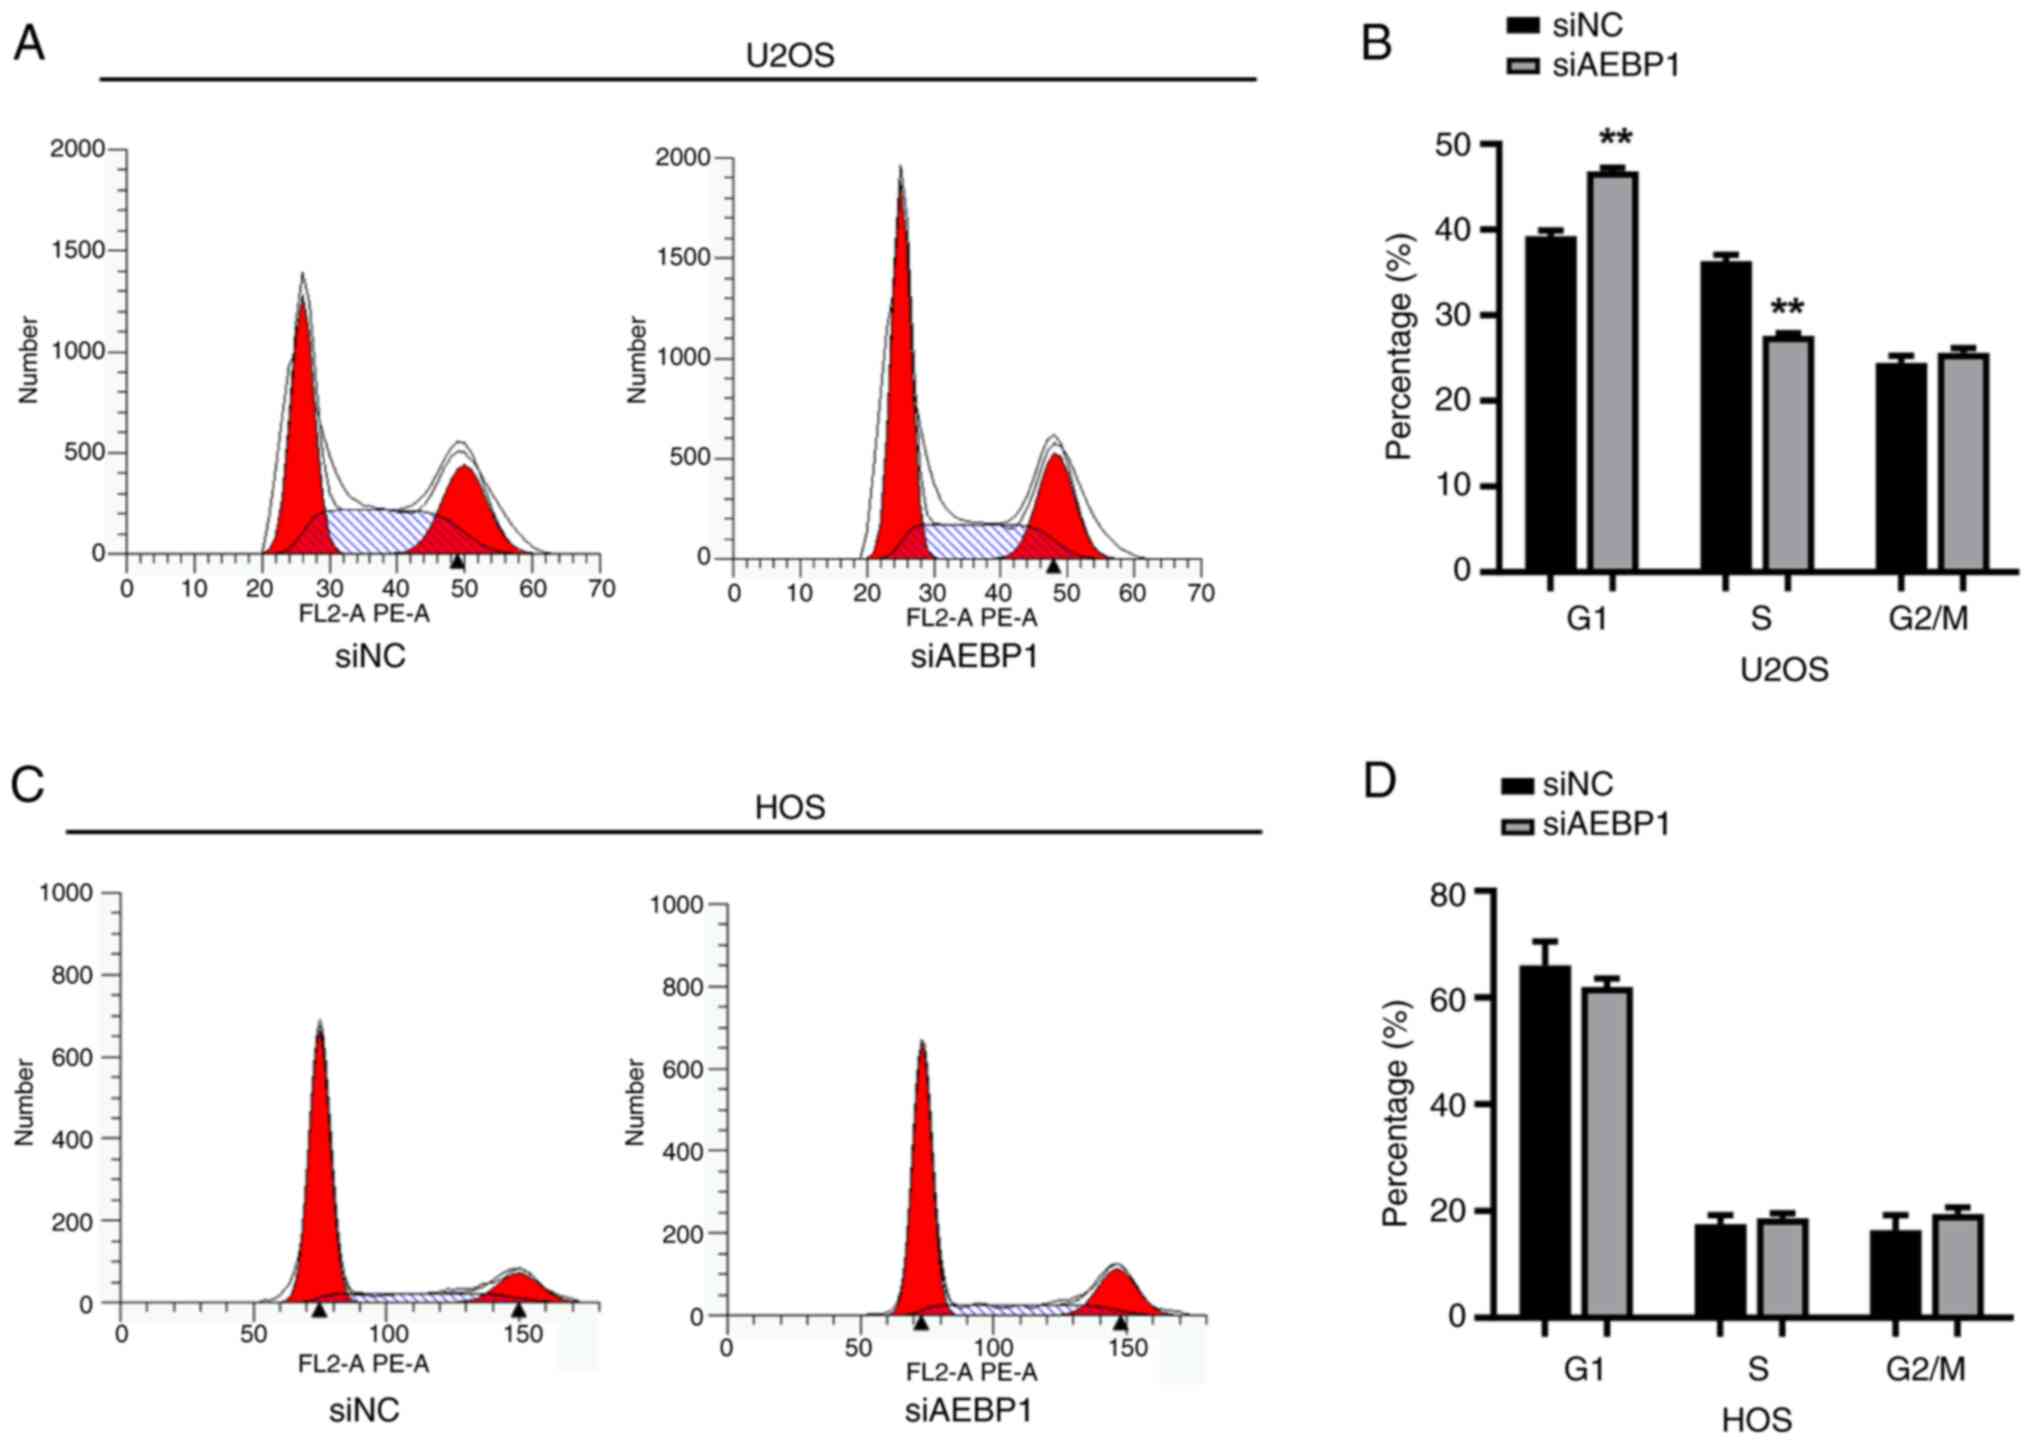
Silencing of AEBP1 induces
G1 cell cycle arrest in human OS U2OS cells
To elucidate how AEBP1 regulated cell growth, FCM
was used to analyze the cell cycle. In U2OS cells, the results
showed that the percentage of cells in the G1 phase was
39.2% in the control group and increased to 46.8% in the
AEBP1-silenced group. Conversely, the percentage of cells in the S
phase decreased from 36.3% in the control group to 27.6% in the
AEBP1-silenced group (Fig. 4A and
B). These findings indicated that
knockdown of AEBP1 induced G1 phase arrest in U2OS
cells. However, a consistent trend was not observed in HOS cells.
Following silencing of AEBP1, there was no significant change in
the cell cycle of HOS cells (Fig.
4C and D).
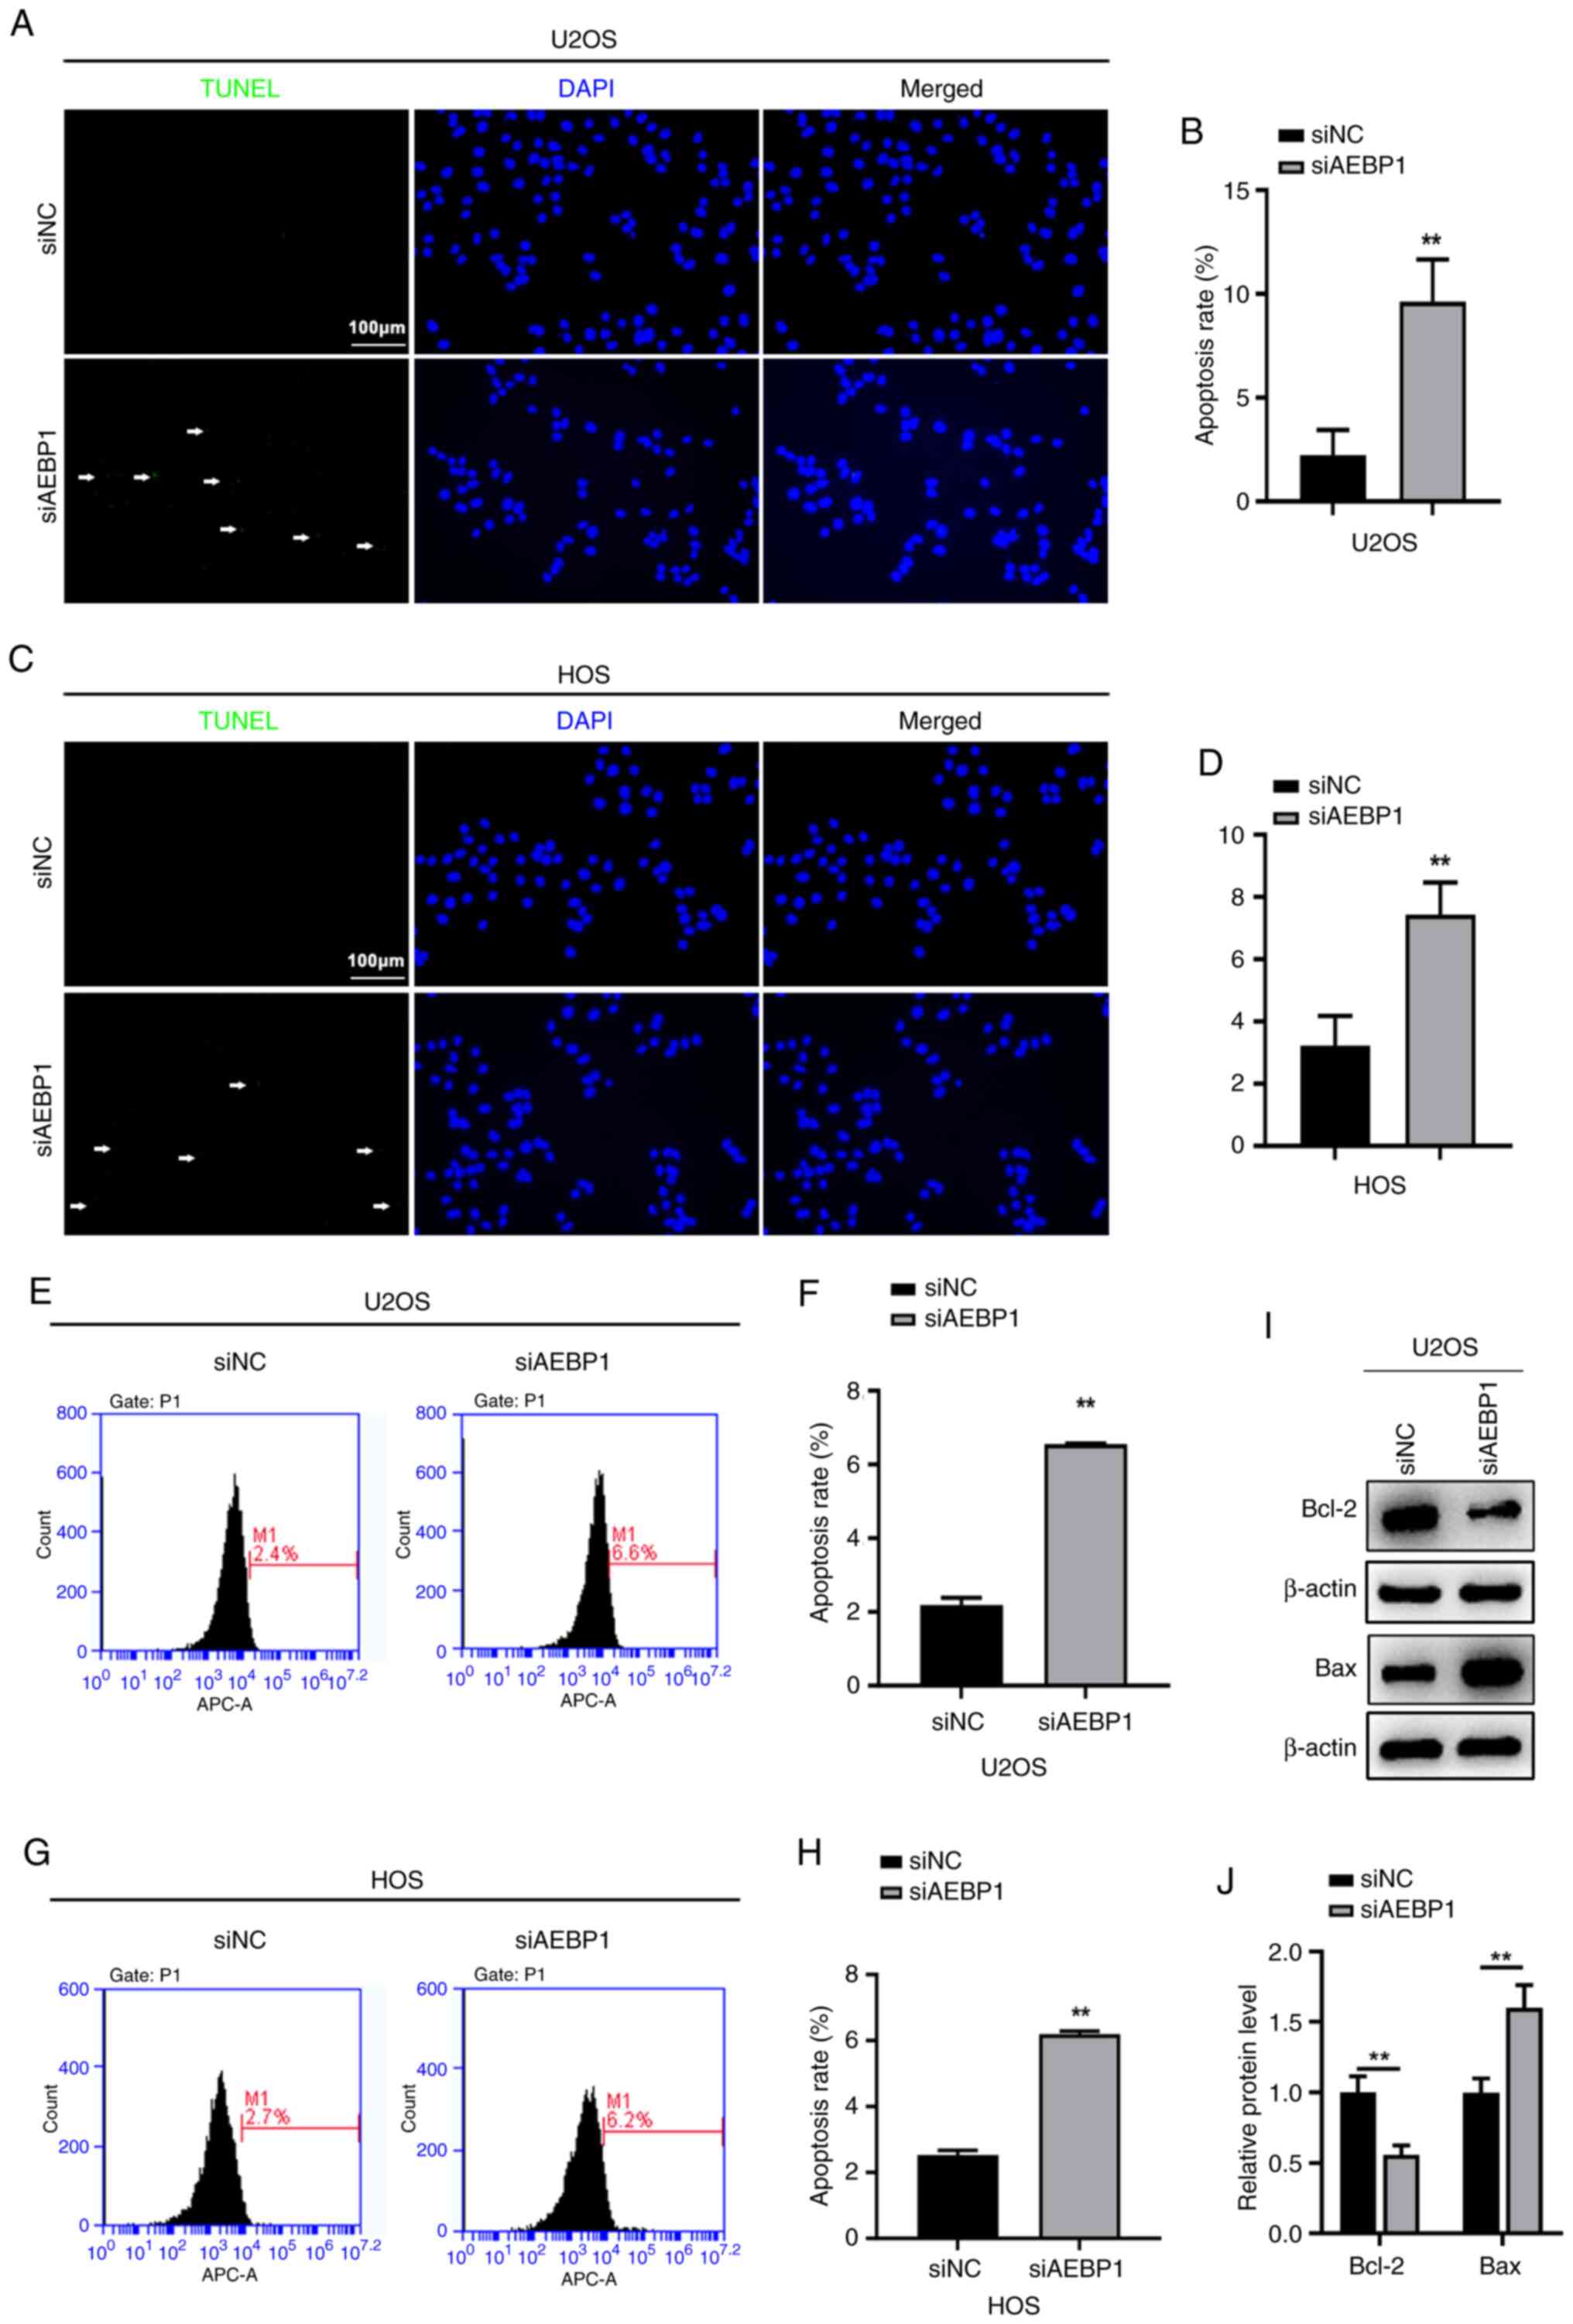
Silencing of AEBP1 promotes apoptosis
in human OS cells
To investigate the role of AEBP1 in regulating the
proliferation of OS cells, the changes in apoptosis were evaluated,
following AEBP1 silencing, using TUNEL and FCM assays. TUNEL
staining revealed a significant increase in the percentage of
TUNEL-positive cells in both U2OS and HOS cells following silencing
of AEBP1. In U2OS cells, the percentage of TUNEL-positive cells
increased from 2.2% in control cells to 9.6% in AEBP1-silenced
cells (Fig. 5A and B). Similarly, in HOS cells, the percentage
of TUNEL-positive cells increased from 3.2% in control cells to
7.4% after silencing of AEBP1 (Fig.
5C and D). Consistent with
these findings, the results of FCM showed a significant increase in
the apoptotic rate of U2OS cells after silencing of AEBP1 (6.6%)
compared with control cells (2.2%) (Fig. 5E and F). Similarly, the apoptotic rate of HOS
cells significantly increased after AEBP1 knockdown (6.2%) compared
with control cells (2.5%) (Fig. 5G
and H). Considering that silencing
of AEBP1 promoted apoptosis, the levels of Bcl-2 and Bax, key
regulators of apoptosis, were also assessed. The findings revealed
downregulation of Bcl-2 and upregulation of Bax following silencing
of AEBP1 (Fig. 5I and J).
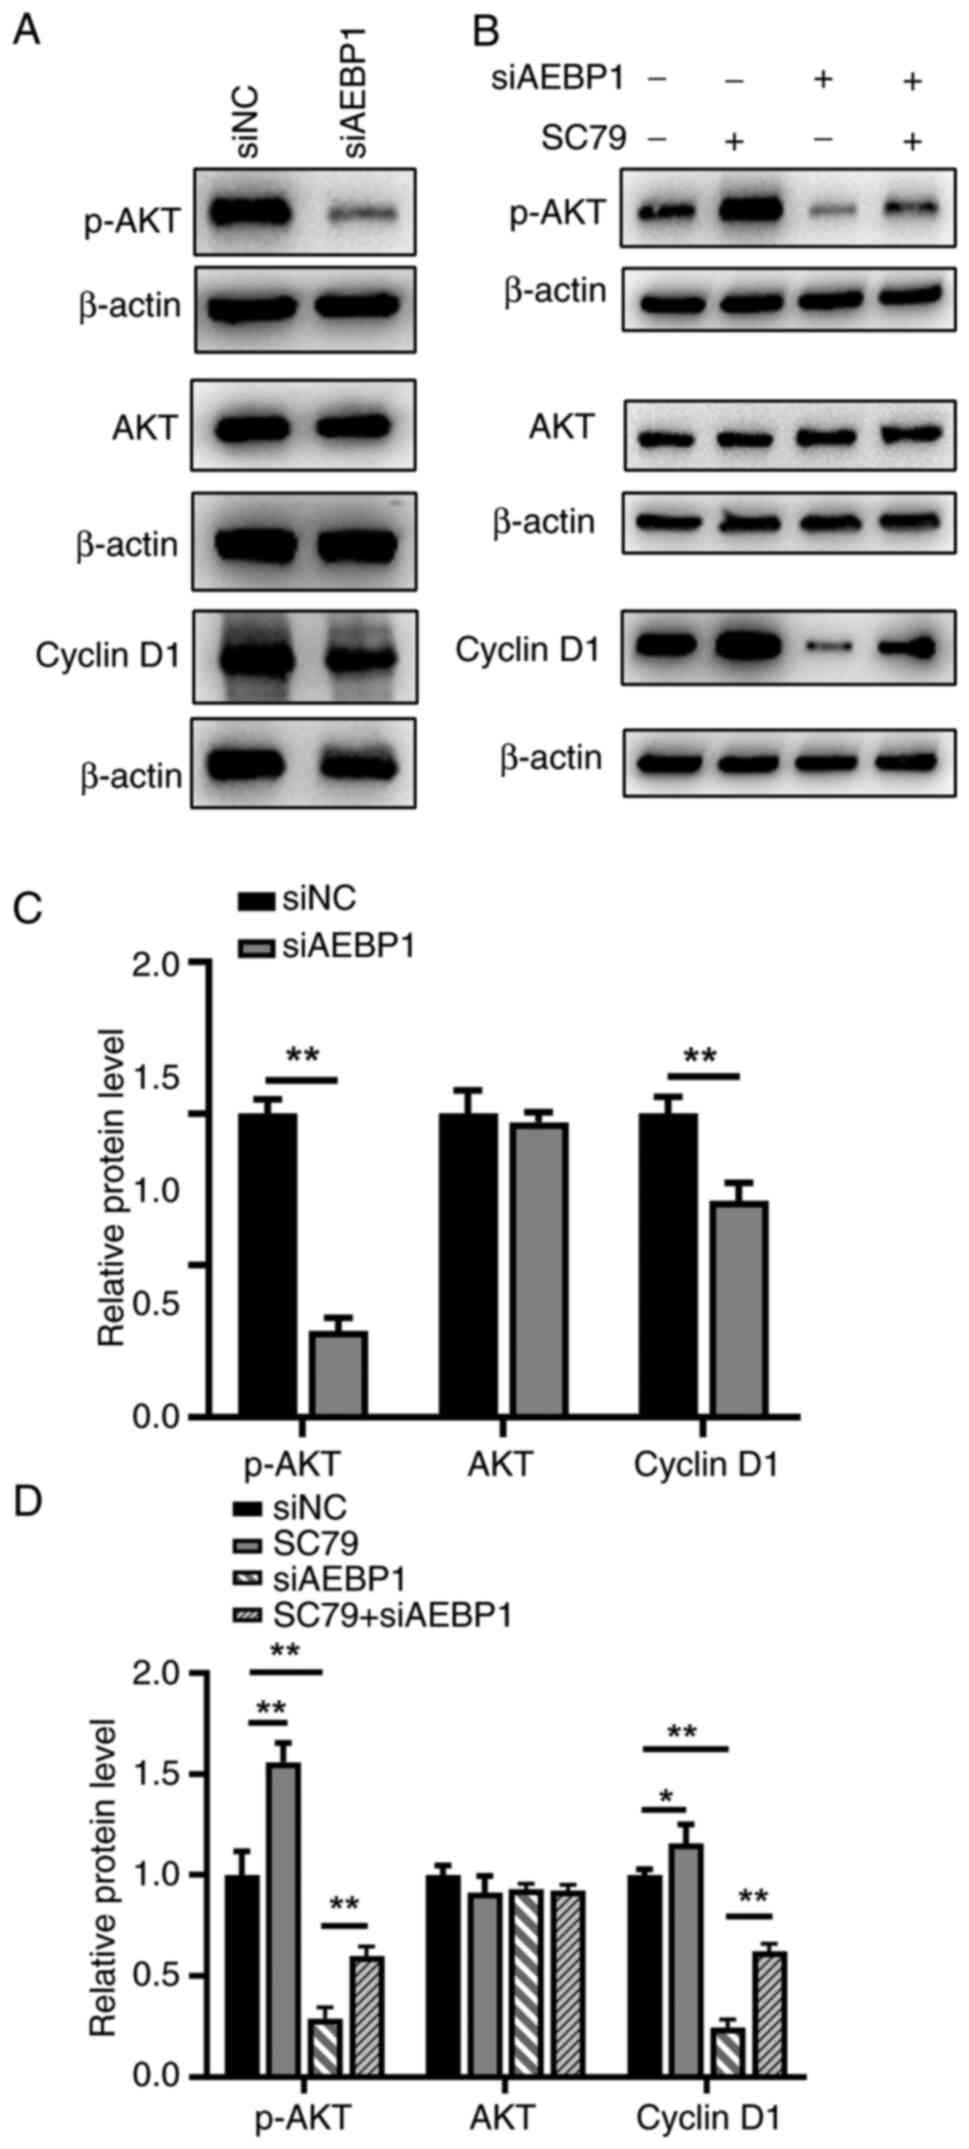
Silencing of AEBP1 inhibits cell
proliferation through the AKT signaling pathway
To elucidate the mechanism underlying AEBP1-induced
proliferation and apoptosis, the AKT signaling pathway, a regulator
of cell proliferation and apoptosis (22), was investigated in U2OS cells. The
results demonstrated that phosphorylated AKT (p-AKT) levels
significantly decreased following AEBP1 silencing, while total AKT
levels remained unchanged (Fig. 6A
and C). Furthermore, since
silencing of AEBP1 induced G1 phase arrest in U2OS
cells, the protein expression level of cyclin D1, a key regulator
of the G1 phase of the cell cycle and a downstream
factor of the AKT signaling pathway (23), was examined. The results showed a
decrease in the protein level of cyclin D1 following silencing of
AEBP1 (Fig. 6A and C).
To further validate the involvement of the AKT
signaling pathway, rescue experiments were performed by adding an
AKT pathway activator (SC79). It was revealed that SC79
significantly rescued the inhibitory effect induced by AEBP1
silencing (Fig. 6B and D). In conclusion, the data indicated that
AEBP1 regulated the proliferation of OS cells primarily through the
AKT signaling pathway.
Discussion
In the present study, AEBP1 was initially identified
as a novel target for osteosarcoma and high expression of AEBP1 was
observed in human sarcoma tissues and OS cell lines. Subsequently,
the role of AEBP1 in regulating the proliferation of OS cells
through the AKT signaling pathway was explored. The AKT signaling
pathway plays a crucial role in cell growth and survival, protein
synthesis, and glucose metabolism (24). Dysregulation of this pathway is
observed in various tumor types, leading to investigations into its
inhibition in different cancer models, including the
triple-negative subtype of breast cancer (25). During the progression of mammary
gland tumorigenesis, AEBP1 could enhance the activity of NF-κB/p65
and Akt mediated by TNF-α secretion, and transplantation of AEBP1
in bone marrow cells may lead to alveolar hyperplasia contributing
to upregulation of NF-κB activity and TNF-α expression (26). Western blotting analysis further
supported the hypothesis that AEBP1 regulated OS growth through the
AKT signaling pathway. The additional experiments, wherein an
activator of the AKT pathway was able to rescue the inhibition
induced by silencing of AEBP1, further confirmed the
conclusion.
Cyclin D1 is a key mediator of AKT in regulating
cell proliferation. Phosphorylation of cyclin D1 at Thr286 by
glycogen synthase kinase 3β (GSK3β) leads to its ubiquitin-mediated
degradation (27). AKT-dependent
phosphorylation inhibits GSK3β catalytic activity, thereby
stabilizing cyclin D1. Additionally, AKT can regulate cyclin D1
expression through the NF-κB/IκB kinase pathway (28). Cell cycle progression in all
eukaryotes is tightly regulated by an intricate mechanism involving
cyclin-dependent kinases (CDKs) binding with the corresponding
cyclin regulatory subunits in a sequential manner. The
G1 phase cyclins, cyclin D, and cyclin E, predominantly
associate with CDK4/CDK6 and CDK2 to promote G1
progression and entry into the S phase (29). In the present study, it was observed
that silencing of AEBP1 induced G1 phase arrest in U2OS
cells and inhibited cell proliferation.
It was also further explored whether AEBP1 could
influence the apoptosis of OS cells. Li et al (30) reported that AEBP1 knockdown could
markedly promote the apoptosis of Jurkat cells via the p53/Bcl-2
pathway, indicated that AEBP1 may be pivotal to apoptosis (30). The Bcl-2 family plays a critical
role in determining cell fate. In mammalian cells, the intrinsic
mitochondrial pathway of apoptosis is tightly regulated by Bcl-2
family proteins, including Bcl-2, Bcl-XL, and MCL-1(31). While Bcl-2 is an anti-apoptotic
protein, Bax is a pro-apoptotic effector protein. Inhibition of
Bcl-2 has previously been shown to promote apoptosis in leukemic
cells (32). The results of the
present study indicated that silencing of AEBP1 promoted apoptosis
by inhibiting Bcl-2 and upregulating Bax.
In conclusion, it was demonstrated that AEBP1
regulated the proliferation of OS primarily through the AKT
signaling pathway, affecting both cell proliferation and apoptosis.
Therefore, AEBP1 may serve as a potential therapeutic target for
treating OS.
Supplementary Material
Antibodies used in the study.
Acknowledgements
Not applicable.
Funding
Funding: The present study was supported by the research fund of
Science and Technology Plan of Jinan Health Commission (grant no.
2021-2-124).
Availability of data and materials
The data generated in the present study may be
requested from the corresponding author.
Authors' contributions
CJ conceived and designed the study. ZG and LZ
performed the bioinformatics analysis and statistical analysis. CJ
conducted laboratory experiments. CJ, ZG and LZ wrote and revised
the manuscript. CJ, ZG and LZ confirm the authenticity of all the
raw data. All authors read and approved the final version of the
manuscript.
Ethics approval and consent to
participate
Not applicable.
Patient consent for publication
Not applicable.
Competing interests
The authors declare that they have no competing
interests.
References
|
1
|
Li Z, Li X, Xu D, Chen X, Li S, Zhang L,
Chan MTV and Wu WKK: An update on the roles of circular RNAs in
osteosarcoma. Cell Prolif. 54(e12936)2021.PubMed/NCBI View Article : Google Scholar
|
|
2
|
Mirabello L, Troisi RJ and Savage SA:
Osteosarcoma incidence and survival rates from 1973 to 2004: Data
from the surveillance, epidemiology, and end results program.
Cancer. 115:1531–1543. 2009.PubMed/NCBI View Article : Google Scholar
|
|
3
|
Whelan J, McTiernan A, Cooper N, Wong YK,
Francis M, Vernon S and Strauss SJ: Incidence and survival of
malignant bone sarcomas in England 1979-2007. Int J Cancer.
131:E508–E517. 2012.PubMed/NCBI View Article : Google Scholar
|
|
4
|
Sheng G, Gao Y, Yang Y and Wu H:
Osteosarcoma and metastasis. Front Oncol. 11(780264)2021.
|
|
5
|
Chen C, Xie L, Ren T, Huang Y, Xu J and
Guo W: Immunotherapy for osteosarcoma: Fundamental mechanism,
rationale, and recent breakthroughs. Cancer Lett. 500:1–10.
2021.PubMed/NCBI View Article : Google Scholar
|
|
6
|
He GP, Muise A, Li AW and Ro HS: A
eukaryotic transcriptional repressor with carboxypeptidase
activity. Nature. 378:92–96. 1995.PubMed/NCBI View
Article : Google Scholar
|
|
7
|
Sugai T, Yamada N, Osakabe M, Hashimoto M,
Uesugi N, Eizuka M, Tanaka Y, Sugimoto R, Yanagawa N and Matsumoto
T: Microenvironmental markers are correlated with lymph node
metastasis in invasive submucosal colorectal cancer.
Histopathology. 79:584–598. 2021.PubMed/NCBI View Article : Google Scholar
|
|
8
|
Li S, Liu X, Liu T, Meng X, Yin X, Fang C,
Huang D, Cao Y, Weng H, Zeng X and Wang X: Identification of
biomarkers correlated with the TNM staging and overall survival of
patients with bladder cancer. Front Physiol. 8(947)2017.PubMed/NCBI View Article : Google Scholar
|
|
9
|
Li J, Ruan Y, Zheng C, Pan Y, Lin B, Chen
Q and Zheng Z: AEBP1 contributes to breast cancer progression by
facilitating cell proliferation, migration, invasion, and blocking
apoptosis. Discov Med. 35:45–56. 2023.PubMed/NCBI View Article : Google Scholar
|
|
10
|
Lyons PJ, Mattatall NR and Ro HS: Modeling
and functional analysis of AEBP1, a transcriptional repressor.
Proteins. 63:1069–1083. 2006.PubMed/NCBI View Article : Google Scholar
|
|
11
|
Ladha J, Sinha S, Bhat V, Donakonda S and
Rao SMR: Identification of genomic targets of transcription factor
AEBP1 and its role in survival of glioma cells. Mol Cancer Res.
10:1039–1051. 2012.PubMed/NCBI View Article : Google Scholar
|
|
12
|
Liu JY, Jiang L, Liu JJ, He T, Cui YH,
Qian F and Yu PW: AEBP1 promotes epithelial-mesenchymal transition
of gastric cancer cells by activating the NF-κB pathway and
predicts poor outcome of the patients. Sci Rep.
8(11955)2018.PubMed/NCBI View Article : Google Scholar
|
|
13
|
Liu M, Yu Y, Zhang Z, Chen Z, Chen B,
Cheng Y, Wei Y, Li J and Shang H: AEBP1 as a potential
immune-related prognostic biomarker in glioblastoma: A
bioinformatic analyses. Ann Transl Med. 9(1657)2021.PubMed/NCBI View Article : Google Scholar
|
|
14
|
Hou Y, Sun B, Liu W, Yu B, Shi Q, Luo F,
Bai Y and Feng H: Targeting of glioma stem-like cells with a
parthenolide derivative ACT001 through inhibition of AEBP1/PI3K/AKT
signaling. Theranostics. 11:555–566. 2021.PubMed/NCBI View Article : Google Scholar
|
|
15
|
Li S, Li C and Fang Z: MicroRNA 214
inhibits adipocyte enhancer-binding protein 1 activity and
increases the sensitivity of chemotherapy in colorectal cancer.
Oncol Lett. 17:55–62. 2019.PubMed/NCBI View Article : Google Scholar
|
|
16
|
Paoloni M, Davis S, Lana S, Withrow S,
Sangiorgi L, Picci P, Hewitt S, Triche T, Meltzer P and Khanna C:
Canine tumor cross-species genomics uncovers targets linked to
osteosarcoma progression. BMC Genomics. 10(625)2009.PubMed/NCBI View Article : Google Scholar
|
|
17
|
Wood RK, Flory AR, Mann MJ, Talbot LJ and
Hendershot LM: Secretory defects in pediatric osteosarcoma result
from downregulation of selective COPII coatomer proteins. iScience.
25(104100)2022.PubMed/NCBI View Article : Google Scholar
|
|
18
|
Sato S, Tang YJ, Wei Q, Hirata M, Weng A,
Han I, Okawa A, Takeda S, Whetstone H, Nadesan P, et al:
Mesenchymal tumors can derive from Ng2/Cspg4-expressing pericytes
with β-catenin modulating the neoplastic phenotype. Cell Rep.
16:917–927. 2016.PubMed/NCBI View Article : Google Scholar
|
|
19
|
Barrett T, Wilhite SE, Ledoux P,
Evangelista C, Kim IF, Tomashevsky M, Marshall KA, Phillippy KH,
Sherman PM, Holko M, et al: NCBI GEO: Archive for functional
genomics data sets-update. Nucleic Acids Res. 41:D991–D995.
2013.PubMed/NCBI View Article : Google Scholar
|
|
20
|
Chandrashekar DS, Bashel B, Balasubramanya
SAH, Creighton CJ, Ponce-Rodriguez I, Chakravarthi BVSK and
Varambally S: UALCAN: A portal for facilitating tumor subgroup gene
expression and survival analyses. Neoplasia. 19:649–658.
2017.PubMed/NCBI View Article : Google Scholar
|
|
21
|
Livak KJ and Schmittgen TD: Analysis of
relative gene expression data using real-time quantitative PCR and
the 2(-Delta Delta C(T)) method. Methods. 25:402–408.
2001.PubMed/NCBI View Article : Google Scholar
|
|
22
|
Dong M, Yang G, Liu H, Liu X, Lin S, Sun D
and Wang Y: Aged black garlic extract inhibits HT29 colon cancer
cell growth via the PI3K/Akt signaling pathway. Biomed Rep.
2:250–254. 2014.PubMed/NCBI View Article : Google Scholar
|
|
23
|
Zhu Y, Wu F, Hu J, Xu Y, Zhang J, Li Y,
Lin Y and Liu X: LDHA deficiency inhibits trophoblast proliferation
via the PI3K/AKT/FOXO1/CyclinD1 signaling pathway in unexplained
recurrent spontaneous abortion. FASEB J. 37(e22744)2023.PubMed/NCBI View Article : Google Scholar
|
|
24
|
Mills JN, Rutkovsky AC and Giordano A:
Mechanisms of resistance in estrogen receptor positive breast
cancer: Overcoming resistance to tamoxifen/aromatase inhibitors.
Curr Opin Pharmacol. 41:59–65. 2018.PubMed/NCBI View Article : Google Scholar
|
|
25
|
Politz O, Siegel F, Bärfacker L, Bömer U,
Hägebarth A, Scott WJ, Michels M, Ince S, Neuhaus R, Meyer K, et
al: BAY 1125976, a selective allosteric AKT1/2 inhibitor, exhibits
high efficacy on AKT signaling-dependent tumor growth in mouse
models. Int J Cancer. 140:449–459. 2017.PubMed/NCBI View Article : Google Scholar
|
|
26
|
Holloway RW, Bogachev O, Bharadwaj AG,
McCluskey GD, Majdalawieh AF, Zhang L and Ro HS: Stromal adipocyte
enhancer-binding protein (AEBP1) promotes mammary epithelial cell
hyperplasia via proinflammatory and hedgehog signaling. J Biol
Chem. 287:39171–39181. 2012.PubMed/NCBI View Article : Google Scholar
|
|
27
|
Guo Y, Yang K, Harwalkar J, Nye JM, Mason
DR, Garrett MD, Hitomi M and Stacey DW: Phosphorylation of cyclin
D1 at Thr 286 during S phase leads to its proteasomal degradation
and allows efficient DNA synthesis. Oncogene. 24:2599–2612.
2005.PubMed/NCBI View Article : Google Scholar
|
|
28
|
Guo X, Li W, Wang Q and Yang HS: AKT
activation by pdcd4 knockdown up-regulates cyclin D1 expression and
promotes cell proliferation. Genes Cancer. 2:818–828.
2011.PubMed/NCBI View Article : Google Scholar
|
|
29
|
Wang Z, Wang Y, Wang S, Meng X, Song F,
Huo W, Zhang S, Chang J, Li J, Zheng B, et al: Coxsackievirus A6
induces cell cycle arrest in G0/G1 phase for viral production.
Front Cell Infect Microbiol. 8(279)2018.PubMed/NCBI View Article : Google Scholar
|
|
30
|
Li S, Juan CX, Feng AM, Bian HL, Liu WD,
Zhang GQ, Wang CZ, Cao Q and Zhou GP: Attenuating the abnormally
high expression of AEBP1 suppresses the pathogenesis of childhood
acute lymphoblastic leukemia via p53-dependent signaling pathway.
Eur Rev Med Pharmacol Sci. 23:1184–1195. 2019.PubMed/NCBI View Article : Google Scholar
|
|
31
|
Lin KN, Zhao W, Huang SY and Li H: Grape
seed proanthocyanidin extract induces apoptosis of HL-60/ADR cells
via the Bax/Bcl-2 caspase-3/9 signaling pathway. Transl Cancer Res.
10:3939–3947. 2021.PubMed/NCBI View Article : Google Scholar
|
|
32
|
Choi JH, Bogenberger JM and Tibes R:
Targeting apoptosis in acute myeloid leukemia: Current status and
future directions of BCL-2 inhibition with venetoclax and beyond.
Target Oncol. 15:147–162. 2020.PubMed/NCBI View Article : Google Scholar
|