Introduction
Rapid infectious disease identification is critical
in clinical decision making, enhancing epidemiological surveillance
and outbreak control and reducing healthcare costs. The vibrational
spectroscopic method, a recent technique which facilitates the
identification of pathogens by their unique whole organism
fingerprint, meets the requirements for speed and accuracy
(1). Raman spectrometry (RS) is
gaining popularity in numerous fields, particularly medical and
clinical research (2). RS
identifies pathogens through the inelastic scattering of photons
from biological molecules following a primary radiation strike
(3). A powerful technique,
surface-enhanced Raman spectroscopy (SERS) can enhance the ability
to identify biological molecules up to 1015 times that
of traditional RS. SERS can detect very low concentrations of
biological molecules such as proteins, DNA and metabolites) using
minimal sample volumes (~1-2 µl) within 10 min; sample processing
and analysis can be completed within 3 h. Therefore, SERS offers
rapid detection, single-molecule detection with clearer signals,
lower fluorescence backgrounds, and greater accuracy in complex
matrices than traditional RS (4,5). It is
also simpler, more time efficient, cost-effective and sensitive
than other techniques (2), holding
significant potential for development as a powerful tool for
point-of-care testing (POCT).
Mycobacterium species include M.
tuberculosis, M. leprae and nontuberculous mycobacteria
(NTM), causative agents of various human diseases. NTM are
responsible for pulmonary, cutaneous, and lymphatic infections as
well as systemic disseminated disease, markedly affecting global
morbidity and mortality rates (6,7).
Globally, the incidence and prevalence of NTM diseases are on the
rise (8,9). M. abcsessus is a significant,
rapidly growing species comprising three primary subspecies: M.
abscessus subsp. abscessus (MAB), M. abscessus
subsp. massiliense (MMAS), and M. abscessus subsp.
bolletii (10).
Multiple techniques have been developed for the
diagnosis of Mycobacterium infections, including
microbiological culture, biochemical assays and the polymerase
chain reaction, matrix-assisted laser desorption/ionization-time of
flight mass spectrometry (MALDI-TOF MS), and DNA sequencing
(11-15).
MALDI-TOF MS is a modern, reliable, accurate, high-throughput
technique used to identify proteins via peptide mass fingerprinting
and is gaining popularity for use in bacterial species-level
identification (16,17). However, it remains limited in the
discrimination of closely related M. abscessus subspecies.
Thus, identifying these NTM at the subspecies level requires the
implementation of novel approaches for simple, rapid and highly
accurate discrimination (18).
The present study aimed to establish a SERS
competence model for distinguishing Mycobacterium species
and M. abscessus subspecies by detecting genomic DNA and
using machine learning (ML) algorithms. SERS holds potential as a
simple, rapid, accurate, and cost-effective method in routine
microbiology testing based on genomic DNA analysis.
Materials and methods
Study design and workflow
The present study comprised two phases: Bacterial
cultivation and data acquisition (Phase I) and data processing and
computational analyses (Phase II; Fig.
1). In Phase I, collected samples of all bacteria maintained in
the biobank stock were re-cultured. Previously, isolated M.
abscessus was identified by whole-genome sequencing (WGS)
(19). In the present study, the
bacterial DNA were extracted, dropped on SERS substrates and
air-dried. The DNA signals were measured using a portable Raman
spectrometer (National Electronics and Computer Technology Center).
In Phase II, the data were processed using the Python programming
languages with the leave-one-out cross-validation (LOOCV) function
to distinguish the NTM subspecies (MAB and MMAS) and MTB-H37Ra. The
Raman mapping approach (20) was
used to increase sensitivity. In the SERS spectra validation,
spectra were evaluated based on the peak assignments. The ML
approaches, including principal component analysis (PCA), uniform
manifold approximation and projection (UMAP), linear discriminant
analysis (LDA), random forest (RF), extreme gradient boosting
(XGB), and logistic regression (LR), were analyzed. The performance
of the constructed classification models was evaluated using the
receiver operating characteristic (ROC) curve and area under the
curve (AUC) to quantify discriminative ability.
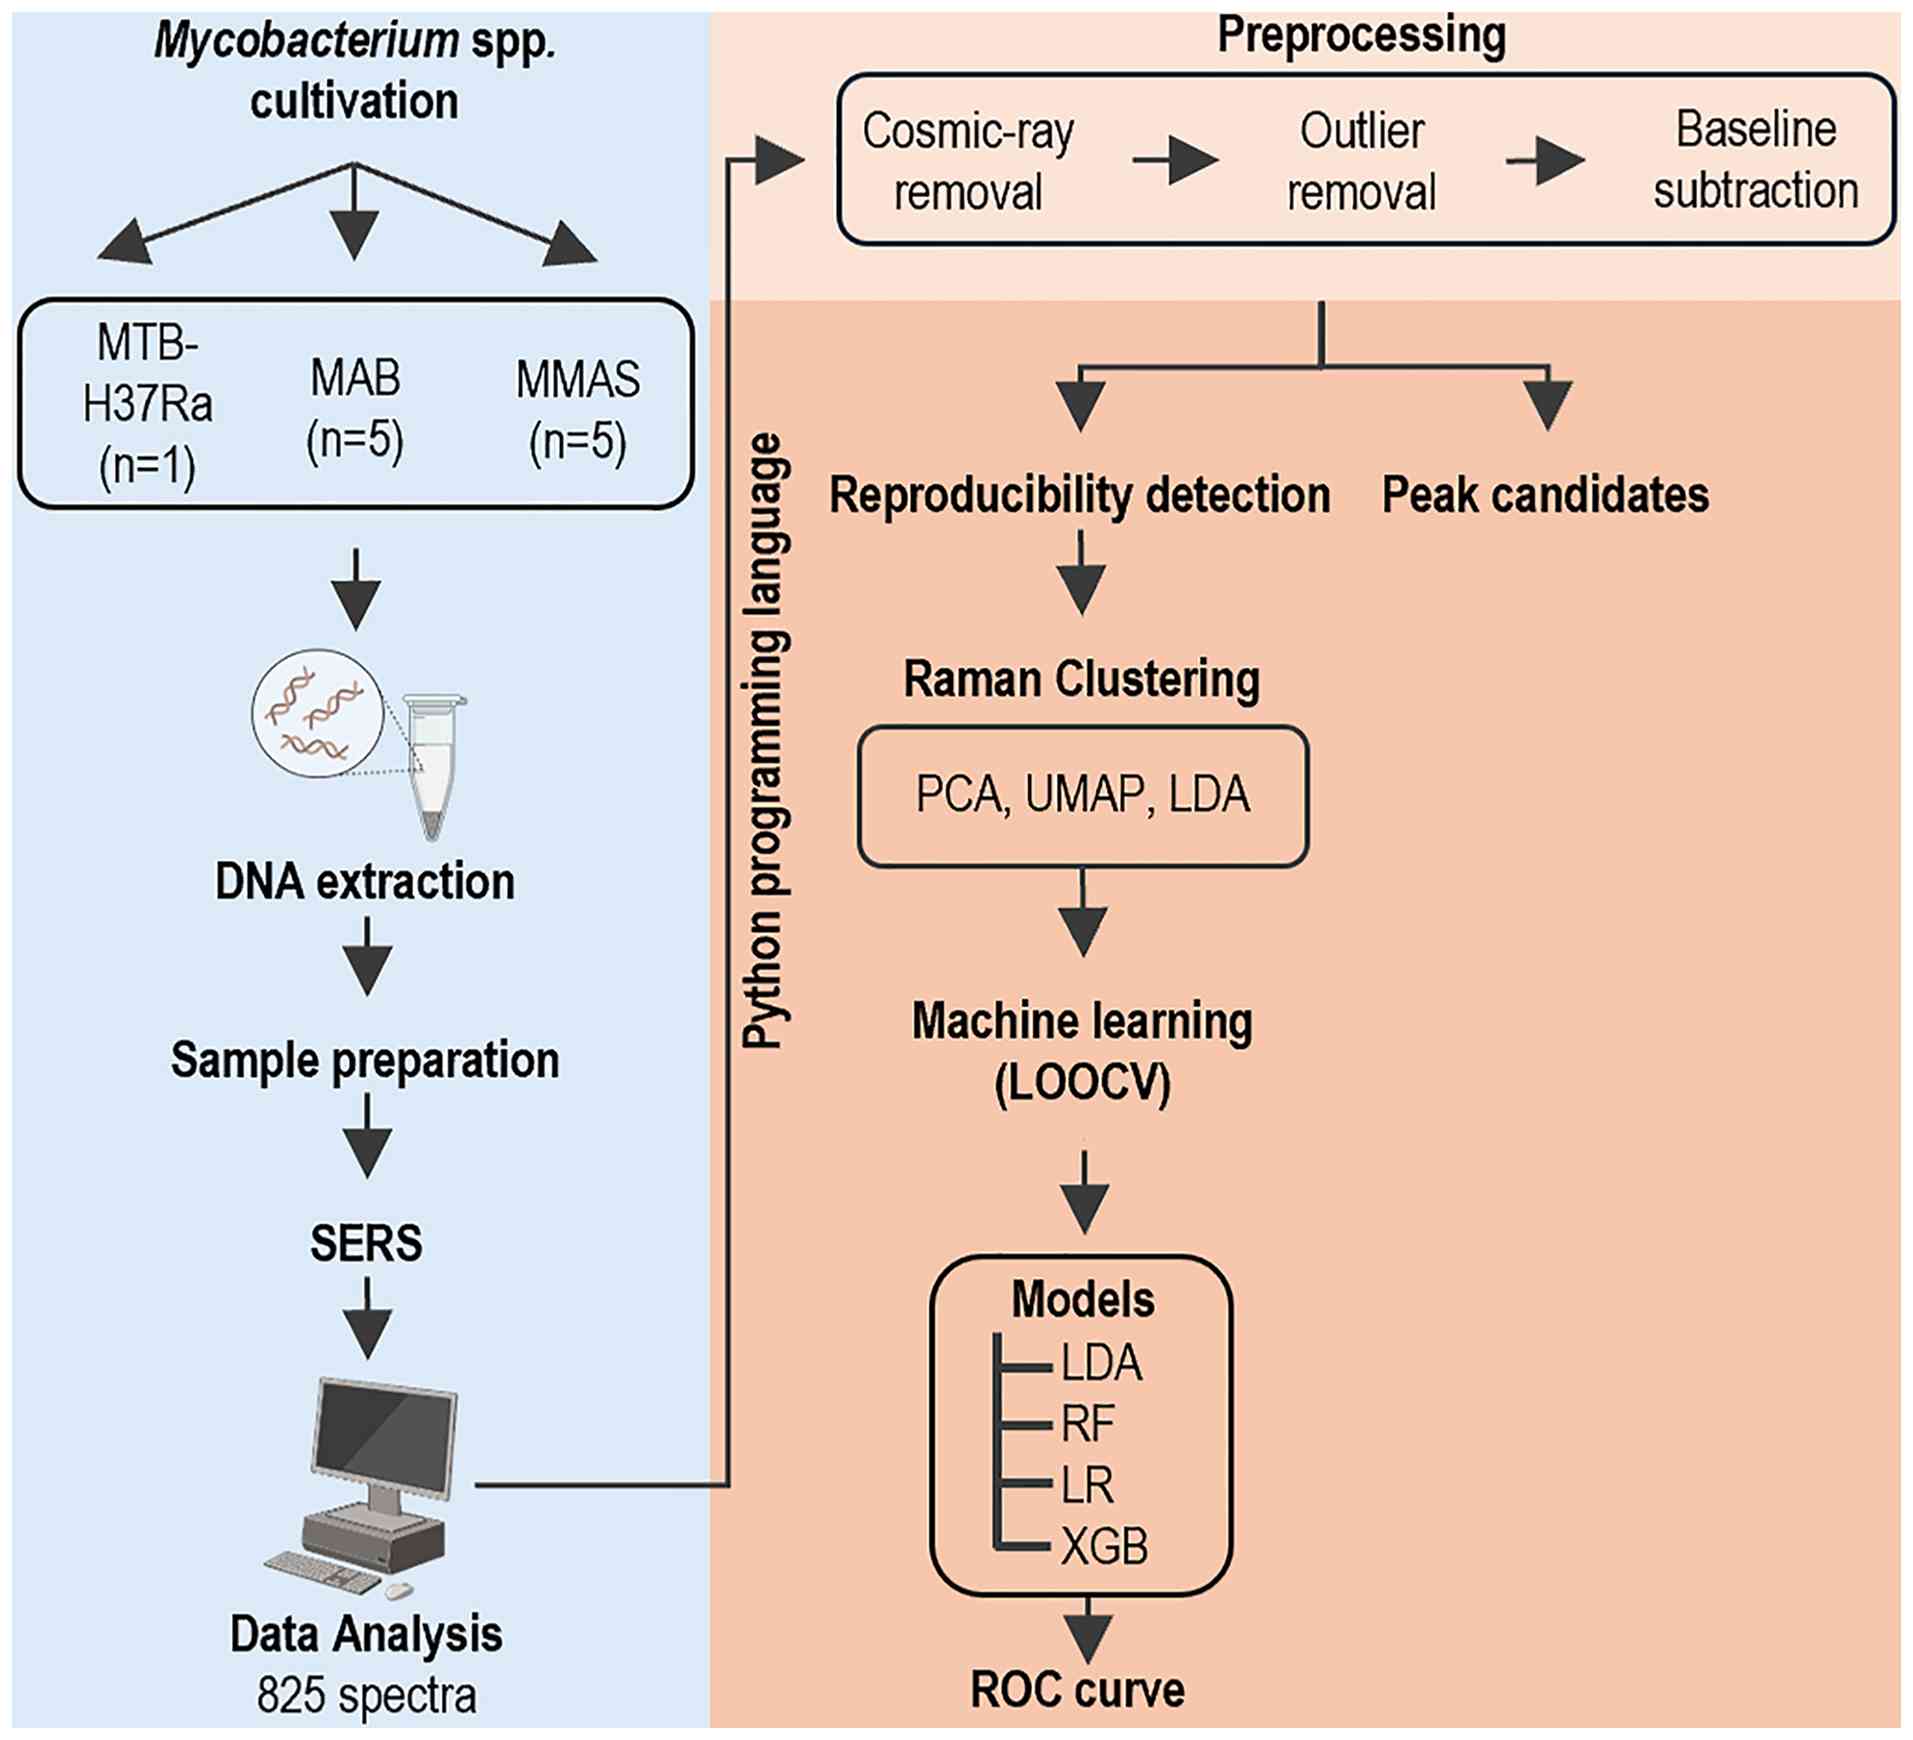 | Figure 1Study workflow (experimental design
and analysis). The design of the present study comprised two
phases. Phase I (blue background; left hand): Bacterial cultivation
and data acquisition; collected bacterial samples maintained in the
biobank stock were re-cultured. Bacterial DNA were then extracted,
dropped on SERS substrates, and air-dried. DNA signals were
measured using a portable Raman spectrometer. Phase II (peach-pink
background; right hand): Data processing and computational
analyses; data were processed using the Python programming
languages using the LOOCV function to distinguish the NTM
subspecies (MAB and MMAS) and MTB-H37Ra. For validation, SERS
spectra were evaluated based on the peak assignments. The ML
approaches (PCA, UMAP, LDA, RF, XGB, and LR) were analyzed.
Performance of the constructed classification models was evaluated
using ROC curves and the AUC to quantify discriminative ability.
LOOCV, leave-one-out cross-validation; NTM, nontuberculous
mycobacteria; MAB, M. abscessus subspecies abscessus;
MMAS, M. abscessus subspecies massiliense; MTB-H37Ra,
M. tuberculosis H37Ra; SERS, surface-enhanced Raman
spectroscopy; ML, machine learning; PCA, principal component
analysis; UMAP, uniform manifold approximation and projection; LDA,
linear discriminant analysis; RF, random forest; XGB, extreme
gradient boosting; LR, logistic regression; ROC, receiver operating
characteristic; AUC, area under the curve. |
Bacterial isolation and
cultivation
The bacteria used in the present study included NTM
(M. abscessus subspecies: MAB and MMAS) and MTB-H37Ra (ATCC
25177; nonvirulent strain). The NTM were isolated from patients
between 2012 and 2017 and retrieved from archived stock cultures at
the Clinical Microbiology Laboratory Unit, Srinagarind Hospital,
Khon Kaen University Khon Kaen, Thailand. MTB-H37Ra was kindly
given by Professor Prasit Palittapongarnpim, Department of
Microbiology, Faculty of Science, Mahidol University, Thailand
(21). In the present study, the
bacteria were re-subcultured on sheep blood agar (Quality Media and
Supply Co. Ltd.) at 37˚C for 5 days. Middlebrook 7H9 broth liquid
medium (Becton, Dickinson and Company) was used for MTB-H37Ra
recultivation. The present study was approved and all protocols
regulated by the Khon Kaen University Ethics Committee for Human
Research (approval no. HE 591454).
In our previous study, genomic DNA samples were
sequenced using the Illumina high-throughput platform at
NovogeneAIT Genomics (Novogene Co., Ltd.). Based on this WGS
analysis, NTM were divided into MAB and MMAS, corresponding to
subspecies of M. abscessus identified by rpoB gene
sequences (13). The accession
numbers were shown as Table SI
(19,22), however, one isolate of MMAS was
identified by MALDI-TOF.
Genomic DNA extraction
Bacterial genomic DNA was extracted from three full
loops of pure colonies cultured on blood agar (Clinag Co. Ltd.).
The bacterial pellet was washed twice with 1 ml Tris-EDTA buffer,
then centrifuged at 13,416 x g and room temperature for 10 min. All
genomic DNA was extracted using the cetyltrimethylammonium bromide
(CTAB) method (19,23). Bacterial cell lysis began with
incubation in 10 mg/ml lysozyme, followed by the sequential
addition of 10% sodium dodecyl sulfate, 10 mg/ml proteinase K and
CTAB solutions to disrupt the cell membranes. Cold absolute ethanol
and 5 M sodium chloride were added to precipitate the DNA. Genomic
DNA samples were resuspended in sterile nuclease-free water
(Invitrogen; Thermo Fisher Scientific, Inc.) and measured using
Nanodrop (Thermo Fisher Scientific, Inc.). A range of DNA
concentrations (5, 10, 15, 20, 25 and 50 ng/µl) was prepared and
stored at -20˚C until SERS analysis.
Raman spectroscopy acquisition
The SERS measurements were acquired using a portable
RS device, with 2 µl of 5, 10, 15, 20, 25 and 50 ng/µl DNA samples
individually dropped onto the center of a silver-based SERS sensor
and left to air dry for 10 min. The Raman spectrum was collected
from the central region of the drop. Spectral acquisition was
performed using a wavelength of 785 nm with an exposure time of 20
sec. Spectral data were collected from 25 points arranged in a 5x5
mapping grid with 0.1 mm spacing. Each sample was measured in
triplicate. The optimal protocol in a previous study was used in
this experiment (24). The Raman
spectrum fingerprint region (600-1,800 cm-¹) represents
the biological components of bacterial cells, including proteins,
lipids, and nucleic acids (25).
The key peak locations, primarily attributed to nucleic acid
components, are summarized in Table
SII. The observed Raman peaks correspond with those reported in
previous studies (26-37).
Raman spectral data processing
The Raman spectra from triplicate mapping (75 data
points) of each isolate were collected. A total of 825 datasets
were initially preprocessed by removing cosmic rays and outliers,
followed by signal averaging for each Raman-mapped dataset. The
analysis was performed by supervised ML using the Python
programming language based on the LOOCV approach. The data included
three classes (MAB, MMAS and MTB-H37Ra). The ML models were trained
on PCA, UMAP, LDA, RF, XGB and LR algorithms from the Scikit-learn
library (38). In this procedure,
one Raman-mapped data point from each isolate was used as the test
set; the remaining 824 data points from other isolated samples
constituted the training set. These processes were repeated until
all datasets were tested, and the average accuracy was
recorded.
The performance of the classification models (LDA,
RF, XGB and LR) was evaluated using ROC analysis. The AUC was used
to quantify discriminative ability, calculated for each model to
assess the trade-off between sensitivity (true positive rate) and
specificity (1-false positive rate) across various classification
thresholds. The ROC curves and AUC values were used to compare the
overall classification efficacy of the ML approaches.
Statistical analysis
Multiple comparisons for non-parametric independent
samples were analyzed using the Kruskal-Wallis test. Adjusted
P-values using Dunn-Bonferroni post-hoc analysis were later used to
identify pairwise differences between groups. Pearson's and
Spearman's correlation analyses were performed to assess the
reproducibility of SERS spectra. The coefficient values converging
toward 1.00 indicate high reproducibility and excellent
consistency. Sensitivity, specificity, and accuracy were recorded
using a confusion matrix in the Python programming language. The
formulas are as follows: sensitivity=true positive/(true positive +
false negative); specificity=true negative/(true negative + false
positive); accuracy=average of sensitivity and specificity.
P<0.05 was considered to indicate a statistically significant
difference.
Results
Minimal concentration of bacterial
genomic DNA for SERS detection
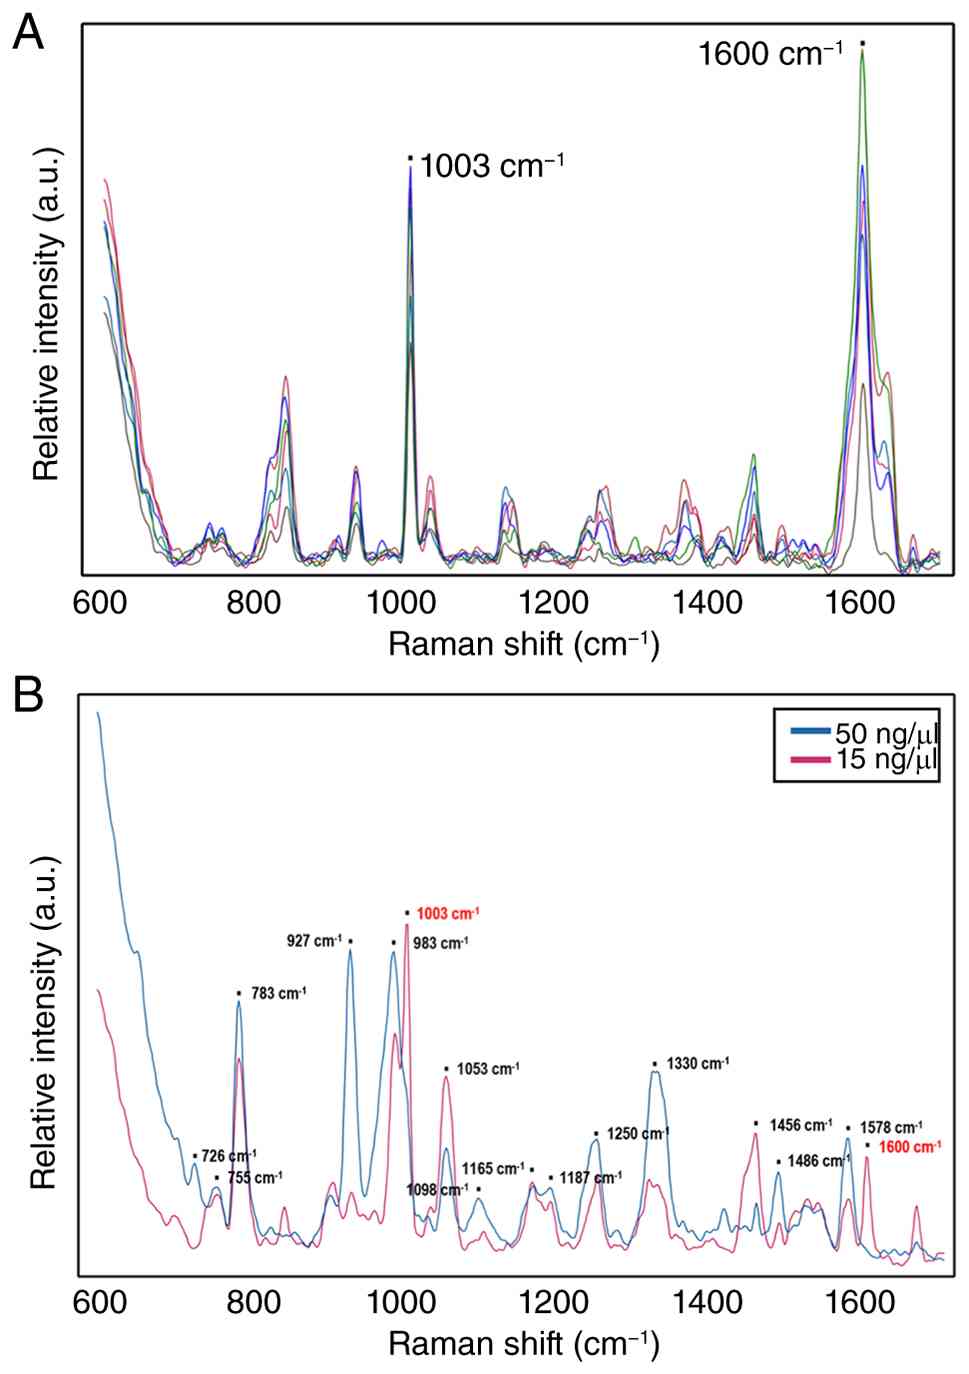
The minimal detectable concentration for genomic DNA
was determined using SERS. For bacterial genomic DNA samples, Raman
maps were acquired in triplicate. Within each map, 25 individual
Raman spectra were collected, resulting in a total of 75 spectra
(25 spectra/map x3 maps) per sample. Raman mapping can obtain all
signals from each specified point. To ensure signal responsiveness
and usability prior to sample analysis, each SERS substrate was
thoroughly tested; it was confirmed that the SERS chip exhibited
specific background peaks at 1,003 and 1,600 cm-¹
(Fig. 2A). M. abscessus
genomic DNA was then dropped at a concentration of 50 ng/µl onto
the SERS chip. Prominent peaks were observed in the 600-1,800
cm-¹ range at 726, 755, 783, 927, 983, 1,053, 1,098,
1,165, 1,187, 1,250, 1,330, 1,486 and 1,578 cm-¹.
Genomic DNA samples at concentrations of 5, 10, 15, 20 and 25 ng/µl
were also tested. Clear peak visibility was maintained at 15-50
ng/µl (Fig. 2B). At lower
concentrations, some peaks disappeared and interference from other
peaks were more noticeable. Therefore, 15 ng/µl may be considered
the minimum detectable concentration with clear DNA features, with
50 ng/µl demonstrating the most reliable spectral analysis.
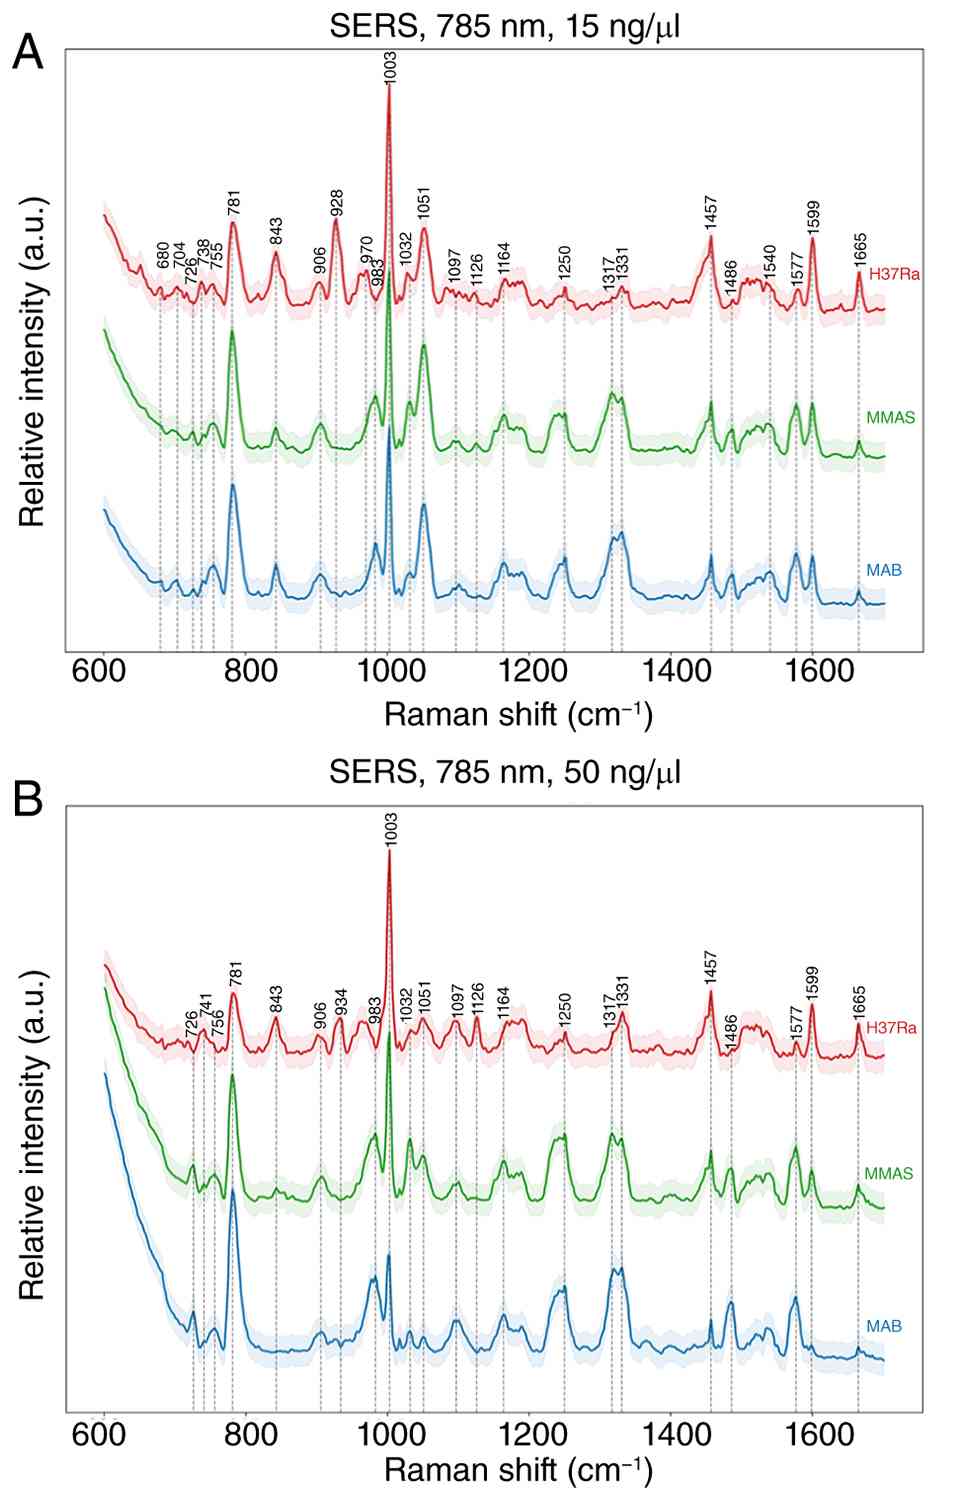
Raman spectra of genomic DNA
Raman spectra of genomic DNA at 15 and 50 ng/µl were
obtained using SERS at 785 nm (Fig.
3). The characteristic bands of the two M. abscessus
subspecies (MAB and MMAS) and MTB-H37Ra were analyzed. Peaks 726,
755, 781 and 1,317 cm-¹, corresponding to nucleic acids,
were the most intense in MAB and MMAS; MTB-H37Ra exhibited the
strongest peaks at 755, 781, and 1,317 cm-¹. The
1,000-1,250 cm-¹ region corresponds to the asymmetric
stretching mode of the phosphate deoxy group, with the peak at
1,097 cm-¹ the most prominent for Mycobacterium.
The 1,331 cm-¹ band corresponds to vibrations of bases
coupled with sugar vibrations, specifically adenine and guanine
bases. Vibrational bands in the 1,450-1,800 cm-¹ range,
corresponding to double bond stretching of residual bases, were
observed at 1,486 and 1,577 cm-¹ in MAB and MMAS;
MTB-H37Ra showed a weaker band at 1,486 cm-¹.
SERS spectral analysis compared with
Mycobacterium species and subspecies
Raman spectra exhibiting a relative standard
deviation <50% were selected as reliable peak markers (Table SII). Notably, all three bacteria
exhibited abundant peak assignments primarily related to genomic
DNA. SERS performance was subsequently evaluated using eight
candidate peak markers at 15 and 50 ng/µl DNA concentrations
(Figs. 4 and 5). These peak markers revealed significant
spectral differences, indicating variations in biomolecule content
and abundance across species (NTM: MAB/MMAS vs. MTB-H37Ra) and even
subspecies (MAB and MMAS). These distinct biomolecular profiles
allow for the identification of bacterial features using useful
factors. The eight candidate peaks were selected and evaluated by
the significance of their P-values, highlighting their
discriminatory power.
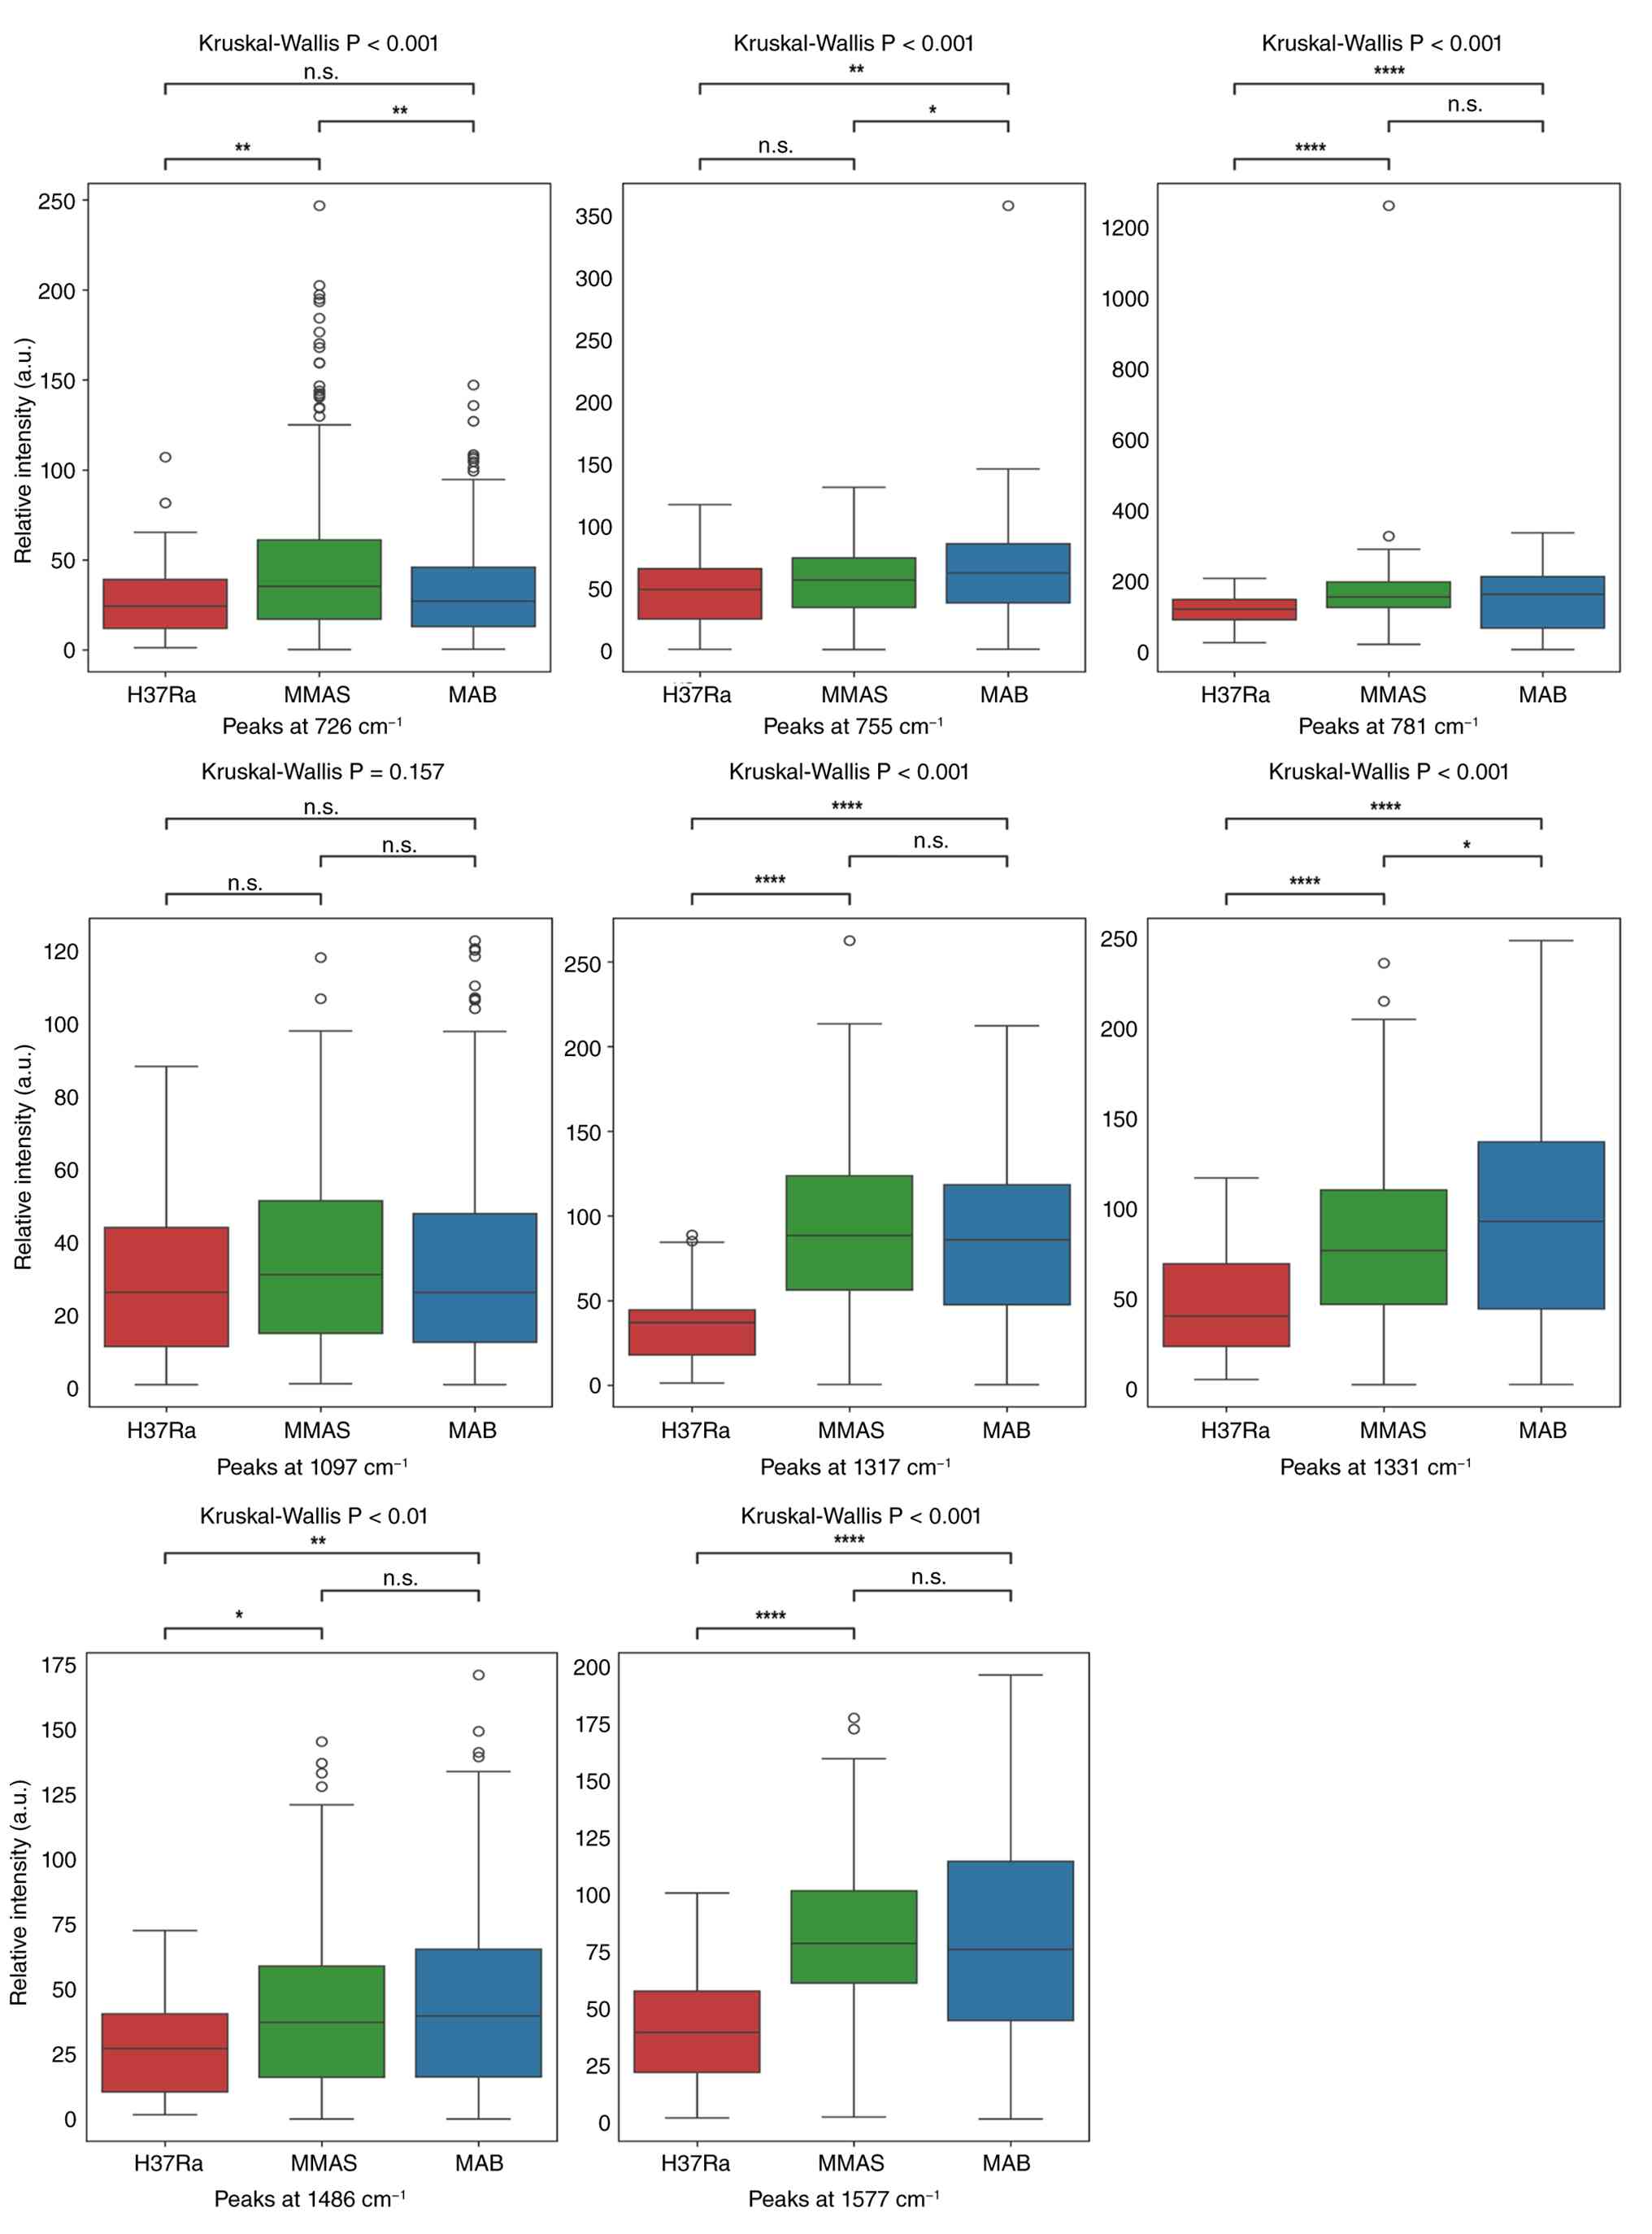 | Figure 4Box plot comparisons of peak
intensities for eight candidate peaks for bacterial DNA content at
15 ng/µl. The specific Raman intensities examined were at 726, 755,
781, 1,097, 1,317, 1,331, 1,486 and 1,577 cm-¹. The
y-axis represents the relative intensity of the peaks; the x-axis
indicates the bacterial DNA species. Multiple comparisons were
analyzed by Kruskal-Wallis test prior to examining pairwise
differences between groups by using Dunn-Bonferroni post-hoc
analysis. *P<0.05, **P<0.01, and
****P<0.0001; n.s., non-significant. H37Ra, M.
tuberculosis H37Ra; MMAS, M. abscessus subspecies
massiliense; MAB, M. abscessus subspecies
abscessus; a.u., arbitrary unit. |
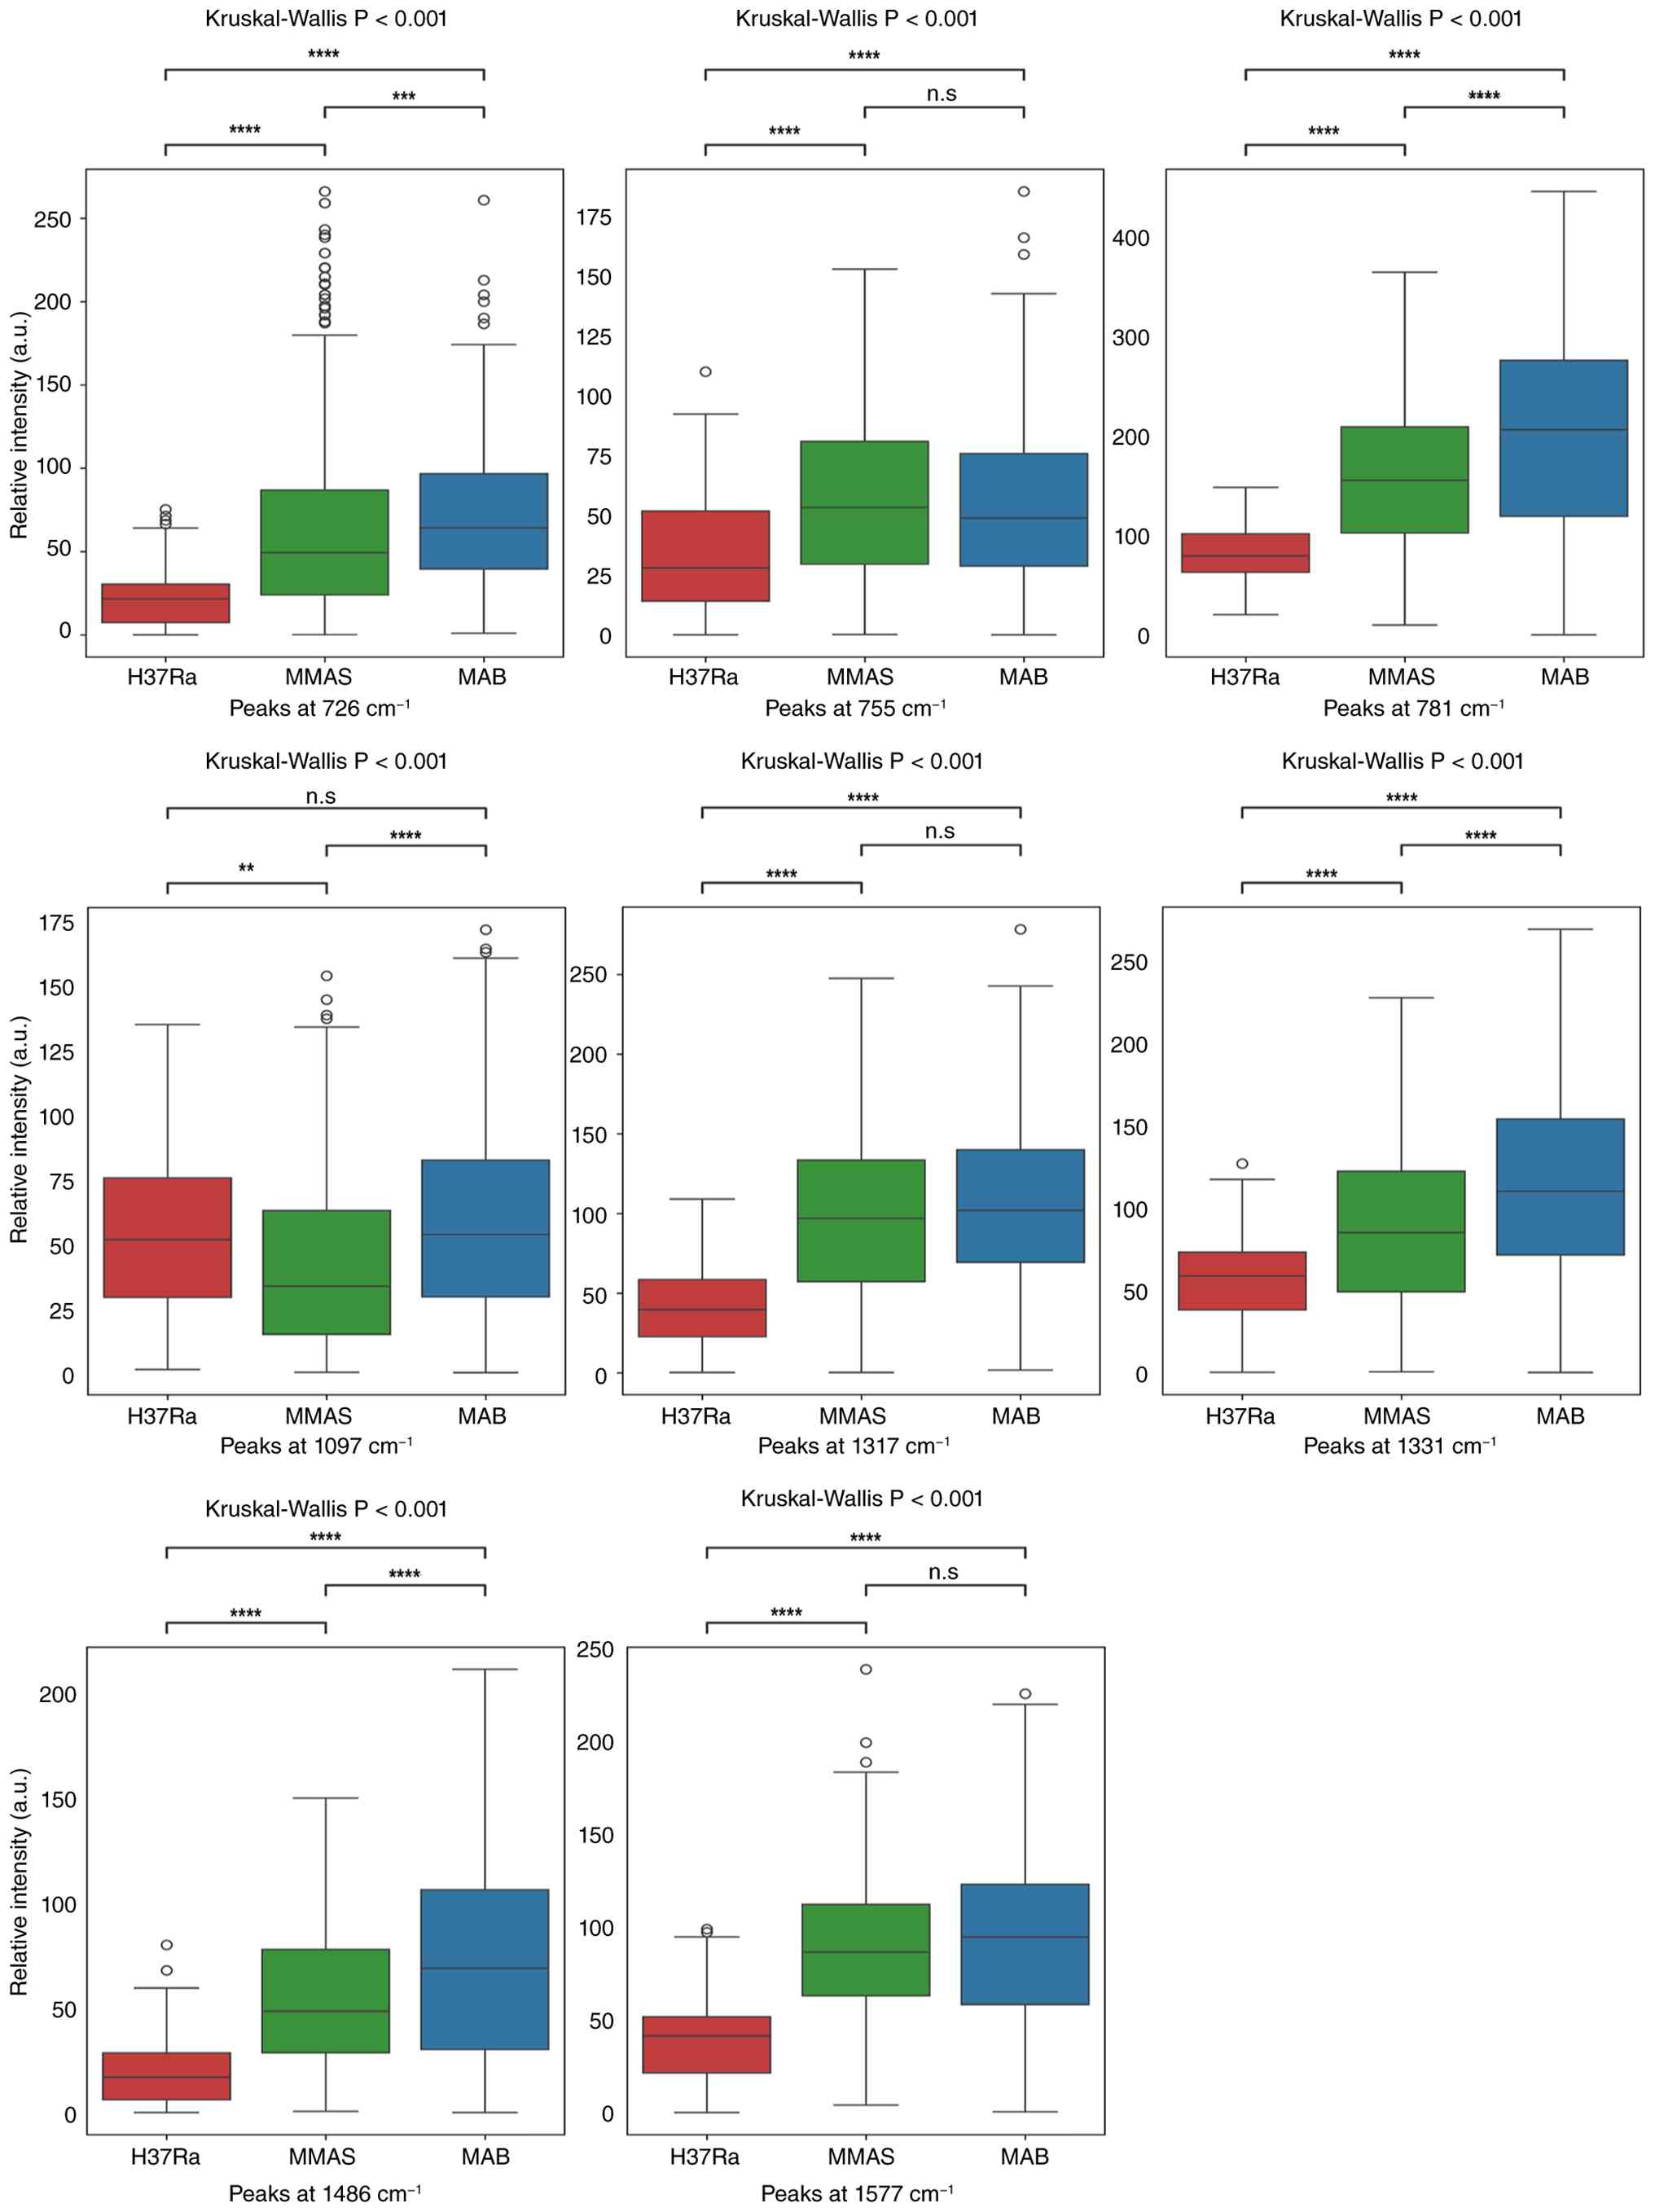 | Figure 5Box plot comparisons of peak
intensities for eight candidate peaks for bacterial DNA content at
50 ng/µl. The specific Raman intensities examined were at 726, 755,
781, 1,097, 1,317, 1,331, 1,486, and 1,577 cm-¹. The
y-axis represents the relative intensity of the peaks; the x-axis
indicates the bacterial DNA species. Multiple comparisons were
analyzed by Kruskal-Wallis test prior to examining pairwise
differences between groups by using Dunn-Bonferroni post-hoc
analysis. **P<0.01, ***P<0.001 and
****P<0.0001; n.s., non-significant. H37Ra, M.
tuberculosis H37Ra; MMAS, M. abscessus subspecies
massiliense; MAB, M. abscessus subspecies
abscessus; a.u., arbitrary unit. |
Discriminating Mycobacterium
subspecies using ML approaches
SERS spectral data were analyzed using PCA (Fig. 6A), UMAP (Fig. 6B), and LDA (Fig. 6C). UMAP and PCA could not clearly
distinguish the bacterial groups. However, LDA effectively
separated the three bacteria into distinct clusters, demonstrating
that SERS spectral data contain sufficient information for reliable
differentiation when combined with appropriate dimensionality
reduction techniques.
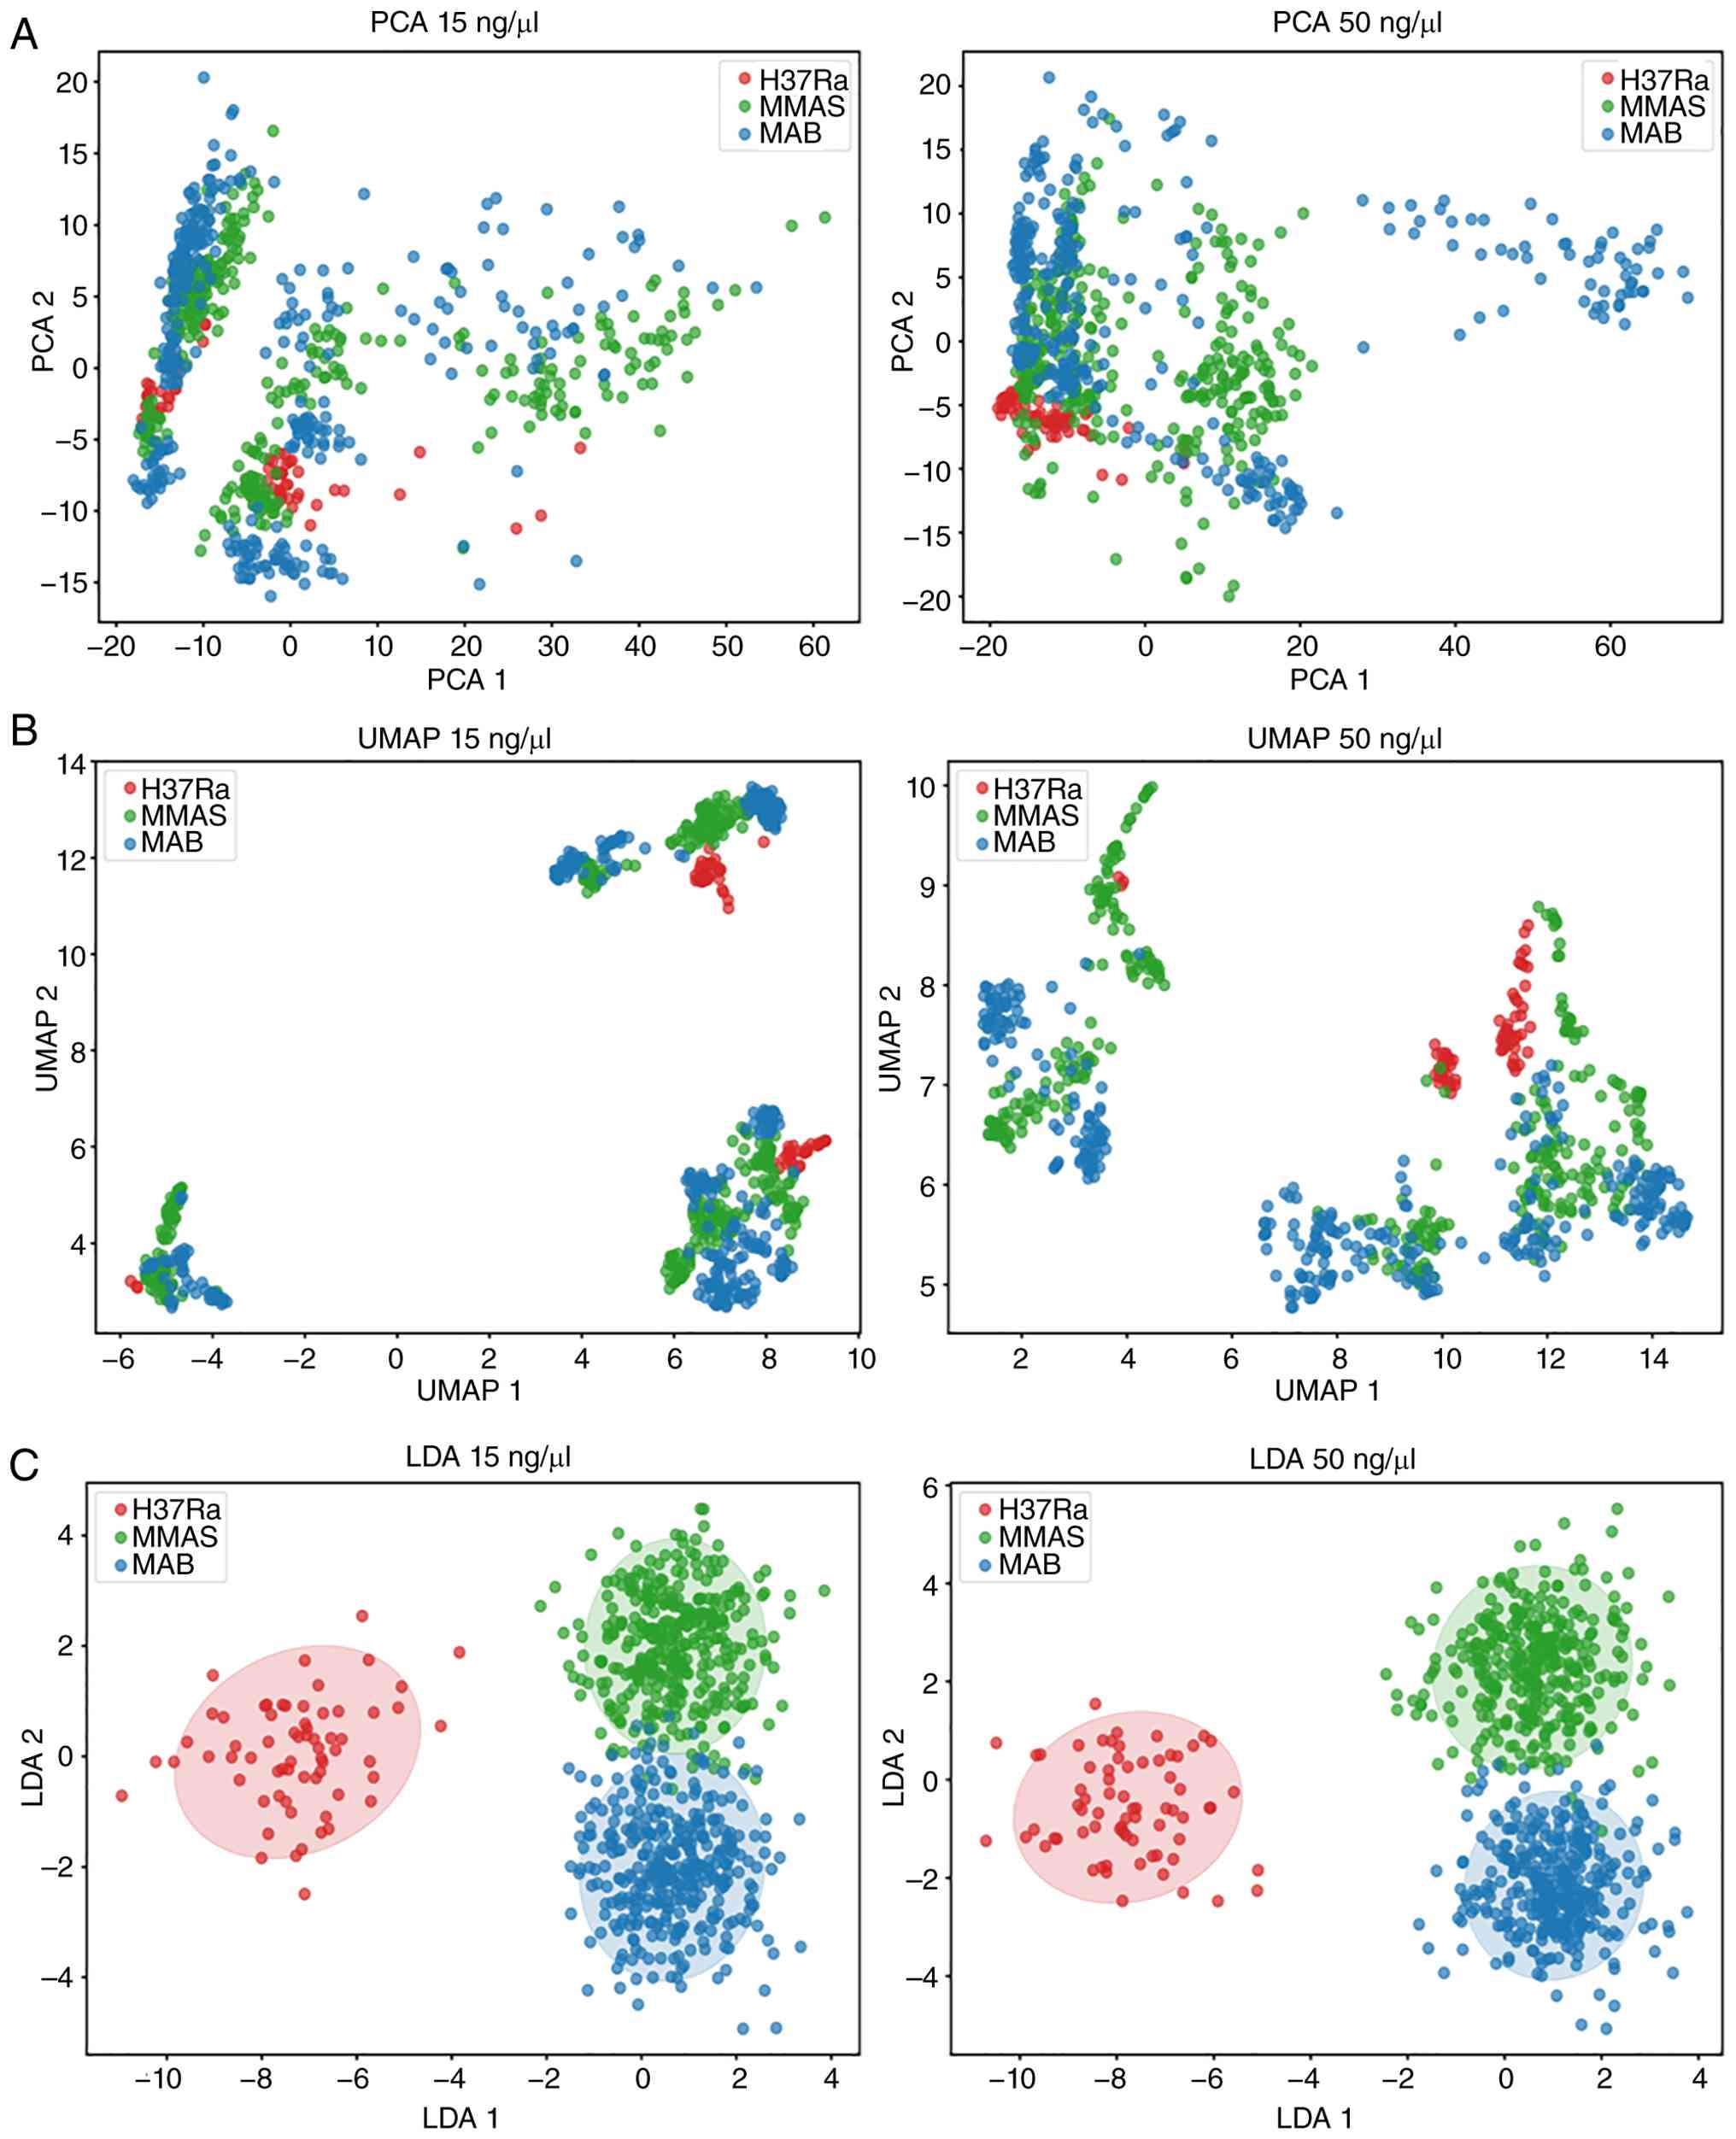 | Figure 6Plot analysis of PCA, UMAP and LDA.
Plots compare three bacteria at genomic DNA concentrations of 15
(left hand) and 50 ng/µl (right hand). (A) PCA, (B) UMAP, and (C)
LDA were analysed and represented in dot plot. Blue dots represent
MAB, green dots indicate MMAS, and red dots represent MTB-H37Ra.
PCA, principal component analysis; UMAP, uniform manifold
approximation and projection; LDA, linear discriminant analysis;
MAB, M. abscessus subspecies abscessus; MMAS, M.
abscessus subspecies massiliense; MTB-H37Ra, M.
tuberculosis H37Ra. |
To further explore the utility of this approach, ML
was employed for classification. This involved the LOOCV strategy,
with four models evaluated: LDA, XGB, RF, and LR (Table I). The XGB model demonstrated the
highest performance in NTM subgroup classification (MAB vs. MMAS),
achieving accuracies of 96.25 and 92.97% (F1-scores 96.32 and
92.94%) at 15 and 50 ng/µl DNA, respectively. The LR model proved
most effective at distinguishing between the NTM and MTB-H37Ra
groups, delivering near-perfect discrimination with accuracies of
99.74 and 99.73% (F1-scores 99.86 and 99.85%) at both
concentrations. ROC curves were generated to evaluate the
performance of each model and determine sensitivity and
specificity, and the best AUC values of each model were calculated
(Fig. 7). Notably, the sum of the
sensitivity (true positive rate) and specificity (1-false positive
rate), as represented by the calculated AUC values, was
consistently close to 1, highlighting the effectiveness of the
models at distinguishing the different bacterial classes. The ROC
curves confirmed these findings, with the XGB model showing strong
performance in the NTM group (MAB and MMAS; Fig. 7A) and the LR model achieving a
perfect AUC of 1 for distinguishing the NTM from the MTB-H37Ra
group (Fig. 7B).
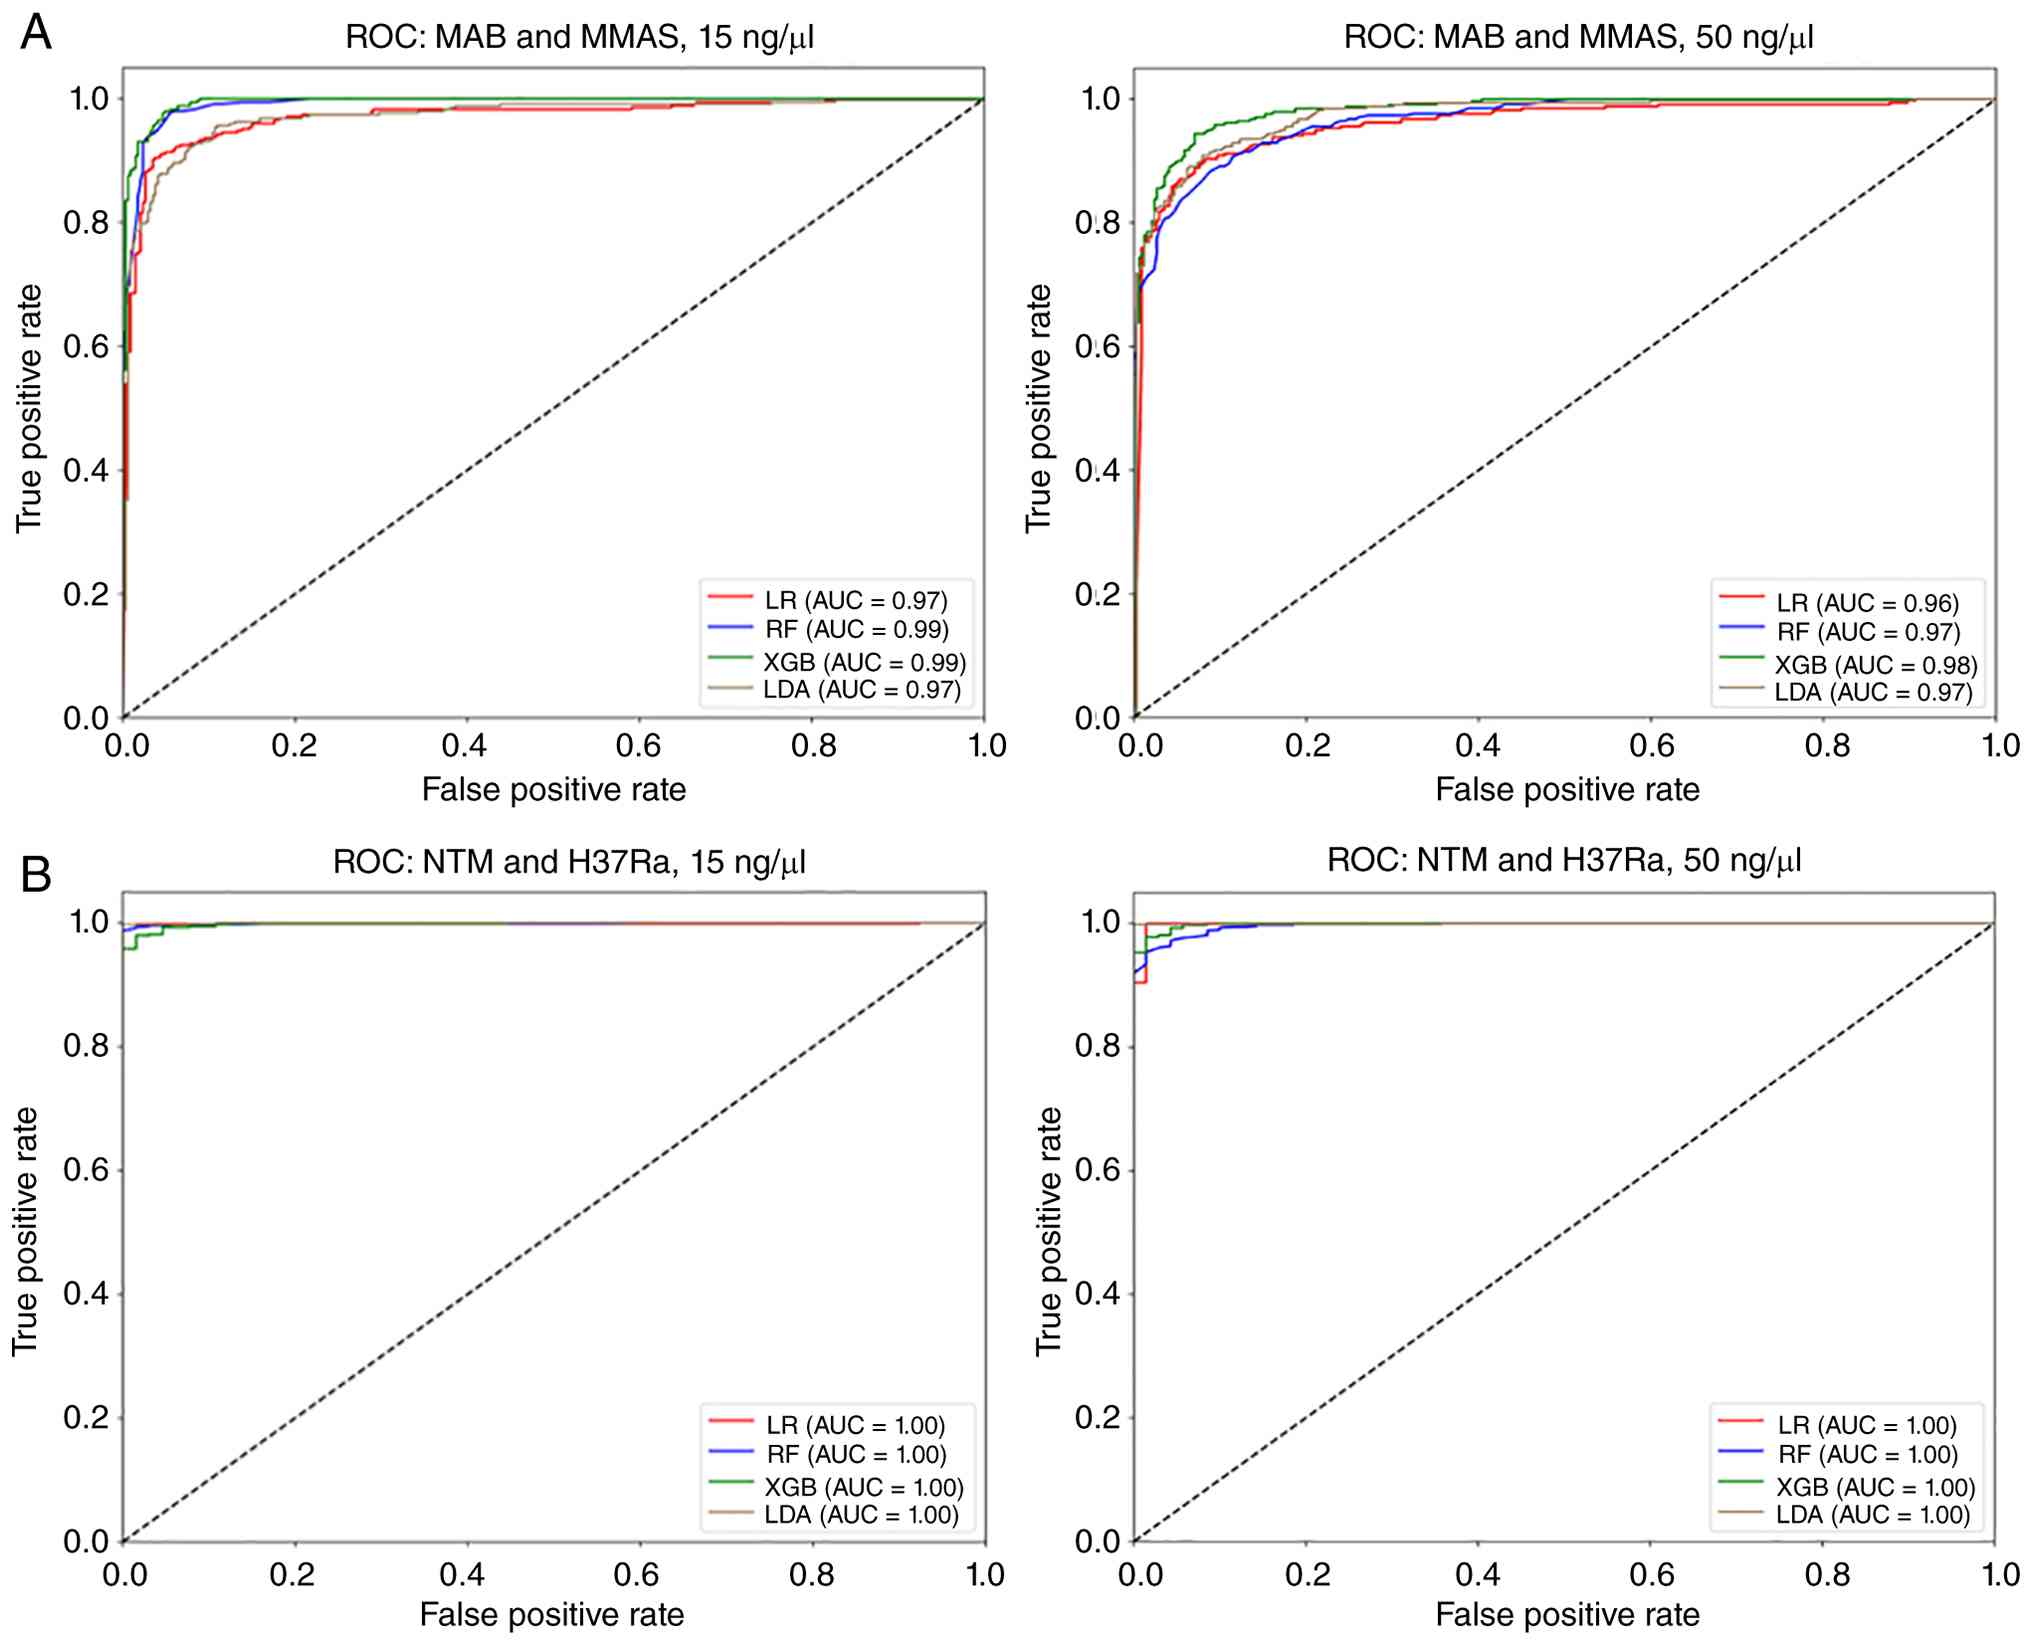 | Figure 7The LDA, XGB, RF and LR analyses of
the ROC curve. (A) MAB vs MMAS. (B) NTM group vs. MTB-H37Ra. LDA,
linear discriminant analysis; XGB, extreme gradient boosting; RF,
random forest; LR, logistic regression; ROC, receiver operating
characteristic; MAB, M. abscessus subspecies
abscessus; MMAS, M. abscessus subspecies
massiliense; NTM, nontuberculous mycobacteria; MTB-H37Ra,
M. tuberculosis H37Ra. |
 | Table ISensitivity, specificity, and
accuracy of the machine learning approach on the Raman spectral
datasets with surface-enhanced Raman spectroscopy (SERS)
sensors. |
Table I
Sensitivity, specificity, and
accuracy of the machine learning approach on the Raman spectral
datasets with surface-enhanced Raman spectroscopy (SERS)
sensors.
| | SERS at 15 ng/µl
(785 nm) | SERS at 50 ng/µl
(785 nm) |
|---|
| Classification
model | Sensitivity
(%) | Specificity
(%) | Accuracy (%) | F1-score (%) | Sensitivity
(%) | Specificity
(%) | Accuracy (%) | F1-score (%) |
|---|
| A, NTM group: MAB
(n=5) and MMAS (n=5) |
| XGB | 94.71 | 97.91 | 96.25 | 96.32 | 93.22 | 92.73 | 92.97 | 92.94 |
| LDA | 77.52 | 77.59 | 77.67 | 77.63 | 81.05 | 81.47 | 81.26 | 81.29 |
| RF | 94.71 | 97.91 | 94.81 | 96.32 | 84.70 | 93.42 | 88.58 | 89.17 |
| LR | 92.29 | 93.02 | 92.65 | 92.68 | 92.10 | 89.27 | 90.63 | 90.45 |
| B, NTM group: MAB
(n=5) and MMAS (n=5); MTB-H37Ra (n=1) |
| XGB | 97.19 | 97.83 | 97.23 | 98.51 | 99.13 | 96.97 | 98.94 | 99.42 |
| LDA | 98.14 | 85.25 | 97.10 | 98.42 | 99.70 | 87.18 | 98.41 | 99.12 |
| RF | 93.78 | 100 | 93.94 | 96.79 | 96.20 | 100 | 96.41 | 98.06 |
| LR | 99.86 | 98.46 | 99.74 | 99.86 | 99.85 | 98.57 | 99.73 | 99.85 |
Discussion
RS and SERS technologies offer several key
advantages and hold potential utility in clinical diagnostics.
These techniques enable high-throughput data generation, have rapid
turnaround times and are cost-effective, rendering them efficient
and accessible. Recently, RS has shown significant promise in the
diagnosis of cancer (39,40), dengue fever (41), diabetes (1) and tuberculous meningitis (42). RS and SERS have also been applied in
TB diagnosis (2). While MALDI-TOF
MS is the main identification method for most NTM (43), M. abscessus and M.
tuberculosis differentiation remains a challenge and M.
abscessus identification at the subspecies level is limited.
Some studies have attempted subspecies identification using protein
peak analysis (44,45); however, this is not the best
strategy to follow and requires validation with larger collections
of clinical isolates to confirm utility in a microbiology
laboratory setting.
SERS could be considered an improvement on MALDI-TOF
MS with its ability to distinguish molecular biomolecules at
subspecies resolution, higher sensitivity, lower sample volume
requirement, lack of need for extensive sample pretreatment and
special matrix reagents and shorter turnaround time (46). Compared with WGS (the gold standard
for the M. abscessus complex), SERS also requires lower
sample volumes and less preparation prior to analysis, has shorter
processing times, and is considerably more cost-effective (47). Regarding long-term storage
potential, nucleic acids (genomic SERS-based or WGS) exhibit far
greater stability and longevity than proteins, which typically
require immediate analysis following sample collection.
There is a need for novel approaches offering
simple, rapid, cost-effective, and highly accurate discrimination
of these bacteria at the species and subspecies levels. The present
study was to establish a competence SERS model for differentiating
genomic DNA of Mycobacterium species (NTM and MTB-H37Ra) and
subspecies (MAB and MMAS), with the goal of developing a powerful
tool for clinical diagnosis. However, the evaluations did not
include clinical validation or testing on external datasets, which
are critical points and should be addressed in future studies.
First, the minimal genomic DNA concentration
required for the SERS technique was determined. DNA was detected
for all three bacteria at concentrations of 5-50 ng/µl, indicating
that these concentrations allow for the observation of
characteristic signals in the Raman spectral range of 600-1,800
cm-¹ (25). SERS
analysis was performed at both 15 and 50 ng/µl DNA concentrations;
while higher concentrations yielded clearer peaks, peak detection
was possible at the lower concentration, confirming high
sensitivity. This aligns with previous findings of a strong SERS
signal for DNA at ≥1 nM, with decreasing signal intensity at lower
concentrations (48). These results
demonstrate that SERS is effective even with limited sample amounts
and that selecting appropriate DNA concentrations is crucial to
avoid background interference and ensure accurate analysis.
The SERS spectra of genomic DNA from
Mycobacterium species revealed several distinct
characteristic bands, providing a foundation for bacterial
differentiation. This analysis confirmed key spectral features
previously reported for nucleic acids: the prominent bands at 726
cm-¹ (adenine) and 781 cm-¹ (cytosine) served
as reliable markers for the nucleotide bases (26), while the 1,097 cm-¹ peak,
corresponding to the phosphodioxy (PO2-)
backbone (49), confirmed the
presence of DNA. Distinct purine and pyrimidine markers were also
observed, including bands for guanine (1,317 cm-¹) and
adenine (1,331 cm-¹), which fall within the ‘DNA
fingerprint’ region (26). The
1,486 cm-¹ peak indicates the hydrogen bonding state at
guanine’s N7 site (50) and the
1,577 cm-¹ band is a key purine marker (27). The analysis also revealed a strong
band at 755 cm-¹ (the vibrations from supercoiled DNA
structures), a finding consistent with previous research (51). This suggested that SERS may be
sensitive to secondary and tertiary structures. This structural
information, combined with the complete SERS spectral fingerprint,
could serve as a unique and powerful signature for distinguishing
bacterial species.
Despite the fact that Mycobacterium species
such as MAB/MMAS and MTB-H37Ra belong to the same genus (with the
close genetic relationship between MAB and MMAS accounting for the
broad similarity of their SERS Raman peaks), their distinct genetic
makeup results in clear differences in their SERS spectra. This
analysis revealed a notable distinction between MAB, MMAS and the
MTB-H37Ra strain. Specifically, the peaks at 1,486 and 1,577
cm-¹ were prominent in MAB and MMAS but notably weaker
in MTB-H37Ra and a strong peak at 928 cm-¹ was detected
exclusively in the MTB-H37Ra spectrum. These molecular-level
differences provide a unique ‘spectral fingerprint’, suggesting
that the genetic distance between these organisms directly
influences their SERS spectra and enables the discrimination of
even closely related species. This capacity for differentiation
based on subtle genetic and biochemical variations highlights the
potential utility of SERS in bacterial identification and
classification.
The spectra analyses revealed significant
differences in eight key Raman peaks across the MAB, MMAS, and
MTB-H37Ra genomic DNA samples. The boxplot analysis provided
critical insight into the effect of DNA concentration and genetic
relationship on SERS discrimination. At the low concentration of 15
ng/µl, the SERS spectra of the genetically similar MAB and MMAS
were largely indistinguishable, but both were distinct from the
more genetically distant MTB-H37Ra strain. This indicated that SERS
effectively differentiates between species but has limited
resolution for very closely related subspecies at lower
concentrations. At the higher DNA concentration of 50 ng/µl, the
spectral differences of all three bacteria were more pronounced,
suggesting that a higher DNA concentration enhances the ability to
detect subtle variations. Consequently, increasing the DNA
concentration may improve the discriminatory power of SERS
analysis, positioning it as a precise method of distinguishing even
very closely related bacterial species.
LDA revealed clear clustering among MAB, MMAS and
MTB-H37Ra, highlighting the potential of combining SERS with ML for
bacterial differentiation. The XGB model effectively distinguished
between the NTM (MAB vs. MMAS); the LR model was effective at
distinguishing the NTM group from MTB-H37Ra, achieving the highest
accuracy of 99.74%. ROC analysis confirmed the accuracy of the
models. These findings align with a previous study reporting that
ML methods achieved an average identification accuracy of 90.73%
for 12 common pathogenic bacteria and a 99.92% accuracy in
distinguishing between antibiotic-sensitive and -resistant strains
of Acinetobacter baumannii (52).
Compared with MALDI-TOF MS, SERS represents a
high-efficiency technique for identifying Mycobacterium
species and subspecies. SERS uses purified genomic DNA, reducing
the risk of sample contamination. Conversely, background noise from
proteins in the culture media can present a challenge with
MALDI-TOF MS. In addition, SERS utilizes a machine small enough to
be developed into a portable POCT device, allowing for faster and
more cost-effective processing; MALDI-TOF MS requires a larger
processing area and is more expensive. SERS may therefore be
preferable in clinics or areas with limited resources, making it a
more practical tool in treatment settings.
In addition to SERS-based detection in mycobacterial
studies, Perumal et al (53)
and our work both emphasize the development of SERS-based models
for Mycobacterium detection. Perumal et al (53)
established successfully SERS spectra to characterize three major
mycolic acid (MA) forms (α-MA, methoxy-MA and keto-MA) of MTB
combining PCA and functional PCA for dimensionality reduction and
LR, as well as LDA. By contrast, our study used genomic DNA to
discriminate species (NTM vs. MTB-H37Ra) and NTM subspecies (MAB
vs. MMAS). Here, we employed both supervised methods (LDA) and
unsupervised methods (PCA and UMAP) for spectral clustering,
alongside advanced ML algorithms (XGB, LR and RF) with LOOCV, which
is likely to yield more rigorous insights and higher resolution.
Collectively, these complementary approaches advance SERS-based
technology toward comprehensive mycobacterial diagnostics.
Although these findings are promising for bacterial
differentiation, it is crucial to address the limitations of the
present study. The portable Raman spectrometer, while excellent for
POCT, simpler, faster and more compact, has a lower resolution and
sensitivity than benchtop systems, restricting its use to
preliminary screening; parallel validation with conventional Raman
is recommended. However, prior studies have reported that portable
RS devices are sufficiently effective for medical and environmental
biomolecule measurement (54-56).
There is also the issue of the long-term stability of SERS chips as
prolonged storage may alter surface and plasmonic activity,
affecting signal reproducibility. In the present study, all SERS
chips were vacuum-sealed during storage and used within 30 days of
opening per the manufacturer protocol in a single experimental
session.
Finally, the limited biological sample size,
although partially mitigated by performing technical triplicates
(75 spectra per sample), constrains the generalizability and
predictive accuracy of the developed model. The current dataset,
while providing initial insights, risks bias and overfitting due to
the small, imbalanced distribution of isolates (such as 10 NTM vs.
a single strain of MTB-H37Ra). However, reproducibility assessments
of SERS spectra, and Pearson's and Spearman's correlation analysis
were displayed as Fig. S1 and
Table SIII. Expanding the sample
size may improve the model and enhance the predictive power for
reliable differentiation.
In conclusion, the present study represented a
proof-of-concept study: Novel competence SERS models were
successfully established using technology to differentiate
Mycobacterium at the species and subspecies levels. The
present study used a portable RS device which could be developed as
a promising POCT in the future. SERS analysis combined with ML was
effectively employed to characterize MAB and MMAS genomic DNA,
establishing a valuable Raman spectral database for M.
abscessus subspecies classification, as well as differentiating
these from MTB-H37Ra. Detection was based on genomic DNA, a stable
sample source for long-term storage, and was possible at very low
concentrations (15 ng/µl). ML models, particularly XGB, achieved
high classification accuracies of 96.25% (94.71% sensitivity,
97.91% specificity, and an AUC of 99%) for distinguishing between
MAB and MMAS, with LR exceeding 99.74% accuracy (99.86%
sensitivity, 98.46% specificity, and an AUC of 100%) for
differentiating NTM from MTB-H37Ra. These findings demonstrated the
potential utility of SERS in genomic-level infectious disease
diagnosis.
Supplementary Material
Reproducibility of SERS spectra across
different genomic DNA concentrations. The dot plots illustrate the
coefficient of determination (R2) values obtained from
genomic DNA at concentrations of (A) 15 ng/μl and (B) 50
ng/μl. The y-axis indicates the R2 values,
reflecting the degree of the correlation and consistency between
replicates. The x-axis denotes the specific bacterial isolate
tested: MAB, MMAS, and MTB-H37Ra. Numbers (1, 2 and 3) under each
isolate represent independent technical replicates. The high
R2 values (mostly >0.8) observed across both
concentrations and all strains demonstrate the high precision and
reliability of the method. SERS, surface-enhanced Raman
spectroscopy; MAB, M. abscessus subspecies
abscessus; MMAS, M. abscessus subspecies
massiliense; MTB-H37Ra/H37Ra, M. tuberculosis
H37Ra.
Accession numbers of
Mycobacterium species and subspecies used.
Specific DNA-related Raman shifts and
their corresponding peak assignments.
Reproducibility assessment of SERS
spectra via Pearson’s and Spearman’s correlation analysis.
Acknowledgements
Not applicable.
Funding
Funding: The present study was supported by a research grant for
supporting lecturer to admit high potential student to study and
research on his expert program year 2022 (grant no. 651JH114),
joint funding of Graduate school and Faculty of Medicine, Khon Kaen
University and the Invitation Research Funding (grant no. IN
67080), Faculty of Medicine, Khon Kaen University. Khon Kaen,
Thailand.
Availability of data and materials
The data generated in the present study may be
requested from the corresponding author.
Authors' contributions
AP was responsible for conceptualization, review,
sample administration, data curation, data analysis and writing the
original draft. TDT, PK and CJ were responsible for sample
administration and data curation. JE was responsible for data
analysis and software consultancy. AP, TDT and JE confirm the
authenticity of all the raw data. BK, CP, WN, KS and SC were
responsible for conceptualization, review and editing. KF was
responsible for conceptualization, funding, review and editing. WP
was responsible for conceptualization, funding, data analysis,
editing, finalized manuscript and corresponding. All authors read
and approved the final manuscript.
Ethics approval and consent to
participate
The present study was approved by the Khon Kaen
University Ethics Committee for Human Research in accordance with
the 1964 Declaration of Helsinki (approval no. HE 591454). Leftover
clinical specimens were provided for the completion of the present
study.
Patient consent for publication
Not applicable.
Competing interests
The authors declare that they have no competing
interests.
References
|
1
|
Guevara E, Torres-Galván JC, Ramírez-Elías
MG, Luevano-Contreras C and González FJ: Use of Raman spectroscopy
to screen diabetes mellitus with machine learning tools. Biomed Opt
Express. 9:4998–5010. 2018.PubMed/NCBI View Article : Google Scholar
|
|
2
|
Khan S, Ullah R, Shahzad S, Anbreen N,
Bilal M and Khan A: Analysis of tuberculosis disease through Raman
spectroscopy and machine learning. Photodiagnosis Photodyn Ther.
24:286–291. 2018.PubMed/NCBI View Article : Google Scholar
|
|
3
|
Ravanshad R, Karimi Zadeh A, Amani AM,
Mousavi SM, Hashemi SA, Savar Dashtaki A, Mirzaei E and Zare B:
Application of nanoparticles in cancer detection by Raman
scattering based techniques. Nano Rev Exp.
9(1373551)2017.PubMed/NCBI View Article : Google Scholar
|
|
4
|
Zhang C, Winnard PT Jr, Dasari S, Kominsky
SL, Doucet M, Jayaraman S, Raman V and Barman I: Label-free Raman
spectroscopy provides early determination and precise localization
of breast cancer-colonized bone alterations. Chem Sci. 9:743–753.
2017.PubMed/NCBI View Article : Google Scholar
|
|
5
|
Li Z, Li Z, Chen Q, Zhang J, Dunham ME,
McWhorter AJ, Feng JM, Li Y, Yao S and Xu J:
Machine-learning-assisted spontaneous Raman spectroscopy
classification and feature extraction for the diagnosis of human
laryngeal cancer. Comput Biol Med. 146(105617)2022.PubMed/NCBI View Article : Google Scholar
|
|
6
|
Wu UI and Holland SM: Host susceptibility
to non-tuberculous mycobacterial infections. Lancet Infect Dis.
15:968–980. 2015.PubMed/NCBI View Article : Google Scholar
|
|
7
|
Cassidy PM, Hedberg K, Saulson A, McNelly
E and Winthrop KL: Nontuberculous mycobacterial disease prevalence
and risk factors: A changing epidemiology. Clin Infect Dis.
49:e124–e129. 2009.PubMed/NCBI View
Article : Google Scholar
|
|
8
|
Ide S, Nakamura S, Yamamoto Y, Kohno Y,
Fukuda Y, Ikeda H, Sasaki E, Yanagihara K, Higashiyama Y,
Hashiguchi K, et al: Epidemiology and clinical features of
pulmonary nontuberculous mycobacteriosis in Nagasaki, Japan. PLoS
One. 10(e0128304)2015.PubMed/NCBI View Article : Google Scholar
|
|
9
|
Shah SK, McAnally KJ, Seoane L, Lombard
GA, LaPlace SG, Lick S, Dhillon GS and Valentine VG: Analysis of
pulmonary non-tuberculous mycobacterial infections after lung
transplantation. Transpl Infect Dis. 18:585–591. 2016.PubMed/NCBI View Article : Google Scholar
|
|
10
|
Lee MR, Yang CY, Shu CC, Lin CK, Wen YF,
Lee SW, Ko JC, Wang JY, Lee LN and Yu CJ: Factors associated with
subsequent nontuberculous mycobacterial lung disease in patients
with a single sputum isolate on initial examination. Clin Microbiol
Infect. 21:250.e1–e7. 2015.PubMed/NCBI View Article : Google Scholar
|
|
11
|
Jeong J, Kim SR, Chang CL and Lee SH:
Identification of mycobacteria species by HPLC and species
distribution during five years at Ulsan university hospital. Korean
J Lab Med. 28:24–33. 2008.PubMed/NCBI View Article : Google Scholar : (In Korean).
|
|
12
|
Kehrmann J, Kurt N, Rueger K, Bange FC and
Buer J: GenoType NTM-DR for identifying Mycobacterium
abscessus subspecies and determining molecular resistance. J
Clin Microbiol. 54:1653–1655. 2016.PubMed/NCBI View Article : Google Scholar
|
|
13
|
Kham-Ngam I, Chetchotisakd P, Ananta P,
Chaimanee P, Reechaipichitkul W, Lulitanond V, Namwat W and Faksri
K: Differentiation between persistent infection/colonization and
re-infection/re-colonization of Mycobacterium abscessus
isolated from patients in Northeast Thailand. Infect Genet Evol.
68:35–42. 2019.PubMed/NCBI View Article : Google Scholar
|
|
14
|
Kwon YS and Koh WJ: Diagnosis of pulmonary
tuberculosis and nontuberculous mycobacterial lung disease in
Korea. Tuberc Respir Dis. 77:1–5. 2014.PubMed/NCBI View Article : Google Scholar
|
|
15
|
Pfyffer GE: Mycobacterium: General
characteristics, laboratory detection, and staining procedures. In
Manual of Clinical Microbiology. Jorgensen JH, Carroll KC, Funke G,
Pfaller MA, Landry ML, Richter SS, Warnock DW, Carroll KC, Bernard
KA, Dumler JS, et al (eds). John Wiley & Sons, Ltd.,
pp536-569, 2015.
|
|
16
|
Dingle TC and Butler-Wu SM: Maldi-tof mass
spectrometry for microorganism identification. Clin Lab Med.
33:589–609. 2013.PubMed/NCBI View Article : Google Scholar
|
|
17
|
Nithimongkolchai N, Hinwan Y, Kaewseekhao
B, Chareonsudjai P, Reungsang P, Kraiklang R, Chareonsudjai S,
Wonglakorn L, Chetchotisakd P, Sirichoat A, et al: MALDI-TOF MS
analysis of Burkholderia pseudomallei and closely related species
isolated from soils and water in Khon Kaen, Thailand. Infect Genet
Evol. 116(105532)2023.PubMed/NCBI View Article : Google Scholar
|
|
18
|
Griffith DE, Aksamit T, Brown-Elliott BA,
Catanzaro A, Daley C, Gordin F, Holland SM, Horsburgh R, Huitt G,
Iademarco MF, et al: An official ATS/IDSA statement: diagnosis,
treatment, and prevention of nontuberculous mycobacterial diseases.
Am J Respir Crit Care Med. 175:367–416. 2007.PubMed/NCBI View Article : Google Scholar
|
|
19
|
Kaewprasert O, Nonghanphithak D,
Chetchotisakd P, Namwat W, Ong RTH and Faksri K: Whole-genome
sequencing and drug-susceptibility analysis of serial
Mycobacterium abscessus isolates from Thai patients. Biology
(Basel). 11(1319)2022.PubMed/NCBI View Article : Google Scholar
|
|
20
|
Esposito A, Bonifacio A, Sergo V and
Fornasaro S: Label-free surface enhanced Raman scattering (SERS) on
centrifugal silver plasmonic paper (CSPP): A novel methodology for
unprocessed biofluids sampling and analysis. Biosensors (Basel).
11(467)2021.PubMed/NCBI View Article : Google Scholar
|
|
21
|
Changsen C, Franzblau SG and
Palittapongarnpim P: Improved green fluorescent protein reporter
gene-based microplate screening for antituberculosis compounds by
utilizing an acetamidase promoter. Antimicrob Agents Chemother.
47:3682–3687. 2003.PubMed/NCBI View Article : Google Scholar
|
|
22
|
Zheng H, Lu L, Wang B, Pu S, Zhang X, Zhu
G, Shi W, Zhang L, Wang H, Wang S, et al: Genetic basis of
virulence attenuation revealed by comparative genomic analysis of
Mycobacterium tuberculosis strain H37Ra versus H37Rv. PLoS
One. 3(e2375)2008.PubMed/NCBI View Article : Google Scholar
|
|
23
|
De Almeida IN, Da Silva Carvalho W,
Rossetti ML, Costa ER and De Miranda SS: Evaluation of six
different DNA extraction methods for detection of
Mycobacterium tuberculosis by means of PCR-IS6110:
Preliminary study. BMC Res Notes. 6(561)2013.PubMed/NCBI View Article : Google Scholar
|
|
24
|
Botta R, Chindaudom P, Eiamchai P,
Horprathum M, Limwichean S, Chananonnawathorn C, Patthanasettakul
V, Kaewseekhao B, Faksri K and Nuntawong N: Tuberculosis
determination using SERS and chemometric methods. Tuberculosis
(Edinb). 108:195–200. 2018.PubMed/NCBI View Article : Google Scholar
|
|
25
|
Alunni Cardinali M, Casagrande Pierantoni
D, Caponi S, Corte L, Fioretto D and Cardinali G: Meso-Raman
approach for rapid yeast cells identification. Biophys Chem.
254(106249)2019.PubMed/NCBI View Article : Google Scholar
|
|
26
|
Boiko VV, Romanyuk VR, Gnatyuk OP,
Ilchenko OO, Karakhim SO, Korovin AV and Dovbeshko GI: Vibrational
spectra of DNA in the confined interglobular volume of photonic
crystal. J Biol Phys. 44:101–116. 2018.PubMed/NCBI View Article : Google Scholar
|
|
27
|
Prescott B, Steinmetz W and Thomas GJ Jr:
Characterization of DNA structures by laser Raman spectroscopy.
Biopolymers. 23:235–256. 1984.PubMed/NCBI View Article : Google Scholar
|
|
28
|
Serban D, Benevides JM and Thomas GJ Jr:
DNA secondary structure and Raman markers of supercoiling in
Escherichia coli plasmid pUC19. Biochemistry. 41:847–853.
2002.PubMed/NCBI View Article : Google Scholar
|
|
29
|
Neugebauer U, Clement JH, Bocklitz T,
Krafft C and Popp J: Identification and differentiation of single
cells from peripheral blood by Raman spectroscopic imaging. J
Biophotonics. 3:579–587. 2010.PubMed/NCBI View Article : Google Scholar
|
|
30
|
Matthews Q, Jirasek A, Lum J, Duan X and
Brolo AG: Variability in Raman spectra of single human tumor cells
cultured in vitro: Correlation with cell cycle and culture
confluency. Appl Spectrosc. 64:871–887. 2010.PubMed/NCBI View Article : Google Scholar
|
|
31
|
Kim J, Park HJ, Kim JH, Chang B and Park
HK: Label-free detection for a DNA methylation assay using Raman
spectroscopy. Chin Med J (Engl). 130:1961–1967. 2017.PubMed/NCBI View Article : Google Scholar
|
|
32
|
Zangana S, Veres M and Bonyár A:
Surface-enhanced raman spectroscopy (SERS)-Based sensors for
deoxyribonucleic acid (DNA) detection. Molecules.
29(3338)2024.PubMed/NCBI View Article : Google Scholar
|
|
33
|
Maquelin K, Choo-Smith LP, Endtz HP,
Bruining HA and Puppels GJ: Rapid identification of Candida species
by confocal Raman microspectroscopy. J Clin Microbiol. 40:594–600.
2002.PubMed/NCBI View Article : Google Scholar
|
|
34
|
Movasaghi Z, Rehman S and Rehman IU: Raman
spectroscopy of biological tissues. Appl Spectrosc Rev. 42:493–541.
2007.
|
|
35
|
Kendall C, Hutchings J, Barr H, Shepherd N
and Stone N: Exploiting the diagnostic potential of biomolecular
fingerprinting with vibrational spectroscopy. Faraday Discuss.
149:279–290, 333-356. 2011.PubMed/NCBI View Article : Google Scholar
|
|
36
|
Liu Z, Davis C, Cai W, He L, Chen X and
Dai H: Circulation and long-term fate of functionalized,
biocompatible single-walled carbon nanotubes in mice probed by
Raman spectroscopy. Proc Natl Acad Sci USA. 105:1410–1415.
2008.PubMed/NCBI View Article : Google Scholar
|
|
37
|
Huang H, Shi H, Feng S, Chen W, Yu Y, Lin
D and Chen R: Confocal Raman spectroscopic analysis of the
cytotoxic response to cisplatin in nasopharyngeal carcinoma cells.
Anal Methods. 5:260–266. 2013.
|
|
38
|
Pedregosa F, Varoquaux G, Gramfort A,
Michel V, Thirion B, Grisel O, Blondel M, Prettenhofer P, Weiss R,
Dubourg V, et al: Scikit-learn: Machine learning in python. J Mach
Learn Res. 12:2825–2830. 2011.
|
|
39
|
Feng X, Fox MC, Reichenberg JS, Lopes
FCPS, Sebastian KR, Dunn AK, Markey MK and Tunnell JW: Superpixel
Raman spectroscopy for rapid skin cancer margin assessment. J
Biophotonics. 13(e201960109)2020.PubMed/NCBI View Article : Google Scholar
|
|
40
|
Traynor D, Duraipandian S, Bhatia R,
Cuschieri K, Martin CM, O'Leary JJ and Lyng FM: The potential of
biobanked liquid based cytology samples for cervical cancer
screening using Raman spectroscopy. J Biophotonics.
12(e201800377)2019.PubMed/NCBI View Article : Google Scholar
|
|
41
|
Naseer K, Amin A, Saleem M and Qazi J:
Raman spectroscopy based differentiation of typhoid and dengue
fever in infected human sera. Spectrochim Acta A Mol Biomol
Spectrosc. 206:197–201. 2019.PubMed/NCBI View Article : Google Scholar
|
|
42
|
Sathyavathi R, Dingari NC, Barman I,
Prasad PSR, Prabhakar S, Narayana Rao D, Dasari RR and Undamatla J:
Raman spectroscopy provides a powerful, rapid diagnostic tool for
the detection of tuberculous meningitis in ex vivo cerebrospinal
fluid samples. J Biophotonics. 6:567–672. 2013.PubMed/NCBI View Article : Google Scholar
|
|
43
|
Rodriguez L, Zhang Z and Wang D: Recent
advances of Raman spectroscopy for the analysis of bacteria. Anal
Sci Adv. 4:81–95. 2023.PubMed/NCBI View Article : Google Scholar
|
|
44
|
Fangous MS, Mougari F, Gouriou S, Calvez
E, Raskine L, Cambau E, Payan C and Héry-Arnaud G: Classification
algorithm for subspecies identification within the Mycobacterium
abscessus species, based on matrix-assisted laser desorption
ionization-time of flight mass spectrometry. J Clin Microbiol.
52:3362–3369. 2014.PubMed/NCBI View Article : Google Scholar
|
|
45
|
Panagea T, Pincus DH, Grogono D, Jones M,
Bryant J, Parkhill J, Floto RA and Gilligan P: Mycobacterium
abscessus complex identification with matrix-assisted laser
desorption ionization-time of flight mass spectrometry. J Clin
Microbiol. 53:2355–2358. 2015.PubMed/NCBI View Article : Google Scholar
|
|
46
|
Takei S, Teramoto K, Sekiguchi Y, Ihara H,
Tohya M, Iwamoto S, Tanaka K, Khasawneh A, Horiuchi Y, Misawa S, et
al: Identification of Mycobacterium abscessus using the
peaks of ribosomal protein L29, L30 and hemophore-related protein
by MALDI-MS proteotyping. Sci Rep. 14(11187)2024.PubMed/NCBI View Article : Google Scholar
|
|
47
|
Wang Y, Zhang Z, Sun Y, Wu H, Luo L and
Song Y: Recent advances in surface-enhanced raman scattering for
pathogenic bacteria detection: A review. Sensors (Basel).
25(1370)2025.PubMed/NCBI View Article : Google Scholar
|
|
48
|
Van Lierop D, Faulds K and Graham D:
Separation free DNA detection using surface enhanced Raman
scattering. Anal Chem. 83:5817–5821. 2011.PubMed/NCBI View Article : Google Scholar
|
|
49
|
Movileanu L, Benevides JM and Thomas GJ
Jr: Temperature dependence of the Raman spectrum of DNA. II. Raman
signatures of premelting and melting transitions of
poly(dA).poly(dT) and comparison with poly(dA-dT).poly(dA-dT).
Biopolymers. 63:181–194. 2002.PubMed/NCBI View Article : Google Scholar
|
|
50
|
Benevides JM, Li T, Lu XJ, Srinivasan AR,
Olson WK, Weiss MA and Thomas GJ Jr: Protein-directed DNA structure
II. Raman spectroscopy of a leucine zipper bZIP complex.
Biochemistry. 39:548–556. 2000.PubMed/NCBI View Article : Google Scholar
|
|
51
|
Christens-Barry WA, Martin JC and Lebowitz
J: Raman spectroscopy of supercoiled and nicked ColE1 plasmid.
Biopolymers. 28:1515–1526. 1989.PubMed/NCBI View Article : Google Scholar
|
|
52
|
Lu W, Li H, Qiu H, Wang L, Feng J and Fu
YV: Identification of pathogens and detection of antibiotic
susceptibility at single-cell resolution by Raman spectroscopy
combined with machine learning. Front Microbiol.
13(1076965)2023.PubMed/NCBI View Article : Google Scholar
|
|
53
|
Perumal J, Dinish U, Bendt AK,
Kazakeviciute A, Fu CY, Ong ILH and Olivo M: Identification of
mycolic acid forms using surface-enhanced Raman scattering as a
fast detection method for tuberculosis. Int J Nanomedicine.
13:6029–6038. 2018.PubMed/NCBI View Article : Google Scholar
|
|
54
|
Khongkaew P, Cruz J, Bertotto JP, Cárdenas
V, Alcalà M, Nuchtavorn N and Phechkrajang C: A comparative study
of benchtop and portable NIR and Raman spectroscopic methods for
the quantitative determination of curcuminoids in turmeric powder.
Foods. 11(2187)2022.PubMed/NCBI View Article : Google Scholar
|
|
55
|
Hernández-Jiménez M, Revilla I,
Vivar-Quintana AM, Grabska J, Beć KB and Huck CW: Performance of
benchtop and portable spectroscopy equipment for discriminating
Iberian ham according to breed. Curr Res Food Sci.
8(100675)2024.PubMed/NCBI View Article : Google Scholar
|
|
56
|
Brawley HN, Juárez ID, Kurouski D, Zwart
SR and Smith SM: Feasibility of portable Raman SERS for blood
biomarker monitoring in spaceflight conditions. Life Sci Space Res
(Amst). 48:216–224. 2026.PubMed/NCBI View Article : Google Scholar
|