Introduction
Although a refined assessment of hormone receptors
in breast carcinoma is necessary to select therapeutic agents,
endocrine responsiveness has recently been defined as the presence
of any detectable estrogen receptor (ER) according to the
recommendations and thresholds for the post-operative adjuvant
systemic therapy of early breast cancer proposed by the St. Gallen
International Expert Consensus meeting in 2009 (1). In other words, the previous three
categories of endocrine responsiveness using 1 and 10% cut-off
values have been simplified, so that endocrine therapy is
considered when any ER-positive cells are noted in the tumor. For
the evaluation of hormone receptor (HR) status, it is recommended
that the percentage of HR-positive cells be indicated on pathology
reports rather than merely using scores. In particular, positivity
for HRs of 50% or more of tumor cells is viewed as indicating
highly endocrine-responsive tumors, suggesting that the HR must be
reliably and accurately measured.
As to the immunohistochemistry (IHC) methods for the
detection and quantification of the ER and progesterone receptor
(PgR), the authors compared evaluations for HRs in breast carcinoma
using two manual and three automated IHC assays, and showed
intermethod variability indicated by multi-rater κ-values for the
ER and PgR (ER, κ=0.34; PgR, κ=0.45) (2). In addition, to assess low levels of
HR expression, the HR was evaluated by real-time monitoring
polymerase chain reaction (RT-PCR) using complementary DNA produced
by reverse transcription of the messenger RNA of each breast
carcinoma. Although we showed an excellent correlation between
RT-PCR results and those of the IHC method, there were some
discrepancies between the results of RT-PCR and IHC due to the
overestimation of HR-positive lymphocytes and mesenchymal cells in
tumor stroma, among other factors (3).
To provide a standardized semi-quantitative
measurement of the HR for IHC specimens, computerized image
analysis has been employed since the late 1980s (4). These attempts were performed using
various systems or software, including Cell Analysis System's CAS
100 (4), BIOCOM500 (5), CAS 200 (6), Image cytometry (7), Adobe Photoshop (8,9),
computer-supported analysis (10),
SpectraCube™ (11), Chroma Vision
Automated Cellular Imaging System (ACIS) (12–14),
WinROOF (15), QCA (16) and VISUAL C++ (17). In particular, automated image
analysis technology, including AQUA (18), Ariol (14,19)
and MatLab7 using digital image capturing (20), has recently been developed.
Although it is emphasized that computerized image analysis has
improved quantification, reproducibility and interobserver
variability for the HR evaluation of breast carcinoma (4–20),
the process of image analysis is known to be more time consuming
and labor intensive than assessment by the human eye.
In Japan, there are three automated IHC methods
approved by the Japanese Ministry of Health, Labor and Welfare to
assess HR status in order to determine the suitability of endocrine
treatment: automated IHC staining by Dako (Dako Corp., Glostrup,
Denmark), BioGenex Corp. (San Ramon, CA, USA) and Ventana Medical
Systems (Tucson, AZ, USA), each of which uses a different method
for retrieving antigens and different types of antibodies or
detection reagents. To date, no studies have directly compared
these IHC computerized image analysis methods.
The aim of the present study was to assess the
intermethod variability of these three IHC assays using image
analysis. An additional aim was to find an optimal condition for
image analysis that may be proposed as a reliable assay for ER
determination.
Materials and methods
Samples
Fifty consecutive cases of invasive ductal carcinoma
of the breast that had been surgically resected in 2004 and 2005
were selected from the files of the Department of Anatomical
Pathology, Hiroshima University Hospital. H&E-stained slides of
each case were reviewed, and the presence of invasive carcinoma and
adjacent non-neoplastic breast tissue was confirmed in all cases.
The histological type of each tumor was invasive ductal carcinoma,
not otherwise specified.
IHC assay for ER
From formalin-fixed, paraffin-embedded tissues, five
4-μm sections were serially cut and mounted on pre-coated
slides. IHC assays were carried out as described in previous
reports (2,3).
For IHC by the BioGenex system using an automated
i6000 immunostainer (BioGenex Corp.), anti-ER mouse monoclonal
antibody (mAb), ER88 (BioGenex Corp.) was used. Immunoperoxidase
staining was performed according to the manufacturer's instructions
(BioGenex Corp.).
For IHC by the Dako system using the Dako
Autostainer™, anti-ER mAb, 1D5 (Dako Corp.) was used.
Immunoperoxidase staining was performed according to the
manufacturer's instructions (Dako Corp.).
For IHC by the Ventana system using the Ventana HX
System BenchMark™ (Ventana Medical Systems), anti-ER mAb, 6F11
(Ventana Medical Systems) was used. All procedures were performed
automatically in BenchMark™. Immunoperoxidase staining was
performed according to the manufacturer's instructions (Ventana
Medical Systems). Diaminobenzidine (DAB) was used as a chromogen
substrate in all specimens. The sections were counterstained with
hematoxylin.
Scoring system for human examiners
First, the presence or absence of staining of the
nuclei of non-neoplastic ducts and acini in adjacent tissue was
observed and was used as an internal control. The site for
evaluation was not limited to the invasive area, but incorporated
the entire lesion. Two scoring systems were used to evaluate the
IHC findings, the Allred score (21) and J-score (2,3,22).
The J-score comprises proportional values irrespective of the
intensity of stained nuclei, and the proportion of cells stained in
each specimen was recorded as 0, none; 1, <1%; 2, 1–10%; 3,
≥10%, as advocated and employed as the cut-off points in previous
reports (23,24).
All study specimens were scored by two different
examiners (K.A. and M.O.) masked to the patient
characteristics.
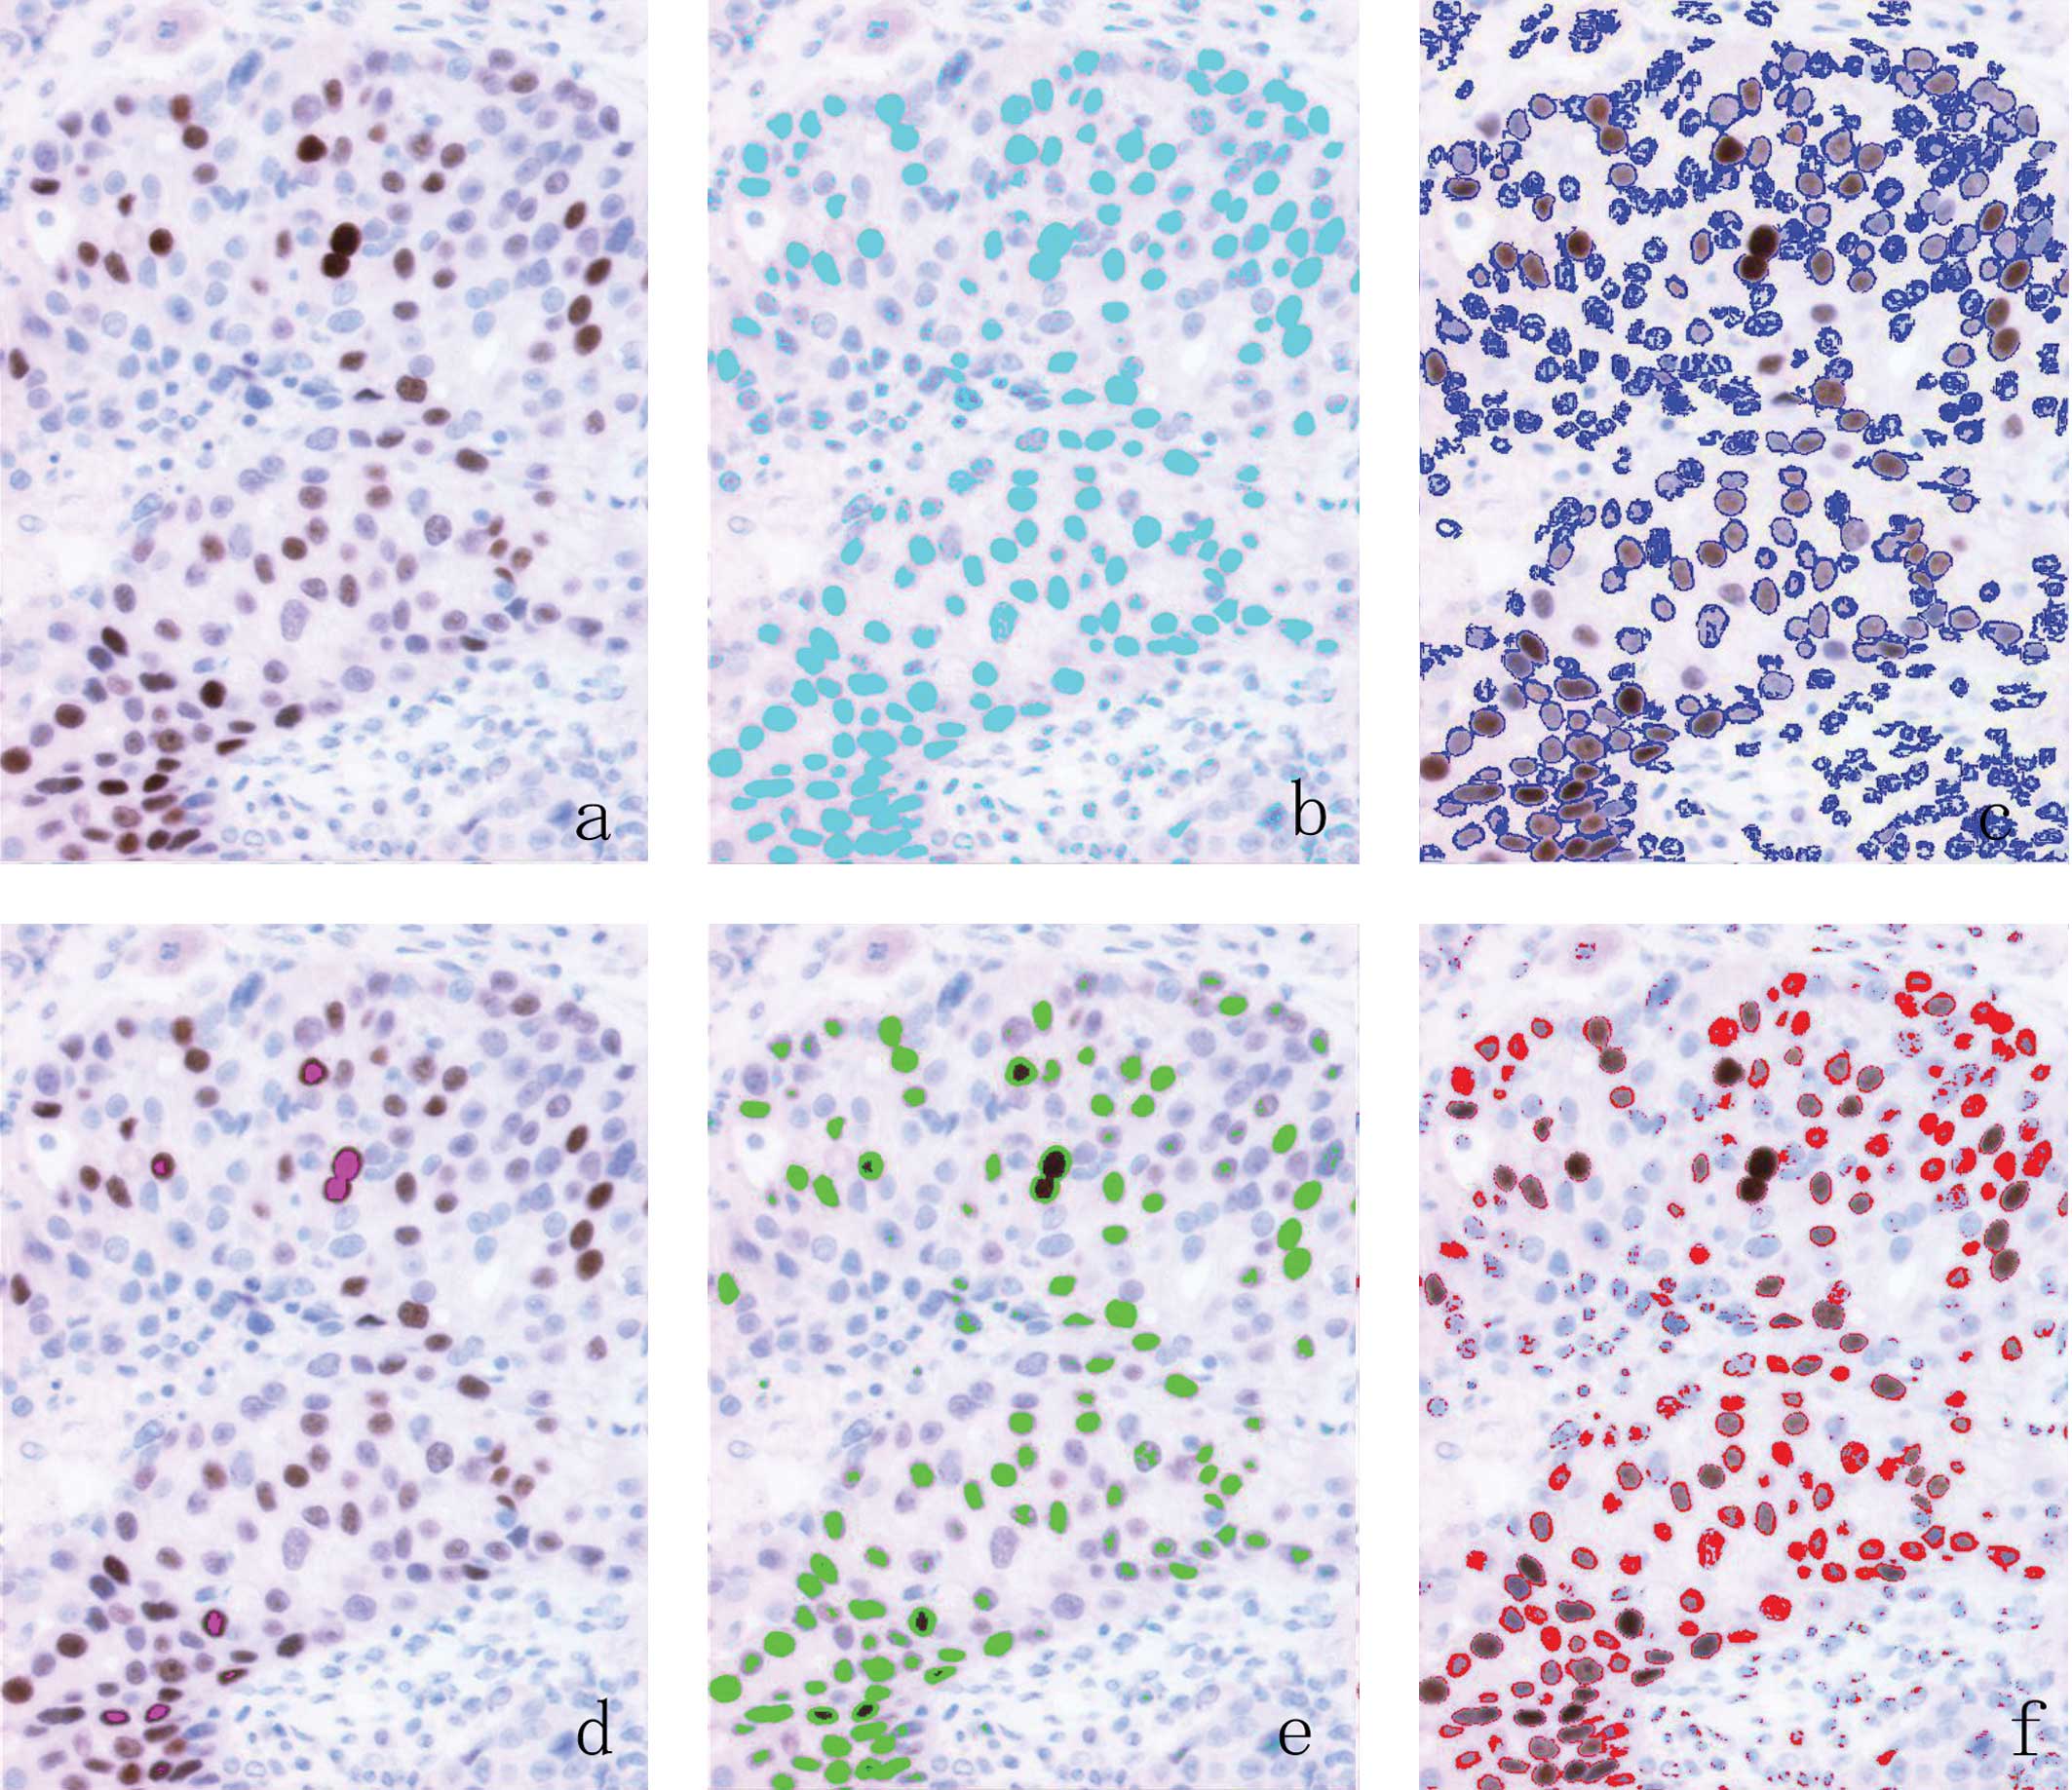
Computer-assisted digital analysis
Ten images were selected by pathologists and
captured from each section at ×200 magnification through a
Hamamatsu C5810 color chilled 3CCD camera (Hamamatsu, Japan). The
captured images were saved as JPEG images on the image analysis
computer. When contamination by normal tissue was present, the
pathologist exchanged it manually for another field, including the
tumor area. The images were analyzed using MacSCOPE version 2.6
(Mitani Corp., Tokyo, Japan) for Macintosh. Despite the area
selection, a certain minimum contamination of the automatic
measurement by host cells is inevitable when stromal and normal
cells are intimately associated with tumor cells. To distinguish
non-carcinoma cell elements from the nonimmunostained carcinoma
cell nuclei on the digitized image, nuclei with small areas (<25
μm2 gross area) and spindle features (>0.5
oval rate) were regarded as lymphocyte nuclei or nucleic debris and
stromal cell nuclei, respectively, and were eliminated. Nuclei that
stained brown or blue were extracted automatically using two
distinct macroinstructions composed chiefly of algorithms for color
extraction based on red-green-blue (RGB) parameters divided into
256 arbitrary units. To create the digitized image-based procedures
for determining ER status, the threshold value of the RGB
parameters of each intensity score (IS) was established as: 0,
negative; 1, weak nuclear staining, faintly perceptible at high
power magnification; 2, intermediate stained nuclei; 3, nuclei
displaying strong staining that had the appearance of an ink dot at
low power magnification, according to the Allred score (Fig. 1).
Scoring system
Two scoring systems were used to evaluate the ER
findings using computer-assisted analysis: the H-score method
(15,25) and the percentage of area of stained
nuclei of carcinoma cells (PP) in 10 images, irrespective of the
intensity of stained nuclei. The H-score was calculated by summing
3x the percentage of total nuclei area showing IS3, 2x the
percentage of total nuclei area showing IS2 and 1x the percentage
of total nuclei area showing IS1, ranging from 0 to 300.
Statistical analysis
The Spearman's rank correlation test was used for
correlation analysis between the H-score and the total score (TS)
of the Allred score and between the PP and J-score.
Results
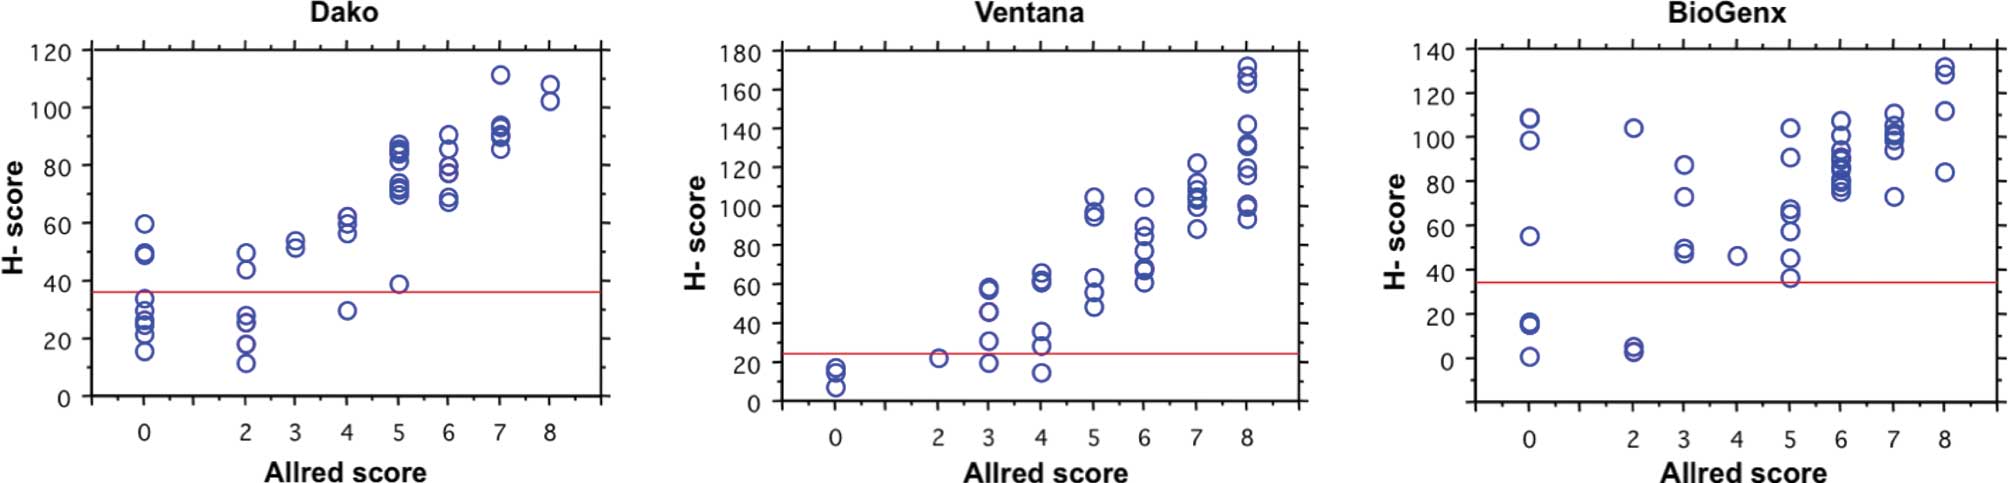
Relationship between Allred score and
H-score for ER
A comparison of the distribution of the TS of Allred
scores determined by the human examiners and that of H-scores
calculated by image-analysis software for ER by the three staining
methods is shown in Fig. 2. The
H-score values for the same group of tumors increased monotonically
as the TS increased, although there was considerable variability
among tumors with the same TS. The Spearman's rank correlation
coefficient between the two methods ranged from 0.572 to 0.889
(P<0.0001). The cut-off values of H-scores for the ER determined
by the Dako, Ventana and BioGenex assays were regarded as 36, 24
and 34 according to the Allred score, respectively. The concordance
rates at these cut-off values were the highest of each IHC assay,
and 88, 98 and 90% among the IHC results generated by the Dako,
Ventana and BioGenex assays, respectively.
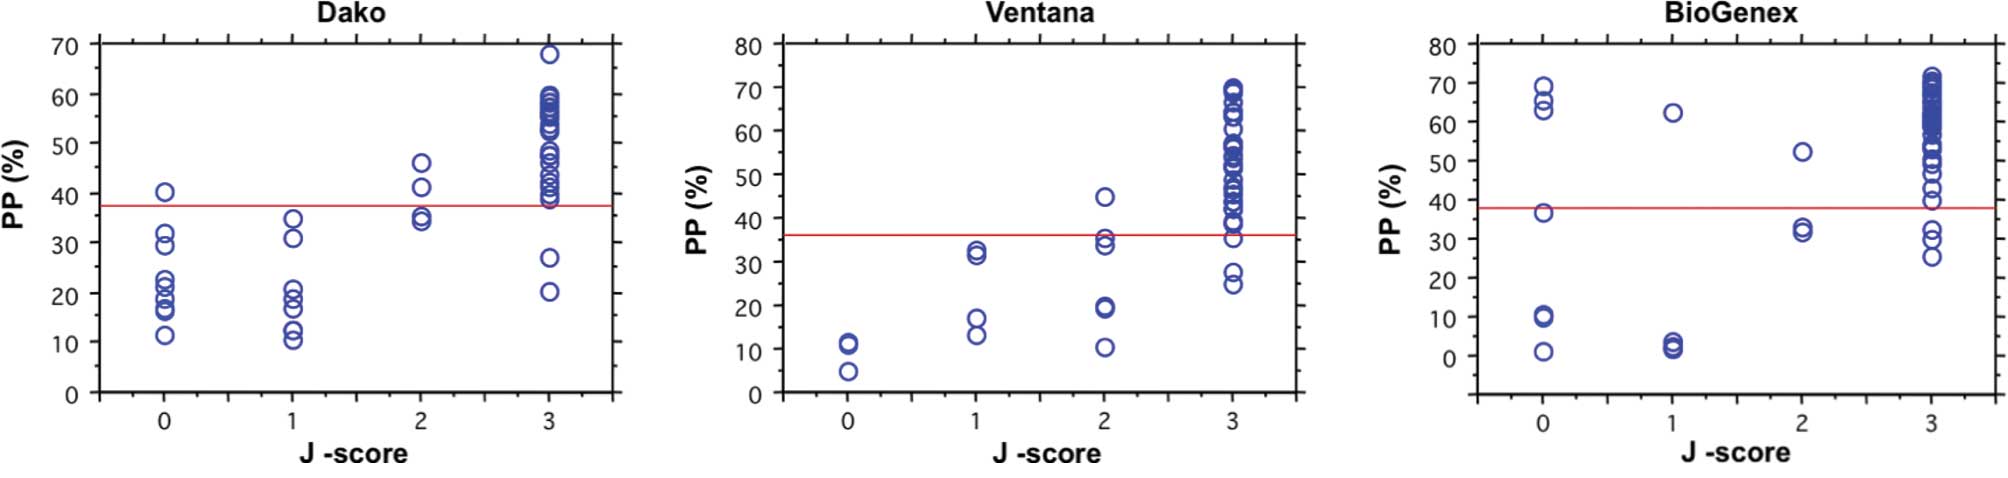
Relationship between J-score and PP for
ER
A comparison of the distribution of J-scores scored
by the human examiners and that of the percentage of positive cells
calculated by image-analyzing software for ER by the three staining
methods is shown in Fig. 3. The
Spearman's rank correlation coefficient between the two methods
ranged from 0.495 to 0.914. The cut-off values of the PP for ER
determined by the Dako, Ventana and BioGenex assays were regarded
as 37, 36 and 38 according to the J-score, respectively. The
concordance rates at these cut-off values were the highest of each
IHC assay, and 90, 92 and 84% among the IHC results generated by
the Dako, Ventana and BioGenex assays, respectively.
Procedures
Approximately 4 min were required to capture 10
images from each specimen and to process these image analyses per
case. The individual results of 50 cases of breast carcinoma in the
present study were transferred to another software program for
calculation.
Discussion
In the present study, quantification of ER using
image-analyzing software was performed and compared to
semi-quantitative assessment by histopathologists. A high degree of
correlation between the two was revealed. Although various studies
concerning computerized image analysis have been conducted
(4–25), it is difficult to compare the
various systems directly, due to the absence of reliable and
universal gold standards.
With regard to a cut-off value for ER evaluation by
computerized image analysis, 10% of positive cells (9,16,20),
the H-score (15) and AQUA scores
calculated by the average signal intensity divided by compartment
area (18) were used in previous
reports. Although in the present study the Allred score determined
by human examiners was compared to the H-score calculated by the
computer and the Allred/H-score conversion table was shown in a
previous report (26), it was
difficult to translate one scoring system to the other system,
precisely since the two systems are not strictly equivalent.
Accordingly, the final assessment of the clinical usefulness of
these various systems, cut-off values and estimation methods is
thought to depend on the correlation with biological behavior and
responsiveness to hormone therapy.
In the present study, there were some discrepancies
between human observation and computerized image analysis for IHC.
For the cases showing negativity on human observation and
positivity on computerized image analysis for ER, the software used
detected ER expression in the lymphocytes and mesenchymal cells.
Since ER expression of infiltrating lymphocytes and mesenchymal
cells in tumor stroma has been reported previously (3,27), a
condition was set to eliminate non-carcinoma cells showing
positivity, although it was not possible to completely eliminate
the ER expression of lymphocytes or mesenchymal cells.
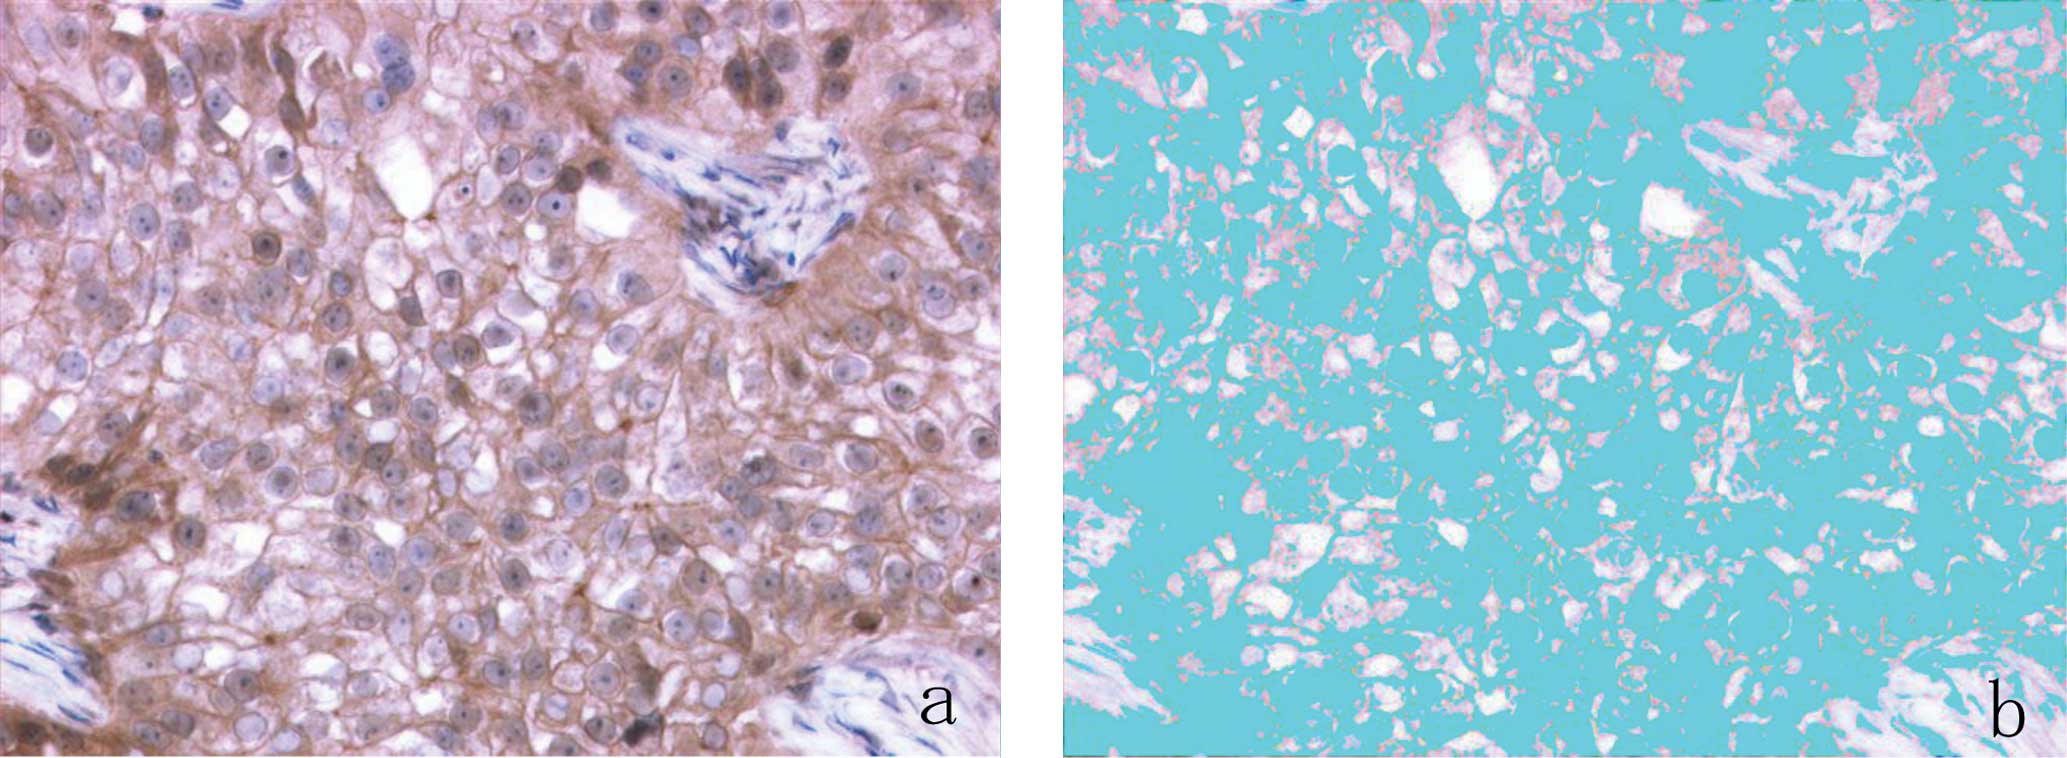
Additionally, in the present study, ER expression in
the cytoplasm or plasma membrane of carcinoma cells was noted in
3.5, 2 and 25% of examined cases using the Dako, Ventana and
BioGenex assays, respectively (Fig.
4). In a previous study, the extranuclear expression of HR in
breast carcinoma cells was reported in 9.5% of examined cases
(28). Accordingly, the software
used in the present study may have overestimated the positivity of
ER in carcinoma cells, as it could not discriminate between ER
expression in the nuclei and that in the cytoplasm or plasma
membrane of carcinoma cells. Accordingly, it is necessary to use
softwave with improved function that derives ER expression only
from the nuclei of carcinoma cells.
Regarding the time required to perform computerized
image analysis, in general, the process of image analysis is more
time consuming and labor intensive than visual scoring from a glass
slide. Although in a previous report the processing time for 100
images from 20 cases by WinROOF was reportedly approximately 60
min, excluding the time required to capture the images (15), there have been few reports
discussing the time necessary to capture and process the images by
software. In the present study, the capture and processing time for
10 images per case was approximately 4 min. In comparison to the
study using WinROOF, the process of image analysis in the present
study was less time consuming and labour intensive due to the
improved function of the computer and software.
With regard to the number of images captured for
digitized analysis, there have been various numbers of images used
ranging from the single best field (16,17),
three fields (8), four fields
(14), five fields (5,15,29),
eight fields (9) and ten fields
(6,10). In the present study, ten fields
were selected and captured for image analysis, similar to previous
studies which used the maximal numbers of images (6,10).
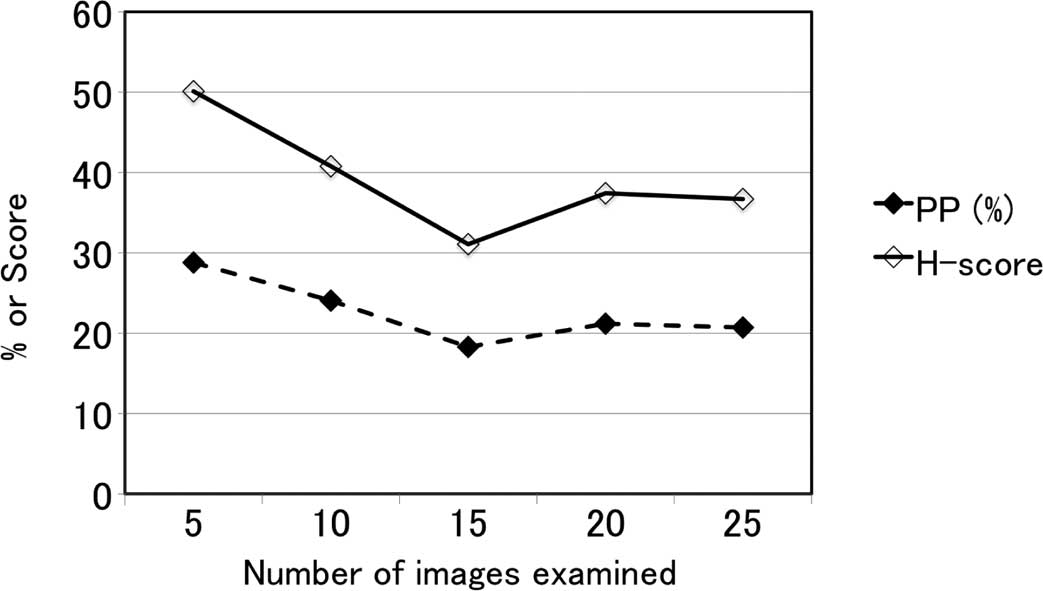
Although twenty fields was regarded as sufficient for digitized
image analysis on the basis of a preliminary study on the
relationship between the number of images digitally analyzed and
H-score or the percentage of stained nuclei area (Fig. 5), the optimal number of images for
digital analysis should be considered, taking into account the time
required for the procedure. Recently, a fully automatic digitized
analyzing system for the total fields of specimens was developed
using digital images captured by the Aperio ScanScope XT Slide
Scanner and algorithm by MatLab 7 (20). This system reportedly identifies
only tumor nuclei and automatically excludes non-tumor structures,
including stromal components and lymphocytes. In particular, it is
entirely unsupervised and does not require any a priori
data. Irrespective of the adjustment of various thresholds and
cut-off values to detect various cells exhibiting particular sizes
and shapes, to date, it has been difficult for a digitized
analyzing system to discriminate between benign and malignant cells
with complete accuracy. Accordingly, advances in the algorithm of
digitized analyzing systems are necessary.
As for image analysis of the RGB system, in general,
a composite color signal is built up from combinations of basic
color values produced by the mosaic arrangement of three color
filters (red, green and blue) on the surface of the imager. In this
way, each color image is recorded as a superimposition of 3 images
with a photometric resolution of 255 linear values: a red, a blue
and a green one, reflecting the slide transmission into these three
types of wavelengths (5). However,
even when an RGB imaging system functions perfectly, there are
intrinsic limitations to its ability to distinguish between similar
chromogens and to isolate the optical signal from each chromogen.
Thus, each color signal is quantitatively and separately measured
(30). In the present study, DAB
was used as a chromogen substrate, and the choice of chromogen and
counterstain is known to affect both the visual and quantitative
results. Accordingly, the appropriate chromogen substrate and
counterstain dye suitable for image analysis must be selected.
References
|
1.
|
Goldhirsch A, Ingle JN, Gelber RD, Coates
AS, Thurlimann B and Senn HJ: Thresholds for therapies: highlights
of the St Gallen International Expert Consensus on the primary
therapy of early breast cancer 2009. Ann Oncol. 20:1319–1329. 2009.
View Article : Google Scholar : PubMed/NCBI
|
|
2.
|
Arihiro K, Umemura S, Kurosumi M, et al:
Comparison of evaluations for hormone receptors in breast carcinoma
using two manual and three automated immunohistochemical assays. Am
J Clin Pathol. 127:356–365. 2007. View Article : Google Scholar
|
|
3.
|
Oda M, Arihiro K, Kataoka T, Osaki A,
Asahara T and Ohdan H: Comparison of immunohistochemical assays and
reverse transcription real-time polymerase chain reaction for
analyzing status of hormone receptors in human breast carcinoma.
Pathol Int. 60:305–315. 2010. View Article : Google Scholar
|
|
4.
|
Bacus S, Flowers JL, Press MF, Bacus JW
and McCarty KS Jr: The evaluation of estrogen receptor in primary
breast carcinoma by computer-assisted image analysis. Am J Clin
Pathol. 90:233–239. 1988.PubMed/NCBI
|
|
5.
|
Rostagno P, Birtwisle I, Ettore F, et al:
Immunohistochemical determination of nuclear antigens by colour
image analysis: application for labelling index, estrogen and
progesterone receptor status in breast cancer. Anal Cell Pathol.
7:275–287. 1994.
|
|
6.
|
Layfield LJ, Saria EA, Conlon DH and Kerns
BJ: Estrogen and progesterone receptor status determined by the
Ventana ES 320 automated immunohistochemical stainer and the CAS
200 image analyzer in 236 early-stage breast carcinomas: prognostic
significance. J Surg Oncol. 61:177–184. 1996. View Article : Google Scholar
|
|
7.
|
Cohen C: Image cytometric analysis in
pathology. Hum Pathol. 27:482–493. 1996. View Article : Google Scholar
|
|
8.
|
Lehr HA, Mankoff DA, Corwin D, Santeusanio
G and Gown AM: Application of photoshop-based image analysis to
quantification of hormone receptor expression in breast cancer. J
Histochem Cytochem. 45:1559–1565. 1997. View Article : Google Scholar : PubMed/NCBI
|
|
9.
|
Bejar J, Sabo E, Misselevich I, Eldar S
and Boss JH: Comparative study of computer-assisted image analysis
and light-microscopically determined estrogen receptor status of
breast carcinomas. Arch Pathol Lab Med. 122:346–352. 1998.
|
|
10.
|
Mofidi R, Walsh R, Ridgway PF, et al:
Objective measurement of breast cancer oestrogen receptor status
through digital image analysis. Eur J Surg Oncol. 29:20–24. 2003.
View Article : Google Scholar : PubMed/NCBI
|
|
11.
|
Rothmann C, Barshack I, Gil A, Goldberg I,
Kopolovic J and Malik Z: Potential use of spectral image analysis
for the quantitative evaluation of estrogen receptors in breast
cancer. Histol Histopathol. 15:1051–1057. 2000.PubMed/NCBI
|
|
12.
|
Vesoulis Z, Rajappannair L, Define L,
Beach J, Schnell B and Myers S: Quantitative image analysis of
estrogen receptors in breast fine needle aspiration biopsies. Anal
Quant Cytol Histol. 26:323–330. 2004.PubMed/NCBI
|
|
13.
|
Fisher ER, Anderson S, Dean S, et al:
Solving the dilemma of the immunohistochemical and other methods
used for scoring estrogen receptor and progesterone receptor in
patients with invasive breast carcinoma. Cancer. 103:164–173. 2005.
View Article : Google Scholar : PubMed/NCBI
|
|
14.
|
Gokhale S, Rosen D, Sneige N, et al:
Assessment of two automated imaging systems in evaluating estrogen
receptor status in breast carcinoma. Appl Immunohistochem Mol
Morphol. 15:451–455. 2007. View Article : Google Scholar : PubMed/NCBI
|
|
15.
|
Hatanaka Y, Hashizume K, Nitta K, Kato T,
Itoh I and Tani Y: Cytometrical image analysis for
immunohistochemical hormone receptor status in breast carcinomas.
Pathol Int. 53:693–699. 2003. View Article : Google Scholar : PubMed/NCBI
|
|
16.
|
Diaz LK, Sahin A and Sneige N:
Interobserver agreement for estrogen receptor immunohistochemical
analysis in breast cancer: a comparison of manual and
computer-assisted scoring methods. Ann Diagn Pathol. 8:23–27. 2004.
View Article : Google Scholar
|
|
17.
|
Sharangpani GM, Joshi AS, Porter K, et al:
Semi-automated imaging system to quantitate estrogen and
progesterone receptor immunoreactivity in human breast cancer. J
Microsc. 226:244–255. 2007. View Article : Google Scholar : PubMed/NCBI
|
|
18.
|
Chung GG, Zerkowski MP, Ghosh S, Camp RL
and Rimm DL: Quantitative analysis of estrogen receptor
heterogeneity in breast cancer. Lab Invest. 87:662–669. 2007.
View Article : Google Scholar : PubMed/NCBI
|
|
19.
|
Turbin DA, Leung S, Cheang MC, et al:
Automated quantitative analysis of estrogen receptor expression in
breast carcinoma does not differ from expert pathologist scoring: a
tissue microarray study of 3,484 cases. Breast Cancer Res Treat.
110:417–426. 2008. View Article : Google Scholar
|
|
20.
|
Rexhepaj E, Brennan DJ, Holloway P, et al:
Novel image analysis approach for quantifying expression of nuclear
proteins assessed by immunohistochemistry: application to
measurement of oestrogen and progesterone receptor levels in breast
cancer. Breast Cancer Res. 10:R892008. View
Article : Google Scholar
|
|
21.
|
Allred DC, Harvey JM, Berardo M and Clark
GM: Prognostic and predictive factors in breast cancer by
immunohistochemical analysis. Mod Pathol. 11:155–168.
1998.PubMed/NCBI
|
|
22.
|
Umemura S, Kurosumi M, Moriya T, et al:
Immunohistochemical evaluation for hormone receptors in breast
cancer: a practically useful evaluation system and handling
protocol. Breast Cancer. 13:232–235. 2006. View Article : Google Scholar : PubMed/NCBI
|
|
23.
|
Goldhirsch A, Glick JH, Gelber RD, Coates
AS, Thurlimann B and Senn HJ: Meeting highlights: international
expert consensus on the primary therapy of early breast cancer
2005. Ann Oncol. 16:1569–1583. 2005. View Article : Google Scholar : PubMed/NCBI
|
|
24.
|
Kaplan PA, Frazier SR, Loy TS, Diaz-Arias
AA, Bradley K and Bickel JT: 1D5 and 6F11: an immunohistochemical
comparison of two monoclonal antibodies for the evaluation of
estrogen receptor status in primary breast carcinoma. Am J Clin
Pathol. 123:276–280. 2005. View Article : Google Scholar
|
|
25.
|
Goulding H, Pinder S, Cannon P, et al: A
new immunohistochemical antibody for the assessment of estrogen
receptor status on routine formalin-fixed tissue samples. Hum
Pathol. 26:291–294. 1995. View Article : Google Scholar : PubMed/NCBI
|
|
26.
|
Shousha S: Oestrogen receptor status of
breast carcinoma: Allred/H score conversion table. Histopathology.
53:346–347. 2008. View Article : Google Scholar : PubMed/NCBI
|
|
27.
|
Sapino A, Cassoni P, Ferrero E, et al:
Estrogen receptor alpha is a novel marker expressed by follicular
dendritic cells in lymph nodes and tumor-associated lymphoid
infiltrates. Am J Pathol. 163:1313–1320. 2003. View Article : Google Scholar
|
|
28.
|
Kim R, Kaneko M, Arihiro K, et al:
Extranuclear expression of hormone receptors in primary breast
cancer. Ann Oncol. 17:1213–1220. 2006. View Article : Google Scholar : PubMed/NCBI
|
|
29.
|
Kostopoulos S, Glotsos D, Cavouras D, et
al: Computer-based association of the texture of expressed estrogen
receptor nuclei with histologic grade using
immunohistochemically-stained breast carcinomas. Anal Quant Cytol
Histol. 31:187–196. 2009.
|
|
30.
|
Taylor CR and Levenson RM: Quantification
of immunohistochemistry – issues concerning methods, utility and
semiquantitative assessment II. Histopathology. 49:411–424.
2006.
|