Introduction
Stroke is a neurological disease which causes
long-term disability and is the third leading cause of death in the
United States. Ischemic stroke (IS) accounts for approximately 85%
of all strokes. The other 9% are caused by intracerebral hemorrhage
and 4–5% by subarachnoid hemorrhage (1,2).
Environmental and genetic factors are related to the pathogenesis
of IS. Several lines of genetic studies have reported the
relationship between IS and single nucleotide polymorphisms (SNPs)
of candidate genes, such as the transforming growth factor β1
(TGFB1), transforming growth factor β receptor II (70/80 kDa)
(TGFBR2) and tumor necrosis factor (TNF) (3–5).
Insulin-like growth factor 1 (somatomedin C) (IGF1)
is similar to insulin in function and plays a crucial role in
mammalian growth and development. The IGF1 level declines during
the normal aging process, and a low IGF1 level correlates with
decreased cognitive abilities (6).
In vitro studies have shown that IGF1 reduces neuronal cell
death in various injury insults (7,8) and
IGF1 has a protective effect in ischemic animal models (9,10).
Several reports have reviewed the roles of IGF1 in stroke severity
and outcome (11,12). They have suggested that IGF levels
may be associated with neurological recovery and functional
outcome, and have also proposed IGF1 as a predictor of stroke
outcome.
In this study, we investigated the association
between IGF1 SNPs and IS in a Korean population. We also
assessed the relationship between IGF1 SNPs and the clinical
phenotypes according to the scores of National Institutes of Health
Stroke Survey (NIHSS) and the Modified Barthel Index (MBI).
Materials and methods
Study population and clinical
phenotypes
IS patients were enrolled among participants
visiting the Departments of Neurosurgery and Physical Medicine and
Rehabilitation, Kyung Hee Medical Center (Seoul, Republic of
Korea). Patients with transient ischemic attack, cerebrovascular
malformation, congenital brain disorders and accidental or
iatrogenic stroke, were excluded. Stroke patients were diagnosed by
computed tomography, magnetic resonance imaging, angiography and
duplex sonography. The control subjects were recruited among
healthy volunteers to examine the general health check-up program.
Patients with neurological diseases, ischemic heart diseases and
other severe diseases, were excluded. All stroke patients were
classified into clinical phenotypes according to the NIHSS and MBI
scores. For the neurological functional level of IS patient, the
severity of 13 neurological symptoms was assessed by the NIHSS
score. For the daily living activity of IS patients, the quality of
10 general life activities was evaluated by the MBI score. This
study was approved by the Ethics Review Committee of the Medical
Research Institute, School of Medicine, Kyung Hee University.
Written informed consent was obtained from all patients. If
patients were incommunicative, it was obtained from a guardian or
close relatives.
SNP selection and genotyping
We searched the coding SNPs (cSNPs) of the
IFG1 gene in the SNP database of the National Center for
Biotechnology Information (http://www.ncbi.nlm.nih.gov/SNP, BUILD 132). The cSNPs
with a heterozygosity of <0.05 and/or a minor allele frequency
(MAF) of <0.05, were excluded. Out of five missense and two
synonymous SNPs, there were no cSNPs with a heterozygosity of
>0.05 or a MAF of >0.05. Therefore, we searched the
untranslational and intron SNPs of the IGF1 gene and
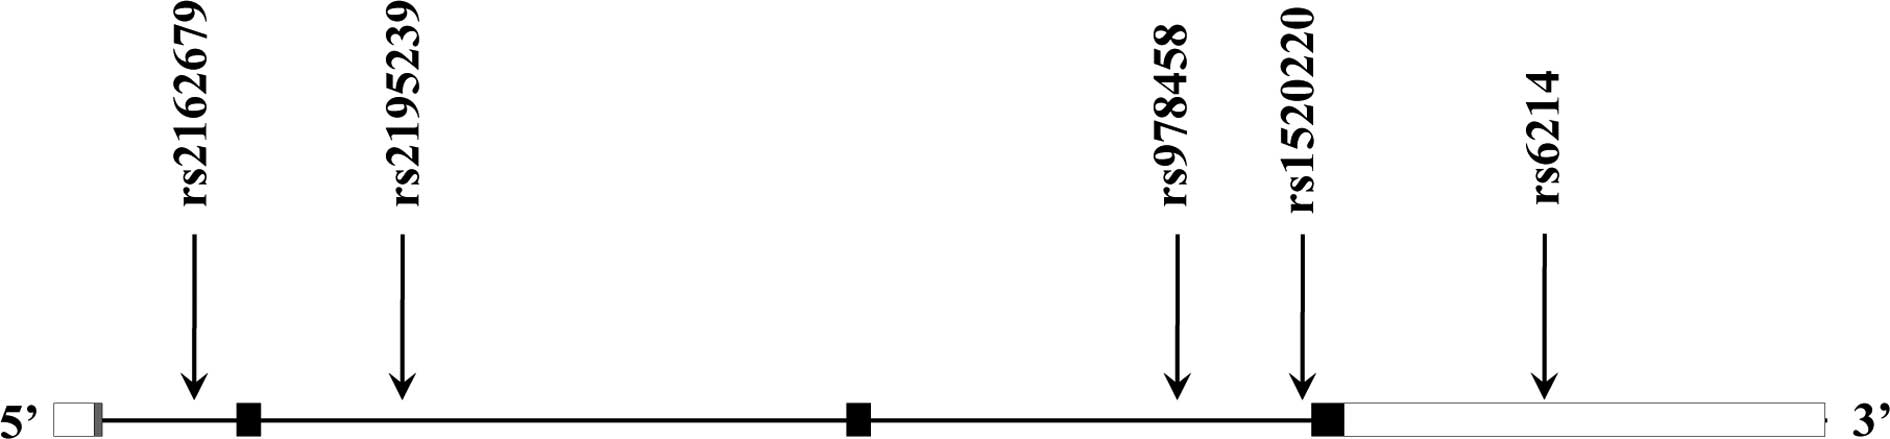
previous studies (13–15). Finally, five SNPs [rs2162679
(intron), rs2195239 (intron), rs978458 (intron), rs1520220 (intron)
and rs6214 (3′ untranslated region; 3′UTR)] were selected (Fig. 1). Genotypes of the five selected
SNPs were analyzed by direct sequencing (Macrogen, Seoul, Republic
of Korea). Polymerase chain reactions (PCRs) were conducted using
the forward and reverse primers of each SNP (Table II). PCRs were performed under the
following conditions: 35 cycles at 95°C for 30 sec, 58°C for 30
sec, 72°C for 30 sec, and 1 cycle at 72°C for 5 min for the final
reaction. The PCR products were sequenced by an ABI PRISM 3730XL
analyzer (PE Applied Biosystems, Foster City, CA, USA) and
genotypes of each SNP were analyzed by SeqManII software (DNASTAR,
Madison, WI, USA).
 | Table II.Primer sequences for each single
nucleotide polymorphism (SNP). |
Table II.
Primer sequences for each single
nucleotide polymorphism (SNP).
| SNP | Forward
(5′-3′) | Reverse
(5′-3′) | Size (bp) |
|---|
| rs2162679 |
TCTGCAAGATCAATCACAGGTT |
AAAAACCAAAACCCCTGTCTCT | 386 |
| rs2195239 |
CAAATTTCAGCTGCGACTTTATC |
GAGCCAAAACCATCTCTACACC | 306 |
| rs978458 |
TCCACTAGAGCCAAAGAAGAGC |
GTGAAATGGTGGAGGATGATTT | 381 |
| rs1520220 |
AAAGGATCTAGAGGCCAGAAGG |
AGTTCTTGTTTCCTGCACTCCC | 390 |
| rs6214 |
CCAGACATACAGGTTCTGTGGA |
TTGGAGAGGATTATGTGTTGGA | 304 |
Statistical analysis
SNPStats (http://bioinfo.iconcologia.net/index.php?module=Snpstats),
SNPAnalyzer Pro (ISTECH, Goyang, Republic of Korea), and Helixtree
(Golden Helix, Bozeman, MT, USA) were used to obtain odds ratios
(ORs), 95% confidence intervals (CIs) and p-values. Hardy-Weinberg
equilibrium (HWE) was calculated using the Chi-square test.
Multiple logistic regression models were conducted using the
following models: codominant1 (major allele homozygotes vs.
heterozygotes), codominant2 (major allele homozygotes vs. minor
allele homozygotes), dominant (major allele homozygotes vs.
heterozygotes and minor allele homozygotes), recessive (major
allele homozygotes and heterozygotes vs. minor allele homozygotes)
and log-additive (major allele homozygotes vs. heterozygotes vs.
minor allele homozygotes) (16,17).
Bonferroni correction was performed to obtain further statistical
significance. Linkage disequilibrium (LD) blocks were estimated
using Haploview version 4.2 (Daly Lab, Cambridge, MA, USA). The
required case size in each SNP was estimated using the genetic
power calculator (http://pngu.mgh.harvard.edu/~purcell/gpc/cc2.html) to
obtain the statistical power. The statistical significant level was
set at a value of p<0.05.
Results
Demographic and clinical features of
study subjects
Table I shows the
demographic and clinical features of the IS patients and the
control subjects. The age of the IS patients and control subjects
was 65.8±12.1 (mean ± SD) and 62.9±9.3 years, respectively. The
number of IS patients and control subjects was 119 (66 male/53
female) and 289 (150 male/139 female), respectively. All IS
patients were divided into two clinical subgroups according to the
NIHSS (<6 and ≥6) and MBI scores (<60 and ≥60). The numbers
of IS patients with a NIHSS score of <6 and ≥6 were 55 (49.1%)
and 57 (50.9%), respectively. The numbers of IS patients with a MBI
score of <60 and ≥60 were 71 (74.7%) and 24 (25.3%),
respectively. In two clinical subgroups, patients with
inappropriate or insufficient clinical data, were excluded
(Table I).
| Table I.Clinical characteristics in stroke
patients and control subjects. |
Table I.
Clinical characteristics in stroke
patients and control subjects.
| IS | Control |
|---|
| Total no. | 119 | 289 |
| Male/female
(n) | 66/53 | 150/139 |
| Age (mean ± SD,
years) | 65.8±12.1 | 62.9±9.3 |
| NIHSS (score) | | |
| <6 | 55 | |
| ≥6 | 57 | |
| MBI (score) | | |
| <60 | 71 | |
| ≥60 | 24 | |
Genetic analysis of IGF1 SNPs
Table III
represents the genotype and allele frequencies of the five examined
SNPs (rs2162679, rs2195239, rs978458, rs1520220 and rs6214) in the
IS patients and the control subjects. The HWE of the five SNPs
showed no difference in the control group (rs2162679, p=0.61;
rs2195239, p=0.18; rs978458, p=0.91; rs1520220, p=1.00; rs6214,
p=1.00). Multiple logistic regression analysis adjusting for age
and gender was performed. An intron SNP (rs2162679) was associated
with the development of IS [p=0.0050, OR = 0.27, 95% CI = 0.11–0.67
in the codominant2 model (A/A vs. G/G); p=0.0150, OR = 0.58, 95% CI
= 0.37–0.90 in the dominant model (A/A vs. A/G and G/G); p=0.0059,
OR = 0.32, 95% CI = 0.13–0.79 in the recessive model (A/A and A/G
vs. G/G); and p=0.0020, OR = 0.59, 95% CI = 0.41–0.83 in the
log-additive model (A/A vs. A/G vs. G/G)]. A 3′UTR SNP (rs6214) was
also associated with the development of IS [p=0.0110, OR = 0.44,
95% CI = 0.23–0.83 in the codominant2 model (G/G vs. A/A);
p=0.0250, OR = 0.59, 95% CI = 0.37–0.93 in the dominant model (G/G
vs. A/G and A/A); p=0.0420, OR = 0.57, 95% CI = 0.32–1.00 in the
recessive model (G/G and A/G vs. A/A); and p=0.0088, OR = 0.66, 95%
CI = 0.49–0.90 in the log-additive model (G/G vs. A/G vs. A/A)].
The A allele frequency of rs2162679 was higher in the IS group
(74.4%) than in the control group (63.8%) (p=0.004, OR = 1.64, 95%
CI = 1.17–2.31). The G allele frequency of rs6214 was higher in the
IS group (60.5%) than in the control group (50.2%) (p=0.007, OR =
1.52, 95% CI = 1.12–2.07). After Bonferroni correction
(pc), the allele frequencies of rs2162679 and rs6214
showed significant differences between IS and the controls
(rs2162679, pc=0.004; rs6214, pc=0.007). The
other SNPs (rs2195239, rs978458 and rs1520220) had no differences
between IS and the controls (Table
III). The LD block was estimated using Haploview version 4.2.
One LD block was strongly made between rs1520220 and rs978458
(D’=1.0 and r2=0.993 in the control group). However, the
haplotypes of these two SNPs were not associated with the
development of IS (data not shown). IS patients were classified
into two clinical subgroups according to the NIHSS (<6 and ≥6)
and MBI (<60 and ≥60) scores. As shown in Table IV, the five tested SNPs were not
associated with the NIHSS and MBI scores.
| Table III.Genotype and allele frequencies of
IGF singe nucleotide polymorphisms in controls and IS
patients. |
Table III.
Genotype and allele frequencies of
IGF singe nucleotide polymorphisms in controls and IS
patients.
| SNP | Type | Control
| IS
| Model | OR (95% CI) | p-value | pc |
|---|
| n | % | n | % | | | | |
|---|
| rs2162679 | A/A | 120 | 41.5 | 63 | 53.9 | Codominant1 | 0.68
(0.43–1.07) | 0.0900 | 0.4500 |
| Intron | A/G | 129 | 44.6 | 48 | 41.0 | Codominant2 | 0.27
(0.11–0.67) | 0.0050 | 0.0250 |
| G/G | 40 | 13.8 | 6 | 5.1 | Dominant | 0.58
(0.37–0.90) | 0.0150 | 0.0800 |
| | | | | | Recessive | 0.32
(0.13–0.79) | 0.0059 | 0.0295 |
| | | | | | Log-additive | 0.59
(0.41–0.83) | 0.0020 | 0.0100 |
| G | 209 | 36.2 | 60 | 25.6 | | 1 | | |
| A | 369 | 63.8 | 174 | 74.4 | | 1.64
(1.17–2.31) | 0.0040 | 0.0200 |
| rs2195239 | G/G | 93 | 32.2 | 43 | 36.1 | Codominant1 | 0.84
(0.53–1.36) | 0.4800 | 1.0000 |
| Intron | C/G | 152 | 52.6 | 60 | 50.4 | Codominant2 | 0.78
(0.39–1.54) | 0.4700 | 1.0000 |
| C/C | 44 | 15.2 | 16 | 13.4 | Dominant | 0.83
(0.53–1.30) | 0.4200 | 1.0000 |
| | | | | | Recessive | 0.86
(0.46–1.61) | 0.6400 | 1.0000 |
| | | | | | Log-additive | 0.87
(0.63–1.21) | 0.4100 | 1.0000 |
| G | 338 | 58.5 | 146 | 61.3 | | 1 | | |
| C | 240 | 41.5 | 92 | 38.7 | | 0.89
(0.65–1.21) | 0.4500 | 1.0000 |
| rs978458 | G/G | 90 | 31.1 | 41 | 34.5 | Codominant1 | 0.92
(0.57–1.48) | 0.7200 | 1.0000 |
| Intron | A/G | 144 | 49.8 | 60 | 50.4 | Codominant2 | 0.70
(0.37–1.36) | 0.3000 | 1.0000 |
| A/A | 55 | 19.0 | 18 | 15.1 | Dominant | 0.86
(0.54–1.35) | 0.5100 | 1.0000 |
| | | | | | Recessive | 0.74
(0.41–1.34) | 0.3200 | 1.0000 |
| | | | | | Log-additive | 0.85
(0.62–1.17) | 0.3200 | 1.0000 |
| G | 324 | 56.1 | 142 | 59.7 | | 1 | | |
| A | 254 | 43.9 | 96 | 40.3 | | 0.86
(0.64–1.17) | 0.3400 | 1.0000 |
| rs1520220 | C/C | 90 | 31.1 | 41 | 34.8 | Codominant1 | 0.93
(0.57–1.50) | 0.7500 | 1.0000 |
| Intron | C/G | 143 | 49.5 | 60 | 50.9 | Codominant2 | 0.64
(0.33–1.25) | 0.2000 | 1.0000 |
| G/G | 56 | 19.4 | 17 | 14.4 | Dominant | 0.85
(0.53–1.34) | 0.4700 | 1.0000 |
| | | | | | Recessive | 0.68
(0.37–1.23) | 0.1900 | 0.9500 |
| | | | | | Log-additive | 0.83
(0.60–1.13) | 0.2300 | 1.0000 |
| C | 323 | 55.9 | 142 | 60.2 | | 1 | | |
| G | 255 | 44.1 | 94 | 39.8 | | 0.84
(0.62–1.14) | 0.2600 | 1.0000 |
| rs6214 | G/G | 73 | 25.3 | 44 | 37.0 | Codominant1 | 0.66
(0.41–1.08) | 0.1000 | 0.5000 |
| 3′UTR | A/G | 144 | 49.8 | 56 | 47.1 | Codominant2 | 0.44
(0.23–0.83) | 0.0110 | 0.0600 |
| A/A | 72 | 24.9 | 19 | 16.0 | Dominant | 0.59
(0.37–0.93) | 0.0250 | 0.1300 |
| | | | | | Recessive | 0.57
(0.32–1.00) | 0.0420 | 0.2100 |
| | | | | | Log-additive | 0.66
(0.49–0.90) | 0.0088 | 0.0440 |
| A | 288 | 49.8 | 94 | 39.5 | | 1 | | |
| G | 290 | 50.2 | 144 | 60.5 | | 1.52
(1.12–2.07) | 0.0070 | 0.0350 |
| Table IV.Genotype frequencies of IGF
singe nucleotide polymorphisms in stroke subgroups according to the
NIHSS and MBI scores. |
Table IV.
Genotype frequencies of IGF
singe nucleotide polymorphisms in stroke subgroups according to the
NIHSS and MBI scores.
| SNP | Type | Subgroups
| Model | OR (95% CI) | p-value |
|---|
| n | % | n | % | | | |
|---|
| NHISS | | (<6) | | (≥6) | | | | |
| rs2162679 | A/A | 27 | 49.1 | 32 | 58.2 | Codominant1 | 0.63
(0.29–1.38) | 0.25 |
| Intron | A/G | 26 | 47.3 | 20 | 36.4 | Codominant2 | 1.26
(0.19–8.23) | 0.81 |
| G/G | 2 | 3.6 | 3 | 5.5 | Dominant | 0.67
(0.31–1.45) | 0.31 |
| | | | | | Recessive | 1.56
(0.25–9.79) | 0.63 |
| | | | | | Log-additive | 0.79
(0.41–1.53) | 0.49 |
| rs2195239 | G/G | 23 | 41.8 | 16 | 28.1 | Codominant1 | 2.00
(0.87–4.59) | 0.10 |
| Intron | C/G | 24 | 43.6 | 33 | 57.9 | Codominant2 | 1.46
(0.45–4.73) | 0.53 |
| C/C | 8 | 14.6 | 8 | 14.0 | Dominant | 1.87
(0.84–4.12) | 0.12 |
| | | | | | Recessive | 0.97
(0.34–2.80) | 0.95 |
| | | | | | Log-additive | 1.36
(0.77–2.38) | 0.28 |
| rs978458 | G/G | 22 | 40.0 | 15 | 26.3 | Codominant1 | 1.89
(0.82–4.39) | 0.14 |
| Intron | A/G | 25 | 45.5 | 32 | 56.1 | Codominant2 | 1.87
(0.60–5.87) | 0.28 |
| A/A | 8 | 14.6 | 10 | 17.5 | Dominant | 1.89
(0.85–4.21) | 0.12 |
| | | | | | Recessive | 1.27
(0.46–3.51) | 0.65 |
| | | | | | Log-additive | 1.46
(0.83–2.54) | 0.18 |
| rs1520220 | C/C | 22 | 40.0 | 15 | 26.8 | Codominant1 | 1.77
(0.76–4.10) | 0.18 |
| Intron | C/G | 26 | 47.3 | 31 | 55.4 | Codominant2 | 2.12
(0.66–6.86) | 0.21 |
| G/G | 7 | 12.7 | 10 | 17.9 | Dominant | 1.84
(0.83–4.12) | 0.13 |
| | | | | | Recessive | 1.50
(0.52–4.28) | 0.45 |
| | | | | | Log-additive | 1.52
(0.86–2.67) | 0.14 |
| rs6214 | G/G | 20 | 36.4 | 21 | 36.8 | Codominant1 | 0.96
(0.42–2.20) | 0.92 |
| 3′UTR | A/G | 27 | 49.1 | 26 | 45.6 | Codominant2 | 1.22
(0.40–3.73) | 0.73 |
| A/A | 8 | 14.6 | 10 | 17.5 | Dominant | 1.02
(0.47–2.23) | 0.96 |
| | | | | | Recessive | 1.25
(0.45–3.45) | 0.67 |
| | | | | | Log-additive | 1.07
(0.63–1.84) | 0.79 |
| MBI | | (<60) | | (≥60) | | | | |
| rs2162679 | A/A | 37 | 53.6 | 15 | 62.5 | Codominant1 | 0.96
(0.35–2.65) | 0.94 |
| Intron | A/G | 29 | 42.0 | 9 | 37.5 | Codominant2 | 0.00 (0.00-NA) | |
| G/G | 3 | 4.3 | 0 | 0.0 | Dominant | 0.91
(0.33–2.50) | 0.85 |
| | | | | | Recessive | 0.00 (0.00-NA) | 0.32 |
| | | | | | Log-additive | 0.83
(0.32–2.15) | 0.70 |
| rs2195239 | G/G | 25 | 35.2 | 8 | 33.3 | Codominant1 | 1.06
(0.36–3.12) | 0.91 |
| Intron | C/G | 36 | 50.7 | 13 | 54.2 | Codominant2 | 0.86
(0.17–4.33) | 0.86 |
| C/C | 10 | 14.1 | 3 | 12.5 | Dominant | 1.02
(0.36–2.88) | 0.97 |
| | | | | | Recessive | 0.83
(0.19–3.61) | 0.80 |
| | | | | | Log-additive | 0.96
(0.46–2.03) | 0.92 |
| rs978458 | G/G | 24 | 33.8 | 7 | 29.2 | Codominant1 | 1.40
(0.46–4.25) | 0.55 |
| Intron | A/G | 35 | 49.3 | 14 | 58.3 | Codominant2 | 0.83
(0.17–4.15) | 0.82 |
| A/A | 12 | 16.9 | 3 | 12.5 | Dominant | 1.26
(0.43–3.66) | 0.67 |
| | | | | | Recessive | 0.67
(0.16–2.82) | 0.58 |
| | | | | | Log-additive | 1.00
(0.48–2.07) | 1.00 |
| rs1520220 | C/C | 24 | 34.3 | 7 | 29.2 | Codominant1 | 1.44
(0.47–4.36) | 0.52 |
| Intron | C/G | 35 | 50.0 | 14 | 58.3 | Codominant2 | 0.90
(0.18–4.57) | 0.90 |
| G/G | 11 | 15.7 | 3 | 12.5 | Dominant | 1.31
(0.45–3.81) | 0.62 |
| | | | | | Recessive | 0.72
(0.17–3.06) | 0.65 |
| | | | | | Log-additive | 1.04
(0.50–2.17) | 0.92 |
| rs6214 | G/G | 26 | 36.6 | 10 | 41.7 | Codominant1 | 0.41
(0.13–1.32) | 0.14 |
| 3′UTR | A/G | 37 | 52.1 | 8 | 33.3 | Codominant2 | 1.56
(0.40–6.13) | 0.53 |
| A/A | 8 | 11.3 | 6 | 25.0 | Dominant | 0.62
(0.22–1.75) | 0.37 |
| | | | | | Recessive | 2.50
(0.73–8.61) | 0.15 |
| | | | | | Log-additive | 1.06
(0.52–2.17) | 0.86 |
Sample power
We estimated the sample power using a genetic power
calculator to obtain the required sample size. The sample powers
(α=0.05, genotype relative risk 2-fold, number of case for 70%
power) of each SNP in the IS group were 0.757 for rs2162679
(n=104), 0.800 for rs2195239 (n=93), 0.801 for rs978458 (n=93),
0.801 for rs1520220 (n=93) and 0.801 for rs6214 (n=93). Therefore,
the results of the five examined SNPs in the IGF1 gene had
statistical confidence.
Discussion
IGF1 is an endogenous survival factor for neurons,
glial cells and endothelial cells. IGF1 plays an important role in
tissue repair and cell proliferation. IGF1 induces the synthesis of
elastin and prevents apoptosis of vascular smooth muscle cells.
Therefore, low levels of IGF1 may be a risk factor of stroke. As
shown in previous studies, the expression of IGF1 increased after
hypoxic injury in regions with neuronal loss (18) and IGF1 reduced infarct volume and
improved neurological function after ischemia in an animal study
(19).
There are several reports that IGF1
polymorphisms are associated with certain diseases, such as
adenocarcinoma (EAC) and colorectal cancer (15,20).
McElholm et al observed that IGF1 SNP rs6214 was
associated with Barrett’s esophagus (BE) in EAC (15). Using GG genotype as reference, OR
for BE in AA (wild-type) was 0.43 (95% CI 0.24–0.75). Feik et
al also suggested that rs6214 could have an impact on
developing colorectal cancer and colorectal polyps with villous
elements (20). Based on previous
studies, we believed that the SNPs of IGF1 were associated
with the development of IS and clinical features according to the
NIHSS and MBI scores in Korean stroke patients. In the present
study, we found a significant association between IGF1 SNPs
and IS. The G allele frequency of rs6214 in the IGF1 gene
was higher in the IS group (60.5%) than in the control group
(50.2%). The A allele of rs2162679 was also higher in the IS group
(74.4%) than in the control group (74.4%). Thus, our results
suggest that IGF1 may be a risk factor of IS development.
However, all five SNPs (rs2162679, rs2195239, rs978458, rs1520220
and rs6214) of IGF1 did not contribute to the NIHSS and MBI
scores of IS. To our knowledge, this is the first study on whether
IGF1 SNPs are associated with the development of IS in a
Korean population. Additional studies with a larger number of cases
or different populations are required in order to confirm our
results.
In conclusion, we suggest that an intron SNP
(rs2162679) and 3′UTR SNP (rs6214) of the IGF1 gene may be
associated with the development of IS.
Acknowledgements
This work was supported by the
Biogreen 21 Program (Code PJ007187), Rural Development
Administration
References
|
1.
|
RA GrysiewiczK ThomasDK PandeyEpidemiology
of ischemic and hemorrhagic stroke: incidence, prevalence,
mortality, and risk factorsNeurol
Clin26871895200810.1016/j.ncl.2008.07.00319026895
|
|
2.
|
CJ Van AschMJ LuitseGJ RinkelIncidence,
case fatality, and functional outcome of intracerebral haemorrhage
over time, according to age, sex, and ethnic origin: a systematic
review and meta-analysisLancet Neurol9167176201020056489
|
|
3.
|
HM TaoGZ ChenXD LuGP ChenB ShaoTGF-beta1
869T/C polymorphism and ischemic stroke: sex difference in
ChineseCan J Neurol Sci37803807201021059542
|
|
4.
|
Y TongY GengJ XuThe role of functional
polymorphisms of the TNF-alpha gene promoter in the risk of
ischemic stroke in Chinese Han and Uyghur populations: two
case-control studiesClin Chim
Acta41112911295201010.1016/j.cca.2010.05.00720493182
|
|
5.
|
YH LimYS JeongSK KimAssociation between
TGFBR2 gene polymorphism (rs2228048, Asn389Asn) and intracerebral
hemorrhage in Korean PopulationImmunol
Invest40569580201110.3109/08820139.2011.55949821609163
|
|
6.
|
S KalmijnJA JanssenHA PolsSW LambertsMM
BretelerA prospective study on circulating insulin-like growth
factor I (IGF-I), IGF-binding proteins, and cognitive function in
the elderlyJ Clin Endocrinol
Metab8545514555200010.1210/jcem.85.12.703311134107
|
|
7.
|
M TagamiK YamagataY NaraInsulin-like
growth factors prevent apoptosis in cortical neurons isolated from
stroke-prone spontaneously hypertensive ratsLab
Invest7660361219979166279
|
|
8.
|
C GalliO MeucciA ScorzielloApoptosis in
cerebellar granule cells is blocked by high KCl, forskolin, and
IGF-1 through distinct mechanisms of action: the involvement of
intracellular calcium and RNA synthesisJ
Neurosci151172117919957532699
|
|
9.
|
R KooijmanS SarreY MichotteJ De
KeyserInsulin-like growth factor I: a potential neuroprotective
compound for the treatment of acute ischemic
stroke?Stroke40e83e88200910.1161/STROKEAHA.108.52835619197073
|
|
10.
|
J GuanAJ GunnES SirimanneThe window of
opportunity for neuronal rescue with insulin-like growth factor-1
after hypoxia-ischemia in rats is critically modulated by cerebral
temperature during recoveryJ Cereb Blood Flow
Metab20513519200010.1097/00004647-200003000-0001010724116
|
|
11.
|
A De SmedtR BrounsM
UyttenboogaartInsulin-like growth factor I serum levels influence
ischemic stroke outcomeStroke4221802185201121700939
|
|
12.
|
M BondanelliMR AmbrosioA OnofriPredictive
value of circulating insulin-like growth factor I levels in
ischemic stroke outcomeJ Clin Endocrinol
Metab9139283934200610.1210/jc.2006-104016882751
|
|
13.
|
M HenningsonM HietalaT TorngrenH OlssonH
JernstromIGF1 htSNPs in relation to IGF-1 levels in young women
from high-risk breast cancer families: implications for early-onset
breast cancerFam
Cancer10173185201010.1007/s10689-010-9404-z21113804
|
|
14.
|
WH HahnJS SuhBS ChoPolymorphisms of
insulin-like growth factor-1 (IGF-1) and IGF-1 receptor (IGF-1R)
contribute to pathologic progression in childhood IgA
nephropathyGrowth
Factors29813201010.3109/08977194.2010.53212621047277
|
|
15.
|
AR McElholmAJ McKnightCC PattersonA
population-based study of IGF axis polymorphisms and the esophageal
inflammation, metaplasia, adenocarcinoma
sequenceGastroenterology139204212201010.1053/j.gastro.2010.04.01420403354
|
|
16.
|
SK KimHJ ParkJS LeeAssociation of
niemann-pick disease, type c2 (NPC2) polymorphisms with obesity in
Korean populationMol Cell Toxicol63954002010
|
|
17.
|
TW LimSK KimJY BanPolymorphisms of
transmembrane channel-like 1 gene are associated with Kawasaki
disease in Korean populationMol Cell Toxicol52912972009
|
|
18.
|
P GluckmanN KlemptJ GuanA role for IGF-1
in the rescue of CNS neurons following hypoxic-ischemic
injuryBiochem Biophys Res
Commun182593599199210.1016/0006-291X(92)91774-K1370886
|
|
19.
|
XF LiuJR FawcettRG ThorneWH Frey
IINon-invasive intranasal insulin-like growth factor-I reduces
infarct volume and improves neurologic function in rats following
middle cerebral artery occlusionNeurosci Lett30891942001
|
|
20.
|
E FeikA BaierlB HiegerAssociation of IGF1
and IGFBP3 polymorphisms with colorectal polyps and colorectal
cancer riskCancer Causes
Control219197201010.1007/s10552-009-9438-419784788
|