Introduction
Chronic infectious disease and inflammation increase
lymphoma risk (1). Certain
infectious agents are connected to specific types of lymphoma,
including Helicobacter pylori in MALT lymphoma and human
T-cell leukemia virus in adult T-cell leukemia/lymphoma (2). Several types of chronic infection,
for example those caused by hepatitis C and Epstein-Barr virus, are
a risk factor for multiple types of hematologic malignancies
(3,4). Although the connection between
chronic inflammation and increased lymphoma risk is well
established, how chronic inflammation contributes to lymphoma
etiology and affects the response to chemotherapeutic intervention
is not well understood.
One factor that cells at the site of chronic
inflammation encounter is an increase in reactive oxygen species
(ROS) as the host mounts an immune response. Infection of lymphoid
cells with Epstein-Barr virus also directly increases intracellular
ROS (5). Chronic exposure to ROS
results in cells with increased anti-oxidant defense enzymes that
allow cells to survive under these conditions (6–8). The
impact of oxidative stress resistance on lymphoma chemotherapy
response is unknown. To test the consequences of chronic ROS
exposure on lymphoma drug response, we selected a population of
WEHI7.2 murine thymic lymphoma cells resistant to hydrogen peroxide
(H2O2) (8),
one of the ROS found at inflammatory sites. We also constructed
WEHI7.2 transfectants that overexpress catalase (9), an enzyme that detoxifies
H2O2, as proof of principle. Previously, we
found that the oxidative stress resistant cells were
cross-resistant to glucocorticoids, a commonly used lymphoma
chemotherapeutic (8,9).
Our hypothesis is that an alteration in anti-oxidant
defense enzymes (or development of resistance to oxidants) results
in multiple redox changes that contribute to chemoresistance. We
predict that the oxidative stress-resistant cells will be resistant
to agents that depend on ROS generation to cause death. However, we
also expect cross-resistance to agents that do not depend on ROS
per se, but are detoxified via pathways that respond to
redox regulation. To test this hypothesis, we first measured
primary anti-oxidant defense enzymes, small-molecule reductants and
the phase 2 detoxification enzymes in the variants to assess the
impact of anti-oxidant defense enzyme modulation on the redox
biology of lymphoid cells. We then evaluated the response to
chemotherapeutic drugs. These data indicate that: i) modulation of
one anti-oxidant defense enzyme alters a web of redox responsive
pathways in the cell; and ii) oxidative stress resistance
potentially contributes to the chemoresistant phenotype in
lymphoma.
Materials and methods
Drugs and chemicals
4-Hydroxynonenol was purchased from Cayman Chemical
Co. (Ann Arbor, MI, USA). All other drugs, chemicals and purified
enzymes were purchased from Sigma Chemical Co. (St. Louis, MO,
USA), except as noted.
Cell culture and development of
variants
The mouse thymic lymphoma WEHI7.2 parental cell line
(10) and variants overexpressing
rat catalase (CAT2, 2-fold increase; CAT38, 1.4-fold increase),
vector only (Neo2, Neo3) (9) or
selected for resistance to 200 μM H2O2 (200R)
(8), were maintained in suspension
cultures, as described in the indicated references. Any variant
normally grown in the presence of drug was cultured in the absence
of drug for 1 week prior to each experiment. For all measurements,
except EC50 and EC90, cells were subcultured
in new medium 24 h before the samples were taken.
Protein measurements
Cellular protein was measured in clarified lysates
using the BCA Protein Assay kit (Pierce, Rockford, IL, USA)
according to the manufacturer’s instructions.
Enzyme activity measurements
Prior to enzyme activity measurements, cells were
washed twice with phosphate-buffered saline (PBS) at 4°C. For the
measurement of catalase, glutathione peroxidase, glutathione
reductase and NAD(P) H:quinone oxidoreductase (NQO1), cells were
resuspended in 10 mM Tris-HCl, pH 7.5, 250 mM sucrose, 1 mM EDTA,
0.5 mM dithiothreitol, 0.1 mM phenylmethylsulfonyl fluoride and 1%
Triton X-100. Samples were incubated for 30 min at 4°C and
centrifuged at 10,000 x g for 15 min at 4°C. Activity was measured
in the supernatant fractions. Catalase and glutathione peroxidase
activities were measured as described in Tome and Briehl (8). Glutathione reductase activity was
measured in the supernatant by monitoring the disappearance of
NADPH in the presence of glutathione disulfide (GSSG) (11). Activity was calculated using an
extinction coefficient of 6.3 6.3 mM−1cm−1.
NQO1 activity was measured as the rate of
2,6-dichlorophenol-indophenol (DPIP) reduction (12). Rates were calculated using the
extinction coefficient 2.1×10⁴
M−1cm−1. The difference in rates in the
presence and absence of dicumerol, which corrects for non-specific
NAD(P) H oxidase activity, was used to calculate specific NQO1
activity. Total superoxide dismutase (SOD) and glutathione
S-transferase (GST) activities were measured as described in Tome
and Briehl (8). Enzyme activities
were normalized to cell protein. Glucose 6-phosphate dehydrogenase
(G6PDH) activity was measured as in Tome et al (13). Enzyme activity was normalized to
cell number.
Northern blots
Peroxiredoxin 1–3 expression was measured by
northern blotting as previously described (8).
EC50 and EC90
measurements
Cells were grown in a range of drug or oxidant
concentrations for 48 h. For H2O2, relative
cell number was measured using the Cell Proliferation kit II (XTT)
(Roche Diagnostics, Mannheim, Germany) according to the
manufacturer’s protocol. For all other drugs and oxidants, relative
cell number was measured using the Non-radioactive Cell
Proliferation Assay (MTS) according to the manufacturer’s protocol
(Promega Corp., Madison, WI, USA). For both types of assays, the
plates were read at 490 nm using a Microplate Autoreader (Bio-Tek
Instruments). Fraction control absorbance was calculated as
previously described (14). The
EC50 or EC90 was defined as the concentration
at which the absorbance was 50 or 90% that of the control,
respectively. For each cell variant, at least three independent
plates were assayed.
Apoptosis measurements
Sensitivity to dexamethasone was determined by
incubating cells in a final concentration of 1 μM dexamethasone in
an ethanol vehicle (final concentration of ethanol = 0.01%) or an
equivalent amount of vehicle alone. Apoptotic cells were measured
by flow cytometry as in Tome et al (15). The percentage of apoptotic cells in
the presence of dexamethasone was corrected for that in the
vehicle-treated cells for each cell variant.
Glutathione (GSH), glutathione disulfide
and pyridine nucleotide measurements
GSH and GSSG were measured as dansyl derivatives
using an HPLC with fluorometric detection as described by Jones
et al (16), or using the
Bioxytech GSH/GSSG 412 kit (Oxis Research, Portland, OR, USA)
according to the manufacturer’s protocol. Pyridine nucleotides were
extracted and measured using the enzymatic cycling method of
Jacobson and Jacobson (17), which
depends on the oxidation of thiazolyl blue. All measurements were
normalized to cellular protein. Cell volume was calculated using
the cell diameter measured with the Vi-Cell 1.01 (Beckman Coulter,
Fullerton, CA, USA). Redox potential was calculated using a
simplified Nernst equation Eh (in mV) = E0 +
30 log [(GSSG)/(GSH)2] using molar concentrations of GSH
and GSSG and E0 = −264 mV for pH 7.4 (18).
ROS measurements
ROS was measured as in Tome et al (15) using the fluorescent dyes
5-(and-6)-carboxy-2′7′dichlorofluorescein diacetate
(cDCFH-DA/cDCFH) (C-369), 2′7′dichlorodihydrofluorescein diacetate
(DCFH-DA/DCF)(D-399) (Molecular Probes, Inc., Eugene, OR, USA) and
propidium iodide. Cells that were propidium iodide-positive were
excluded from analysis. Fluorescence due to DCF, which indicates
ROS, was corrected for the relative cDCFH fluorescence to account
for differences in dye uptake between the variants and the WEHI7.2
cells.
Immunoblots
Proteins were separated by gel electrophoresis and
blots were prepared as previously described (9). Blots were probed as previously
described (9) using primary
antibodies as follows: 1:7,500 dilution anti-Cu,ZnSOD (Abcam Inc.,
Cambridge, MA, USA); 1:2,000 dilution anti-MnSOD (19); 1:2,000 dilution anti-GPX-1 (Lab
Frontiers, Seoul, Korea); 1:500 dilution anti-GST Yb1 (GSTμ) and
GSTα (Biotrin, Dublin, Ireland); 1:1,000 dilution anti-GSTπ
(Biotrin); or 1:10,000 anti-β-actin (Abcam). Proteins were detected
by incubating with a 1:2,000 dilution of horseradish
peroxidase-linked anti-rabbit or anti-mouse Ig (GE Healthcare,
Piscataway, NJ, USA) as appropriate, and visualized using
chemiluminescence reagents as previously described (9).
Statistics
Means were compared by t-tests using the algorithms
in Excel (Microsoft Corp., Redmond, WA, USA) or the formulas from
Moore and McCabe (20). When a
comparison required multiple t-tests, the Dunn-Bonferoni method was
used to control for type I error (21). Correlation between variables was
analyzed using the regression algorithm in Excel (Microsoft
Corp.).
Results
Primary anti-oxidant defense enzyme
activity
To fully characterize the redox biology in the
WEHI7.2 cells and WEHI7.2 variants, we first quantified the primary
anti-oxidant defense enzymes (Table
I). In mammalian cells, the primary anti-oxidant defense
enzymes metabolize H2O2 and superoxide
(O2•−). For detoxifying
H2O2, cells depend on catalase, glutathione
peroxidase and peroxiredoxins. In exponentially growing cells, as
shown in Table I, catalase
activity was increased by approximately 2-fold in the CAT2 catalase
transfectants and by approximately 1.4-fold in the CAT38 cells
(9). The 200R cells, which are
selected for growth in 200 μM H2O2, also had
approximately 1.4-fold the parental cell catalase activity
(8). The vector
only-overexpressing cells (Neo2, Neo3) had catalase activity
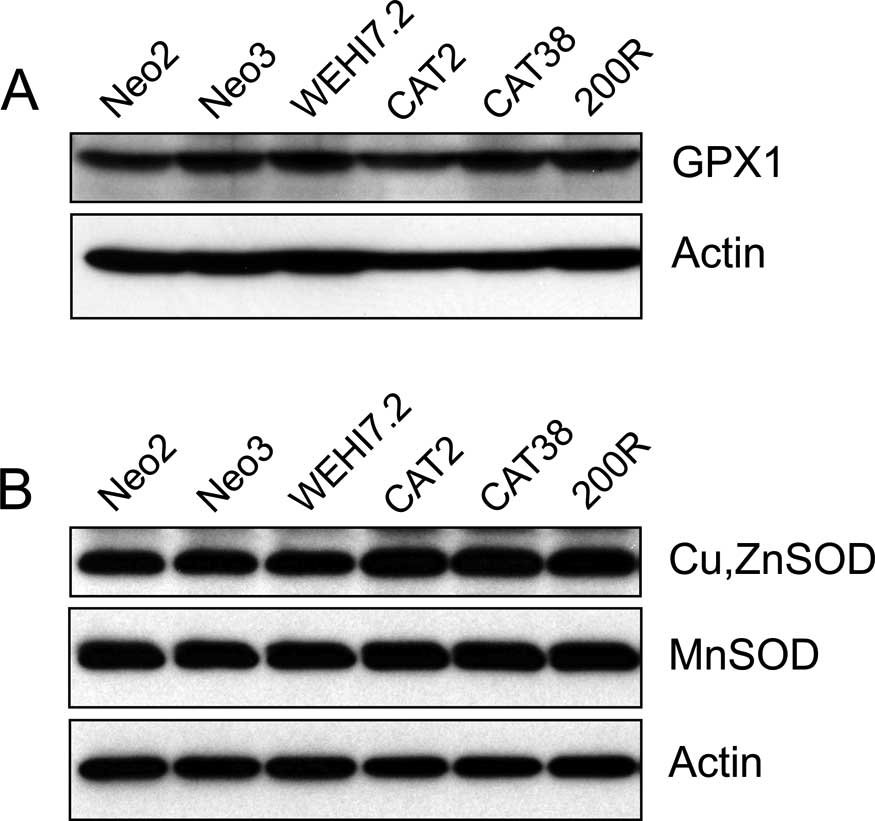
similar to that in the WEHI7.2 cells. Glutathione peroxidase 1
(GPX1) protein was similar in the WEHI7.2 and WEHI7.2 variant cells
(Fig. 1A). Although GPX1 protein
was detectable by immunoblotting, activity was not detectable using
either cumene hydroperoxide or H2O2 as
substrates. There was no difference in the expression of
peroxiredoxins 1–3 (data not shown).
 | Table I.Primary anti-oxidant defense enzyme
activities in the WEHI7.2 cells and WEHI7.2 variants. |
Table I.
Primary anti-oxidant defense enzyme
activities in the WEHI7.2 cells and WEHI7.2 variants.
| Cell variant | Catalase (μmol
H2O2/min/mg prot) | Superoxide
dismutase (U/mg prot) |
|---|
| WEHI7.2 | 14.64±0.28 | 10.6±0.4 |
| Neo2 | 13.10±0.93 | 8.4±0.6 |
| Neo3 | 13.57±1.53 | 8.7±1.1 |
| CAT2 | 27.19±0.73a | 18.9±0.7a |
| CAT38 |
19.27±0.22a,b | 18.0±0.7a |
| 200R | 19.94±0.22a | 18.8±0.6a |
Superoxide is metabolized by superoxide
dismutase (SOD)
MnSOD is located in the mitochondrial matrix and
Cu,ZnSOD is located in the cytosol and mitochondrial intermembrane
space. Total SOD activity was increased in all the variants
compared to the WEHI7.2, Neo2 and Neo3 cells (Table I). Elevated Cu,ZnSOD protein was
noted in the cells with higher total SOD activity, while MnSOD
protein remained similar to that in the WEHI7.2 cells (Fig. 1B). This suggests that the increased
SOD activity was likely due to an increase in Cu,ZnSOD.
Increasing catalase modulates
small-molecule reductants and the redox environment
Small-molecule reductants, including GSH and NADPH,
contribute to the ability of the anti-oxidant defense enzymes to
detoxify ROS. Ratios of the oxidized and reduced forms of these
molecules, in particular GSH, are also used to assess the
intracellular redox environment (18,22,23).
To determine whether the WEHI7.2 variants had alterations in
small-molecule reductants and the redox environment, we measured
the status of the GSSG/GSH and NADP+/NADPH redox
couples. As shown in Table II, the
amount of GSH per milligram protein was decreased in the CAT2,
CAT38 and 200R cells. These differences were more pronounced when
the molarity of GSH in the WEHI7.2 variants was calculated
(Table II). There was no
difference in the amount of GSSG. As an indication of the ability
of the cells to reduce GSSG to GSH, we also measured glutathione
reductase. Glutathione reductase activity was similar in all the
cells.
| Table II.Glutathione (GSH)/glutathione
disulfide (GSSG) redox couple in the WEHI7.2 cells and WEHI7.2
variants. |
Table II.
Glutathione (GSH)/glutathione
disulfide (GSSG) redox couple in the WEHI7.2 cells and WEHI7.2
variants.
| Cell variant | GSH (nmol/mg
prot) | GSH (mM) | GSSG (nmol/mg
prot) | Glutathione
reductase (μmol NADPH/min/mg prot) | GSH/GSSG | Eh
(mV) |
|---|
| WEHI7.2 | 80.56±1.60 | 7.05±0.28 | 1.48±0.13 | 44.3±0.8 | 57.82±5.40 | −251.88±1.35 |
| CAT2 | 64.03±2.12a | 4.14±0.22a | 1.34±0.13 | 44.8±0.7 | 50.36±4.31 |
−243.18±1.13a |
| CAT38 | 61.74±2.88a | 4.60±0.35a | 1.24±0.14 | 46.4±4.3 | 54.19±6.10 |
−245.24±1.70a |
| 200R | 75.61±2.42 | 5.24±0.27a | 1.64±0.23 | 35.7±0.6 | 51.72±5.88 |
−246.33±1.12a |
To examine the redox state of the glutathione
disulfideglutathione redox couple, we first calculated the GSH/GSSG
ratio. Only slight differences in the GSH/GSSG ratio were noted
(Table II). However, since two
molecules of GSH are required to form one molecule of GSSG, using
the Nernst equation to calculate a redox potential is a better
indicator of the redox environment (22,23).
When we calculated the redox potential (Eh) of
GSSG/2GSH, we found that the Eh was higher in the CAT2,
CAT38 and 200R cells (p≤0.05) than in the parental cells indicating
a more oxidized redox environment in these variants (Table II). The Eh in the vector
only-transfected cells was similar to that in the WEHI7.2 cells
(0.97 mV more reduced and 1.49 mV more oxidized for the Neo2 and
Neo3 cells, respectively).
The ultimate source of reducing equivalents to
recycle GSSG is NADPH (22).
Catalase also binds NADPH, although this does not seem to be
required for activity (24). Bound
NADPH eventually becomes oxidized and is replaced by a new molecule
of NADPH (24). Cells with more
catalase may use more NADPH. This suggests that the
NADP+/NADPH redox couple may be critical in the WEHI7.2
variants. When we compared the NADPH in the variants to that in the
parental cells, we found that the amount of the reduced form was
similar (Table III). However, the
total pool (NADPH + NADP+) was increased in all the
variants compared to the WEHI7.2 cells. Neo2 and Neo3 cells were
similar to the WEHI7.2 cells (data not shown). This indicated that
there was more NADP+ in the oxidative stress-resistant
variants and the NADP+/NADPH ratio was altered. In most
unstressed cells, >90% of the NADP(H) pool is in the reduced or
NADPH form (22), similar to what
was observed in the WEHI7.2 cells. The NADP(H) pool was generally
more oxidized in the oxidative stress-resistant variants.
| Table III.NADP+/NADPH redox couple
in the WEHI7.2 cells and WEHI7.2 variants. |
Table III.
NADP+/NADPH redox couple
in the WEHI7.2 cells and WEHI7.2 variants.
| Cell variant | NADPH (pmol/mg
prot)a | NADP(H) total
(pmol/mg prot)a | % reduced | Glucose 6-phosphate
dehydrogenase activity (nmol TNBT/106 cells/min)b |
|---|
| WEHI7.2 | 53±8 | 58±4 | 91±14 | 178.72±9.04 |
| CAT2 | 46±5 | 72±6c | 64±12 |
229.29±10.88c |
| CAT38 | 27±4c,d | 83±4c | 33±9c,d |
249.07±10.73c |
| 200R | 38±6 | 67±4 | 57±9c |
265.45±16.13c |
G6PDH is the first and rate-limiting step in the
pentose phosphate pathway, the major source of NADPH in the cell.
Since the NADP(H) pool may be affected by G6PDH activity, we
measured the G6PDH activity in the parental cells and the variants.
As shown in Table III, G6PDH
activity was increased in the WEHI7.2 variants, which would be
consistent with an increased demand for NADPH. Vector
only-transfected cells were similar to the WEHI7.2 cells (data not
shown).
Although not directly involved in the regulation of
the redox environment, the NAD+/NADH redox couple acts
as an electron sink (22). When we
compared the NAD+ and NADH in the variants and WEHI7.2
cells, we found no difference in the amount of NAD+ or
NADH (Table IV).
| Table IV.NAD+/NADH redox couple in
the WEHI7.2 cells and WEHI7.2 variants. |
Table IV.
NAD+/NADH redox couple in
the WEHI7.2 cells and WEHI7.2 variants.
| Cell variant | NADH (pmol/mg
prot) | NAD(H) total
(pmol/mg prot) | % reduced |
|---|
| WEHI7.2 | 152±14 | 4,057±630 | 3.8±0.9 |
| CAT2 | 121±15 | 4,356±595 | 2.8±0.7a |
| CAT38 | 141±12 | 4,461±623 | 3.2±0.7 |
| 200R | 104±15 | 3,777±237 | 2.8±0.6 |
Phase 2 enzyme activity is increased in
the catalase-overexpressing WEHI7.2 variants
A more oxidized redox environment, as measured by
GSH/GSSG alterations, has been implicated in upregulating
glutathione S-transferase (GST) and NQO1 (23,25).
These phase 2 enzymes detoxify chemotherapeutic drugs and
metabolize oxidation products to decrease oxidative damage
(26,27). Increases in these enzymes have the
potential to impact chemoresistance in lymphoma. As indicated in
Table V, GST and NQO1 enzyme
activities were increased in the WEHI7.2 variants compared to the
WEHI7.2 parental cells. Neo2 cells had significantly higher NQO1
activity compared to WEHI7.2 cells, while Neo3 cells did not
(1.81±0.09- vs. 1.17±0.07-fold WEHI7.2 cell activity,
respectively). GST activity in the Neo2 and Neo3 cells was similar
to WEHI7.2 values (data not shown). Regression analysis of the
enzyme activities with the GSSG/2GSH Eh in the CAT2,
CAT38 and 200R cells showed that GST and NQO1-specific activity was
correlated with the Eh (p=0.0025 and 0.0000746,
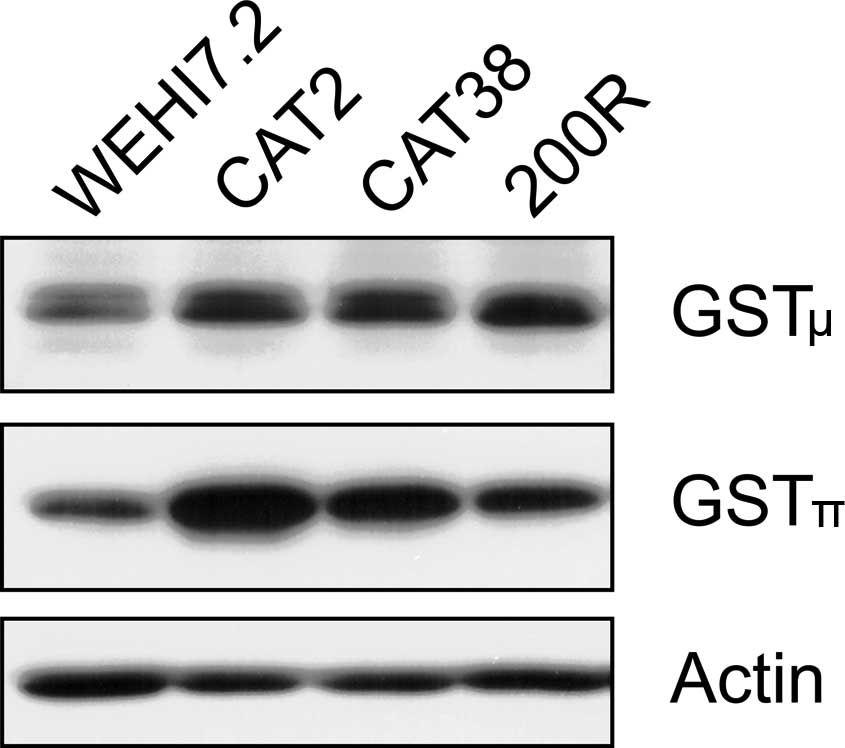
respectively). A further analysis of the GST isozymes showed that
both the μ and π isozymes were increased in the WEHI7.2 variants
(Fig. 2). GSTα was below the
limits of detection on our immunoblots.
| Table V.Phase 2 enzymes in the WEHI7.2 cells
and WEHI7.2 variants. |
Table V.
Phase 2 enzymes in the WEHI7.2 cells
and WEHI7.2 variants.
| Cell variant | Glutathione
S-transferase (μmoles/min/mg prot) | NAD(P)H:quinone
oxidoreductase (μmoles DPIP reduced/min/mg prot) |
|---|
| WEHI7.2 | 55.28±3.94 | 12.99±0.82 |
| CAT2 | 133.00±8.21a | 42.46±1.02a |
| CAT38 |
80.71±1.17a,b |
28.83±4.87a,b |
| 200R | 66.07±4.14 | 23.08±1.85a |
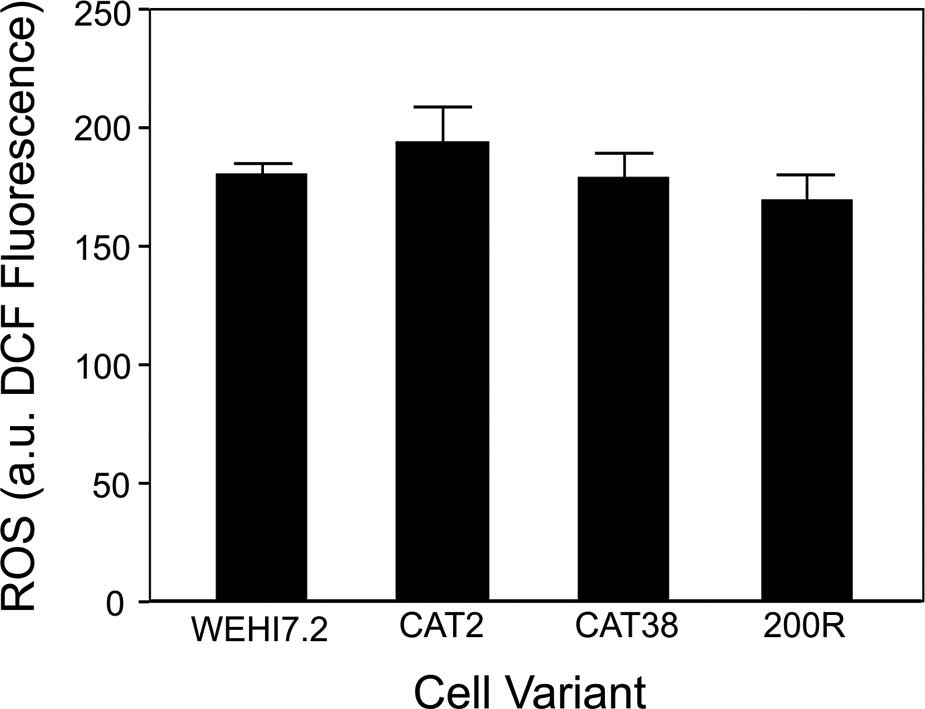
Increasing catalase does not alter
intracellular ROS in unstressed cells
The elevated catalase and SOD activities in the
WEHI7.2 variants have the potential to affect the amount of ROS in
the cell by increasing the removal of H2O2
and O2•−. We measured the basal ROS using the
ROS-sensitive dye, DCFH-DA. ROS levels (DCF fluorescence) in the
CAT2, CAT38, 200R and vector only-transfected cells were similar to
those in the WEHI7.2 cells (Fig.
3). The lack of change in DCF fluorescence was not due to
differential dye uptake, since all the values were corrected for
the fluorescence of 5-(and-6)-carboxy-2′7′dichlorofluorescein
diacetate (C-369; Molecular Probes), a dye that fluoresces in the
cell independent of ROS production (28).
Enhanced anti-oxidant defenses result in
oxidant resistance
Based on the primary anti-oxidant defense enzyme
profile, we predicted that the WEHI7.2 variants would be more
resistant to H2O2 and
O2•−. To test this prediction, we measured
the sensitivity of the WEHI7.2 cells and the variants to a number
of oxidants. In addition to H2O2, we compared
the resistance to paraquat, which enters the cells and is
metabolized to produce endogenous O2•−
(29); 4-hydroxynonenol, a lipid
peroxidation byproduct that reacts with and damages proteins and
lipids (30); and tert-butyl
hydroperoxide, which causes toxicity via lipid peroxidation and
oxidation of thiols (31). As
expected, elevated catalase activity (CAT2, CAT38 cells) increased
the resistance to H2O2 (Table VI). The EC50 for
H2O2 in the catalase transfectants was not as
high as in the 200R cells that were selected for
H2O2 resistance. All the variants were more
resistant to paraquat suggesting an increased ability to metabolize
O2•−. The CAT38 and 200R cells were more
resistant to 4-hydroxynonenol and the CAT2 cells more resistant to
tert-butyl hydroperoxide. The vector only-transfectants had only
two significant differences from the WEHI7.2 cells: i) Neo3 cells
were 1.13±0.02-fold more resistant to paraquat; and ii) Neo2 cells
were 1.53±0.06-fold more resistant to 4-hydroxynonenol.
| Table VI.Oxidant sensitivity in the WEHI7.2
cells and WEHI7.2 variants as measured by EC50
values. |
Table VI.
Oxidant sensitivity in the WEHI7.2
cells and WEHI7.2 variants as measured by EC50
values.
| Cell variant |
H2O2 (μM) | Paraquat (μM) | 4-hydroxynonenol
(μM) | Tert-butyl
hydroperoxide (μM) |
|---|
| WEHI7.2 | 105.37±2.94 | 32.73±6.68 | 12.67±1.23 | 0.939±0.045 |
| CAT2 |
201.08±12.99a | 84.38±5.90a | 9.97±0.57 | 1.433±0.062a |
| CAT38 |
348.58±4.48a,b |
418.77±44.50a,b |
16.90±1.58a,b | 1.143±0.009b |
| 200R |
1,049.26±9.83a | 77.00±8.96a | 20.33±0.83a | 1.098±0.068 |
Enhanced anti-oxidant defenses increase
resistance to multiple lymphoma chemotherapeutics
The oxidative stress-resistant variants showed
increased resistance to H2O2 and
O2•− concomitant with increased GST activity.
Based on this profile, we predicted that the oxidative
stress-resistant cells would be resistant to lymphoma drugs that
depend on ROS generation for cell death or are detoxified via
GST-dependent mechanisms.
To assess the relative resistance of the WEHI7.2
variants and WEHI7.2 parental cells to lymphoma chemotherapeutics,
we measured the response to cyclophosphamide, vincristine,
doxorubicin and glucocorticoids, all components of standard
lymphoma therapy (32). Previous
studies indicate that glucocorticoids and doxorubicin increase ROS
in lymphoid cells (15,33); doxorubicin, vincristine and
cyclophosphamide are all detoxified by GST-dependent mechanisms
(34–38). As shown by the EC50
measurements in Table VII, the
CAT2 and CAT38 cells were more resistant to cyclophosphamide,
doxorubicin and vincristine than the WEHI7.2 cells (p≤0.05). The
200R cells were more resistant than the WEHI7.2 cells to
cyclophosphamide, as indicated by the higher EC50. Using
the EC50 as a measure, the 200R cells were not more
resistant to doxorubicin or vincristine. However, the
EC90 measurements for both doxorubicin and vincristine
indicated that the 200R cells were more resistant to both these
drugs than the WEHI7.2 cells (p≤0.05). To assess dexamethasone
resistance, we tested for a delay or prevention of apoptosis after
treatment of the cells with 1 μM dexamethasone, the concentration
of dexamethasone required to saturate the receptors (8,9). As
shown in Table VII, the variants
had decreased apoptosis 24 h after the addition of dexamethasone
indicating a decreased dexamethasone sensitivity. The vector
only-transfected cells were not more resistant to any of the
chemotherapeutics (data not shown). These data indicate that
increasing the oxidative stress resistance in the WEHI7.2 cells
resulted in chemoresistance to multiple lymphoma chemotherapeutic
drugs.
| Table VII.Sensitivity of the WEHI7.2 cells and
WEHI7.2 variants to lymphoma chemotherapeutics. |
Table VII.
Sensitivity of the WEHI7.2 cells and
WEHI7.2 variants to lymphoma chemotherapeutics.
| Cell variant | Cyclophosphamide
EC50 (mM)a | Doxorubicin
EC50 (nM)a | Doxorubicin
EC90 (nM)a | Vincristine
EC50 (nM)a | Vincristine
EC90 (nM)a | Dexamethasone
(apoptosis %)b |
|---|
| WEHI7.2 | 1.82±0.03 | 8.60±0.58 | 23.74±0.65 | 2.37±0.17 | 4.26±0.34 | 21.73±1.03 |
| CAT2 | 9.04±0.39c | 13.80±0.96c | N.D. | 6.04±0.42c | 10.75±1.04c | 0.29±0.09c |
| CAT38 | 7.69±0.07c |
27.28±2.93c,d | 37.19±1.62c | 6.06±0.79c |
24.45±0.13c,d | 1.08±0.45c |
| 200R | 5.71±0.18c | 11.40±1.11 | 28.66±0.72c | 9.01±3.90 | 48.43±3.53c | 10.75±0.61c |
Discussion
The data presented here suggest that lymphomas that
are derived from sites of chronic inflammation acquire a
chemoresistant phenotype resulting from enhanced anti-oxidant
defenses. The variants with increased catalase, via transfection or
selecting for H2O2 resistance, had widespread
resistance to the chemotherapy agents we tested. One possible
explanation is that increased H2O2 removal is
universally protective. However, none of the variants were
resistant to all of the oxidants we tested. This suggests that
increased H2O2 removal is unlikely to be the
sole mechanism of resistance. A second possibility is that an
increase in catalase upregulates pathways responsible for a more
generalized drug resistance. We did not see an increase in
anti-apoptotic Bcl-2 family members or a decrease in pro-apoptotic
Bcl-2 family members that could explain a generalized drug
resistant phenotype (unpublished data). However, in addition to the
increased catalase activity, the variants had an altered redox
environment with concomitant increases in SOD activity and the
phase 2 enzymes GST and NQO1. In other model systems, these enzymes
cause drug resistance (26). Our
data indicate that altering catalase modulates multiple redox
responsive pathways, including ones that detoxify drugs by
H2O2-independent mechanisms. This could
account for a more generalized resistance than would be predicted
by H2O2 removal alone.
For the chemotherapeutics we tested, both an
increase in the ability to detoxify ROS directly and elevated phase
2 enzymes likely play a role in resistance. Direct removal of ROS
may play a role in the resistance to glucocorticoids and
doxorubicin, since treatment with each of these agents increases
ROS production (15,33). There is considerable evidence that
the addition of chemical or enzymatic anti-oxidants, or preventing
ROS generation after glucocorticoid treatment, protects lymphoid
cells from glucocorticoid-induced apoptosis (9,15,39).
Doxorubicin treatment increases intracellular ROS in lymphoid cells
(33), most likely due to its
ability to redox cycle in the cell to produce superoxide (40). However, doxorubicin has multiple
cellular effects (41). Although
the poisoning of topoisomerase II is often considered the most
clinically relevant, the relative contributions of individual
doxorubicin effects, including ROS generation, is not clear
(41–43). Direct ROS removal is unlikely to
play a role in the resistance to cyclophosphamide, a DNA
strand-crosslinking agent (44),
or vincristine, a microtubule polymerization inhibitor (33,45).
Treatment of lymphoid cells with these drugs has not been connected
with an increase in ROS (33,44).
The increase in GSTμ and π in the WEHI7.2 variants
likely contributed to the observed chemoresistant phenotype. These
GST isozymes detoxify neoplastic agents by conjugating GSH to them
to facilitate their export (26,27).
Although GSH was lower in the CAT2, CAT38 and 200R cells than in
the WEHI7.2 parental cells, there may still have been enough GSH
present for these enzymes to function. Increases in GSTμ and/or π
have been shown to decrease the toxicity of cyclophosphamide
(34,35), doxorubicin (36,37)
and vincristine (36,38). GSTs also inhibit apoptosis due to
multiple agents via regulation of the MAP kinase pathway. GSTπ
binds to and inhibits the activity of c-Jun N-terminal kinase
(JNK1) (46,47). JNK1 activation has been implicated
in the cytotoxicity mechanism of doxorubicin and vincristine
(47). Increases in GSTμ also
inhibit activation of p38-MAPK and Bim which are important for
glucocorticoid-induced apoptosis (48).
The H2O2-resistant 200R cells
most closely model a cell population that would be found at the
site of chronic infection/inflammation, with the
catalase-overexpressing clones useful as proof of principle. A
critical examination of the data suggests that the 200R cells
appear less resistant to many drugs than the other WEHI7.2
variants. This is deceptive because for most of the drugs and
oxidants there is a small population of cells that shows much
greater resistance. We have noted this phenomenon in response to
other agents (8,14). Thus, an EC50 measurement
may not always reflect this response. The vincristine response is a
good example of this phenomenon. The EC50 for the 200R
cells did not differ much from that in the WEHI7.2 cells. However,
the EC90 was very high compared to both the
EC50 in the 200R cells and the EC90 in the
WEHI7.2 cells. Drug treatment in the clinic may select for the
resistant population, posing a significant barrier to successful
treatment.
Taken together, these data indicate that
upregulation of anti-oxidant defenses by chronic ROS exposure or by
transfection results in cells with a chemoresistant phenotype. Our
data show that modulation of one anti-oxidant defense enzyme or
selection for oxidant resistance causes coordinate changes in the
web of redox-sensitive molecules. These data serve as a cautionary
tale for studies that make the assumption that if catalase is
increased by transfection, and the resultant cells are resistant to
a particular drug, the mechanism of cell death must depend on
hydrogen peroxide. This study suggests one mechanism by which the
development of oxidative stress resistance contributes to a general
chemoresistant phenotype. Multiple mechanisms probably exist.
Although we do not have an explanation for the mechanism by which
increased H2O2 resistance (or increased
catalase) causes all the redox alterations we observed in the
WEHI7.2 variants, the resulting chemoresistant phenotype has
potential clinical consequences. Successful treatment of lymphomas
arising at the site of chronic inflammation must take into account
the multiple alterations likely to have occurred in the lymphoma
cells.
Abbreviations:
|
200R
|
WEHI7.2 cells selected for resistance
to 200 μM H2O2;
|
|
CAT2
|
WEHI7.2 cells expressing 2-fold
parental cell catalase;
|
|
CAT38
|
WEHI7.2 cells expressing 1.4-fold
parental cell catalase;
|
|
cDCFH-DA/cDCFH
|
5-(and-6)-carboxy-2′7′dichlorofluorescein diacetate;
|
|
DCFH-DA/DCF
|
2′7′dichlorodihydrofluorescein
diacetate/2′7′dichlorofluorescein;
|
|
DPIP
|
2,6-dichlorophenol-indophenol;
|
|
Eh
|
redox potential;
|
|
G6PDH
|
glucose 6-phosphate
dehydrogenase;
|
|
GPX1
|
glutathione peroxidase 1;
|
|
GSH
|
glutathione;
|
|
GSSG
|
glutathione disulfide;
|
|
GST
|
glutathione S-transferase;
|
|
H2O2
|
hydrogen peroxide;
|
|
JNK1
|
c-Jun N-terminal kinase;
|
|
NQO1
|
NAD(P) H:quinone oxidoreductase,
DT-diaphorase;
|
|
O2•−
|
superoxide;
|
|
PBS
|
phosphate-buffered saline;
|
|
ROS
|
reactive oxygen species;
|
|
SOD
|
superoxide dismutase
|
Acknowledgements
The authors thank Krispy Sofkie and
Mandy Wilson for the technical assistance; Debbie Sakeistewa for
the flow cytometry expertise; Margareta Berggren for the
peroxiredoxin cDNAs; David Stringer for the use of critical
equipment; and Dr Melba Jaramillo for the critical discussion of
the manuscript. Funding for this study comes from the National
Cancer Institute (CA 71768) to M.M.B., (CA 17094) to R.T.D. and (CA
43894, CA 106677, CA 99469) to E.L.J.; and The Department of
Pathology (University of Arizona) to M.M.B. and M.E.T.. M.E.T. was
partially supported by a T-32 traineeship from the N.C.I. (CA
09213) and E.L.J. was partially supported by CA 27502. Portions of
this study were supported by the Arizona Cancer Center Core grant
(CA 23074) and the Southwest Environmental Health Sciences Center
Core grant (ES 06694).
References
|
1.
|
Tavani A, La Vecchia C, Franceschi S,
Serraino D and Carbone A: Medical history and risk of Hodgkin’s and
non-Hodgkin’s lymphomas. Eur J Cancer Prev. 9:59–64. 2000.
|
|
2.
|
Jaffe ES, Harris NL, Stein H and Vardiman
JW: World Health Organization Classification of Tumours: Pathology
and Genetics of Tumours of Haematopoietic and Lymphoid Tissues.
IARC Press; Lyon: 2001
|
|
3.
|
Young LS and Rickinson AB: Epstein-Barr
virus: 40 years on. Nat Rev Cancer. 4:757–768. 2004.PubMed/NCBI
|
|
4.
|
Ramos-Casals M, De Vita S and Tzioufas AG:
Hepatitis C virus, Sjogren’s syndrome and B-cell lymphoma: linking
infection, autoimmunity and cancer. Autoimmun Rev. 4:8–15.
2005.
|
|
5.
|
Gualandi G, Giselico L, Carloni M, Palitti
F, Mosesso P and Alfonsi AM: Enhancement of genetic instability in
human B cells by Epstein-Barr virus latent infection. Mutagenesis.
16:203–208. 2001. View Article : Google Scholar : PubMed/NCBI
|
|
6.
|
Spitz DR, Li GC, McCormick ML, Sun Y and
Oberley LW: Stable H2O2-resistant variants of
Chinese hamster fibroblasts demonstrate increases in catalase
activity. Radiat Res. 114:114–124. 1988.
|
|
7.
|
Cantoni O, Guidarelli A, Sestili P,
Mannello F, Gazzanelli G and Cattabeni F: Development and
characterization of hydrogen peroxide-resistant Chinese hamster
ovary cell variants. I. Relationship between catalase activity and
the induction/stability of the oxidant-resistant phenotype. Biochem
Pharmacol. 45:2251–2257. 1993. View Article : Google Scholar
|
|
8.
|
Tome ME and Briehl MM: Thymocytes selected
for resistance to hydrogen peroxide show altered antioxidant enzyme
profiles and resistance to dexamethasone-induced apoptosis. Cell
Death Differ. 8:953–961. 2001. View Article : Google Scholar : PubMed/NCBI
|
|
9.
|
Tome ME, Baker AF, Powis G, Payne CM and
Briehl MM: Catalase-overexpressing thymocytes are resistant to
glucocorticoid-induced apoptosis and exhibit increased net tumor
growth. Cancer Res. 61:2766–2773. 2001.PubMed/NCBI
|
|
10.
|
Harris AW, Bankhurst AD, Mason S and
Warner NL: Differentiated functions expressed by cultured mouse
lymphoma cells. II. Theta antigen, surface immunoglobulin and a
receptor for antibody on cells of a thymoma cell line. J Immunol.
110:431–438. 1973.
|
|
11.
|
Carlberg I and Mannervik B: Glutathione
reductase. Methods Enzymol. 113:484–490. 1985. View Article : Google Scholar
|
|
12.
|
Ernster L: DT diaphorase. Methods Enzymol.
10:309–317. 1967. View Article : Google Scholar
|
|
13.
|
Tome ME, Johnson DBF, Samulitis BK, Dorr
RT and Briehl MM: Glucose 6-phosphate dehydrogenase overexpression
models glucose deprivation and sensitizes lymphoma cells to
apoptosis. Antioxid Redox Signal. 8:1315–1327. 2006. View Article : Google Scholar : PubMed/NCBI
|
|
14.
|
Efferth T, Briehl MM and Tome ME: Role of
antioxidant genes for the activity of artesunate against tumor
cells. Int J Oncol. 23:1231–1235. 2003.PubMed/NCBI
|
|
15.
|
Tome ME, Jaramillo MC and Briehl MM:
Hydrogen peroxide signaling is required for glucocorticoid-induced
apoptosis in lymphoma cells. Free Radic Biol Med. 51:2048–2059.
2011. View Article : Google Scholar : PubMed/NCBI
|
|
16.
|
Jones DP, Carlson JL, Samiec PS, Sternberg
P Jr, Mody VC Jr, Reed RL and Brown LA: Glutathione measurement in
human plasma. Evaluation of sample collection, storage and
derivatization conditions for analysis of dansyl derivatives by
HPLC. Clin Chim Acta. 275:175–184. 1998.PubMed/NCBI
|
|
17.
|
Jacobson EL and Jacobson MK: Tissue NAD as
a biochemical measure of niacin status in humans. Methods Enzymol.
280:221–230. 1997. View Article : Google Scholar : PubMed/NCBI
|
|
18.
|
Jones DP: Redox potential of GSH/GSSG
couple: assay and biological significance. Methods Enzymol.
348:93–112. 2002. View Article : Google Scholar : PubMed/NCBI
|
|
19.
|
Li JJ, Oberley LW, St Clair DK, Ridnour LA
and Oberley TD: Phenotypic changes induced in human breast cancer
cells by overexpression of manganese-containing superoxide
dismutase. Oncogene. 10:1989–2000. 1995.PubMed/NCBI
|
|
20.
|
Moore DS and McCabe GP: Introduction to
the Practice of Statistics. 4th edition. W.H. Freeman & Co.;
New York: 2003
|
|
21.
|
Myers JL and Well AD: Research Design and
Statistical Analysis. 2nd edition. Lawrence Erlbaum Associates;
Mahwah, NJ: 2003
|
|
22.
|
Schafer FQ and Buettner GR: Redox
environment of the cell as viewed through the redox state of the
glutathione disulfide/glutathione couple. Free Radic Biol Med.
30:1191–1212. 2001. View Article : Google Scholar : PubMed/NCBI
|
|
23.
|
Kirlin WG, Cai J, Thompson SA, Diaz D,
Kavanagh TJ and Jones DP: Glutathione redox potential in response
to differentiation and enzyme inducers. Free Radic Biol Med.
27:1208–1218. 1999. View Article : Google Scholar : PubMed/NCBI
|
|
24.
|
Kirkman HN and Gaetani GF: Catalase: a
tetrameric enzyme with four tightly bound molecules of NADPH. Proc
Natl Acad Sci USA. 81:4343–4347. 1984. View Article : Google Scholar : PubMed/NCBI
|
|
25.
|
Go YM, Gipp JJ, Mulcahy RT and Jones DP:
H2O2-dependent activation of GCLC-ARE4
reporter occurs by mitogen-activated protein kinase pathways
without oxidation of cellular glutathione or thioredoxin-1. J Biol
Chem. 279:5837–5845. 2004.
|
|
26.
|
Talalay P: Chemoprotection against cancer
by induction of phase 2 enzymes. Biofactors. 12:5–11. 2000.
View Article : Google Scholar
|
|
27.
|
Hayes JD and Pulford DJ: The glutathione
S-transferase supergene family: regulation of GST and the
contribution of the isoenzymes to cancer chemoprotection and drug
resistance. Crit Rev Biochem Mol Biol. 30:445–600. 1995. View Article : Google Scholar : PubMed/NCBI
|
|
28.
|
Ahmad IM, Aykin-Burns N, Sim JE, et al:
Mitochondrial O2•− and
H2O2 mediate glucose deprivation-induced
stress in human cancer cells. J Biol Chem. 280:4254–4263.
2005.PubMed/NCBI
|
|
29.
|
Krall J, Bagley AC, Mullenbach GT,
Hallewell RA and Lynch RE: Superoxide mediates the toxicity of
paraquat for cultured mammalian cells. J Biol Chem. 263:1910–1914.
1988.PubMed/NCBI
|
|
30.
|
Esterbauer H, Schaur RJ and Zollner H:
Chemistry and biochemistry of 4-hydroxynonenal, malonaldehyde and
related aldehydes. Free Radic Biol Med. 11:81–128. 1991. View Article : Google Scholar : PubMed/NCBI
|
|
31.
|
Jewell SA, Di Monte D, Richelmi P, Bellomo
G and Orrenius S: tert-Butylhydroperoxide-induced toxicity in
isolated hepatocytes: contribution of thiol oxidation and lipid
peroxidation. J Biochem Toxicol. 1:13–22. 1986. View Article : Google Scholar : PubMed/NCBI
|
|
32.
|
Perry MC, Anderson CM, Dorr VJ and Wilkes
JD: Companion Handbook to the Chemotherapy Source Book. Lippincott,
Williams & Wilkins; New York: 1999
|
|
33.
|
Kamio T, Toki T, Kanezaki R, et al:
B-cell-specific transcription factor BACH2 modifies the cytotoxic
effects of anticancer drugs. Blood. 102:3317–3322. 2003. View Article : Google Scholar : PubMed/NCBI
|
|
34.
|
Matsunaga T, Sakamaki S, Kuga T, et al:
GST-pi gene-transduced hematopoietic progenitor cell
transplantation overcomes the bone marrow toxicity of
cyclophosphamide in mice. Hum Gene Ther. 11:1671–1681. 2000.
View Article : Google Scholar : PubMed/NCBI
|
|
35.
|
McGown AT and Fox BW: A proposed mechanism
of resistance to cyclophosphamide and phosphoramide mustard in a
Yoshida cell line in vitro. Cancer Chemother Pharmacol. 17:223–226.
1986. View Article : Google Scholar : PubMed/NCBI
|
|
36.
|
O’Brien M, Kruh GD and Tew KD: The
influence of coordinate overexpression of glutathione phase II
detoxification gene products on drug resistance. J Pharmacol Exp
Ther. 294:480–487. 2000.PubMed/NCBI
|
|
37.
|
Harbottle A, Daly AK, Atherton K and
Campbell FC: Role of glutathione S-transferase P1, P-glycoprotein
and multidrug resistance-associated protein 1 in acquired
doxorubicin resistance. Int J Cancer. 92:777–783. 2001. View Article : Google Scholar : PubMed/NCBI
|
|
38.
|
Depeille P, Cuq P, Mary S, Passagne I,
Evrard A, Cupissol D and Vian L: Glutathione S-transferase M1 and
multidrug resistance protein 1 act in synergy to protect melanoma
cells from vincristine effects. Mol Pharmacol. 65:897–905. 2004.
View Article : Google Scholar : PubMed/NCBI
|
|
39.
|
Tonomura N, McLaughlin K, Grimm L, Goldsby
RA and Osborne BA: Glucocorticoid-induced apoptosis of thymocytes:
requirement of proteasome-dependent mitochondrial activity. J
Immunol. 170:2469–2478. 2003. View Article : Google Scholar : PubMed/NCBI
|
|
40.
|
Davies KJ: Oxidative stress: the paradox
of aerobic life. Biochem Soc Symp. 61:1–31. 1995.PubMed/NCBI
|
|
41.
|
Gewirtz DA: A critical evaluation of the
mechanisms of action proposed for the antitumor effects of the
anthracycline antibiotics adriamycin and daunorubicin. Biochem
Pharmacol. 57:727–741. 1999. View Article : Google Scholar : PubMed/NCBI
|
|
42.
|
Trevino AV, Woynarowska BA, Herman TS,
Priebe W and Woynarowski JM: Enhanced topoisomerase II targeting by
annamycin and related 4-demethoxy anthracycline analogues. Mol
Cancer Ther. 3:1403–1410. 2004.PubMed/NCBI
|
|
43.
|
Shacter E, Williams JA, Hinson RM,
Senturker S and Lee YJ: Oxidative stress interferes with cancer
chemotherapy: inhibition of lymphoma cell apoptosis and
phagocytosis. Blood. 96:307–313. 2000.PubMed/NCBI
|
|
44.
|
Murata M, Suzuki T, Midorikawa K, Oikawa S
and Kawanishi S: Oxidative DNA damage induced by a hydroperoxide
derivative of cyclophosphamide. Free Radic Biol Med. 37:793–802.
2004. View Article : Google Scholar : PubMed/NCBI
|
|
45.
|
Huang Y, Fang Y, Wu J, Dziadyk JM, Zhu X,
Sui M and Fan W: Regulation of Vinca alkaloid-induced apoptosis by
NF-kappaB/IkappaB pathway in human tumor cells. Mol Cancer Ther.
3:271–277. 2004.PubMed/NCBI
|
|
46.
|
Adler V, Yin Z, Fuchs SY, et al:
Regulation of JNK signaling by GSTp. EMBO J. 18:1321–1334. 1999.
View Article : Google Scholar : PubMed/NCBI
|
|
47.
|
Townsend DM and Tew KD: The role of
glutathione-S-transferase in anti-cancer drug resistance. Oncogene.
22:7369–7375. 2003. View Article : Google Scholar : PubMed/NCBI
|
|
48.
|
Hosono N, Kishi S, Iho S, et al:
Glutathione S-transferase M1 inhibits dexamethasone-induced
apoptosis in association with the suppression of Bim through dual
mechanisms in a lymphoblastic leukemia cell line. Cancer Sci.
101:767–773. 2010. View Article : Google Scholar : PubMed/NCBI
|