Introduction
Although polycythemia does not occur frequently in
renal cell carcinoma (RCC) patients, erythropoietin (EPO) has been
reported to be produced by tumor cells in the kidneys of
polycythemic RCC patients (1), and
EPO expression in RCC cells has also been demonstrated in
vitro (2). Various types of
human cancer cells have recently been found to express EPO, and EPO
signaling has been suggested to be important in proliferation,
invasion and angiogenesis (3).
Although RCC rarely produces enough EPO to cause polycythemia, it
is possible that EPO produced by RCC cells stimulates their
aggressive behavior by acting on an autocrine and paracrine loop.
Hypoxia-inducible factor (HIF) is often upregulated in RCC cells
and EPO is one of the downstream gene products of HIF. sEPO levels
are elevated in certain patients with RCC. This elevation is
correlated with tumor stage and histopathological grade, and
provides prognostic information (4). In a recent study, the positive
cytoplasmic expression of EPO in surgical specimens was revealed to
be associated with a poor prognosis for RCC patients (5).
RCC cells may become more sensitive to extracellular
EPO if its receptor (EpoR) expression is upregulated. Increased
EpoR expression in surgical specimens is associated with worse
pathology and poorer prognosis in lung cancer (6) and endometrial carcinoma (7). EPO-EpoR signaling activates the
JAK-STAT pathway in head and neck squamous cell carcinomas
(8), and EPO activates the
ERK/MAPK pathway in MCF-7 breast cancer cells (9) and stimulates RAF-1 tyrosine
phosphorylation in erythroleukemic cells (10). Coexpression of EPO and EpoR was
detected by RT-PCR in 92.6% of the surgical specimens removed from
clear cell RCC patients regardless of VHL mutation status (11), and marked EpoR expression has been
reported to indicate poor prognosis for RCC patients (12). EPO-EpoR signaling also stimulates
proliferation in RCC cells in vitro (2), therefore it appears that EPO-EpoR
signaling may be imporant in RCC biology.
The present study was undertaken to evaluate the
impact of increased EpoR expression by immunohistochemistry on the
clinicopathological features and prognosis of RCC patients. Also to
evaluate the impact of elevated sEPO levels on clinicopathological
features and prognosis, and determine whether the combination of
EpoR expression level and sEPO level can improve the accuracy with
which clinical outcome can be predicted. In addition we also aimed
to determine factors influencing the level of sEPO.
Patients and methods
Patients
We evaluated patients who underwent surgical removal
of RCC at the National Defense Medical College, Tokorozawa,
Saitama, Japan, between 1994 and 2006, in order to determine
clinicopathological factors from clinical records and pathological
reports. Paraffin-embedded sections were prepared from surgical
specimens removed from 54 patients who underwent radical
nephrectomy (RN) and 2 who underwent partial nephrectomy (PN).
Follow-up intervals for the 56 patients ranged from 1 to 162 months
(median, 62.3 months). Paraffin-embedded sections of 5 metastatic
lesions (2 in lymph nodes, 1 in the adrenal gland, 1 subcutaneous
and 1 in the pancreas) from 5 different patients were also
prepared. sEPO levels were available for 138 patients (121 patients
underwent RN and 17 underwent PN), and EpoR expression was
determined in surgical specimens removed from 47 of the 138
patients. All serum samples were obtained within a week prior to
nephrectomy. Follow-up intervals for the 138 patients ranged from 1
to 129 months (median, 22.3 months). All patients were
postoperatively evaluated for local recurrence and metastasis every
3 to 6 months for the first 5 years and every 6 to 12 months after.
Follow-up examinations consisted of physical examination, chest
radiography, abdominal and chest CT, blood tests and, if indicated,
radionuclide bone scanning. The pathological stage was determined
according to the 2002 TNM classification system, and a 3-graded
system was used for nucleolar grading (13). This study was approved by the
institutional review board of the National Defense Medical College,
Tokorozawa, Saitama, Japan.
Immunohistochemical analysis for EpoR in
paraffin-embedded tissues
The clinicopathological factors of the 56 patients
whose surgical specimens were evaluated in this study are listed in
Table I. The patients included 40
males and 16 females between 36 and 78 years of age (median, 61).
The median follow-up interval was 62 months (range, 1 to 162).
Twenty patients underwent right nephrectomy and 36 patients
underwent left nephrectomy. The size of the primary tumor was
6.7±4.1 cm (range, 1.3–20; median 6.3). The predominant
histological type was clear cell type in 54 tumors and papillary
type in 2. The paraffin-embedded sections contained both tumor and
surrounding kidney tissue. Immunohistochemistry was performed as
previously described (14).
Briefly, paraffin-embedded sections were deparaffinized. Slides
were placed in Dako Target Retrieval Solution (Dako Corp.,
Carpinteria, CA, USA) and heated for antigen retrieval. Endogenous
peroxidase activity was quenched with Dako Peroxidase Blocking
Reagent (Dako Corp.). Sections were incubated in 10% normal goat
serum in phosphate-buffered saline and subsequently incubated
overnight with rabbit polyclonal anti-EpoR antibody (C-20; Santa
Cruz Biotechnology, Santa Cruz, CA, USA). They were then stained
using a Simple Stain Max PO kit (Nichirei Corp., Tokyo, Japan).
Reaction products were visualized by immersing the slides in
diaminobenzidine tetrahydrochloride. The sections were
counterstained with hematoxylin. Tubular epithelial cells, in which
EpoR is known to be abundant (15), served as a positive internal
control. Samples incubated without primary antibody were also
stained using the same method and were used for baseline staining.
Immunostaining results in all tumor sections were evaluated by 2
individuals (K.I. and T.A.) blinded to all clinical and
pathological variables. The staining intensity of each tumor was
compared with that of surrounding proximal tubules. Tumors with a
staining intensity greater than that of the surrounding proximal
tubules (level 2) were defined as tumors with high EpoR expression
(level 3). Those with a staining intensity equal to (level 2) or
less than (level 1) that of proximal tubules were tumors with low
EpoR expression. Staining level was determined by reviewing the
entire slide at ×200 magnification and the dominant level of EpoR
expression in each tumor was determined. The sections from all 56
patients were also immunostained for Ki-67 and CD34. The primary
antibody for Ki-67 (mouse monoclonal; Zymed Laboratories Inc.,
South San Francisco, CA, USA) was used at an appropriate dilution.
Ten high-power fields (HPFs) in each slide were counted by two
independent investigators whose results were averaged. The primary
antibody for CD34 (monoclonal; Santa Cruz Biotechnology) was used
at a dilution of 1:100, and CD34-positive neovessels in 10 HPFs
were counted as previously described (16).
 | Table I.Comparison of the clinicopathological
factors between patients with low and high EpoR expression. |
Table I.
Comparison of the clinicopathological
factors between patients with low and high EpoR expression.
| Low EpoR (n=41) | High EpoR (n=15) | P-value |
|---|
| Male/female | 31/10 | 9/6 | 0.2522a |
| Age (years) | 59.5±11.9 | 60.0±8.5 | 0.9999b |
| Side
(right/left) | 14/27 | 6/9 | 0.6856a |
| Size (cm) | 5.5±3.1 | 9.9±4.7 | 0.0012b |
| pT1 or 2/3 or 4 | 30/11 | 6/9 | 0.0222a |
| N+ | 2 | 3 | 0.0789a |
| M+ | 5 | 6 | 0.0204a |
| Histological grade
3+ | 7 | 9 | 0.0016a |
| MVI+ | 14 | 12 | 0.0023a |
| CRP (mg/dl) | 1.6±2.9 | 4.7±7.0 | 0.0073b |
Measurement of serum EPO levels
EPO levels in duplicate 50-ml serum samples were
measured using an enzyme immunoassay kit (Diagnostic Products
Corporation, Los Angeles, CA, USA) according to the manufacturer’s
instructions.
Statistical analysis
Results are presented as the mean ± standard
deviation. Variables of different groups were compared using the
Mann-Whitney U test. The independence of fit of the categorical
data was analyzed by the Chi-square test. The correlation between
variables was analyzed using Spearman’s rank correlation
coefficients. Survival curves were constructed using the
Kaplan-Meier method, and the differences between them were assessed
using the log-rank test. Cox’s proportional hazard regression model
was used for univariate and multivariate analyses. Logistic
regression analysis was used to identify independent factors
influencing sEPO elevation. P<0.05 was considered to indicate a
statistically significant difference.
Results
Expression of EpoR in RCC and surrounding
tubular epithelium
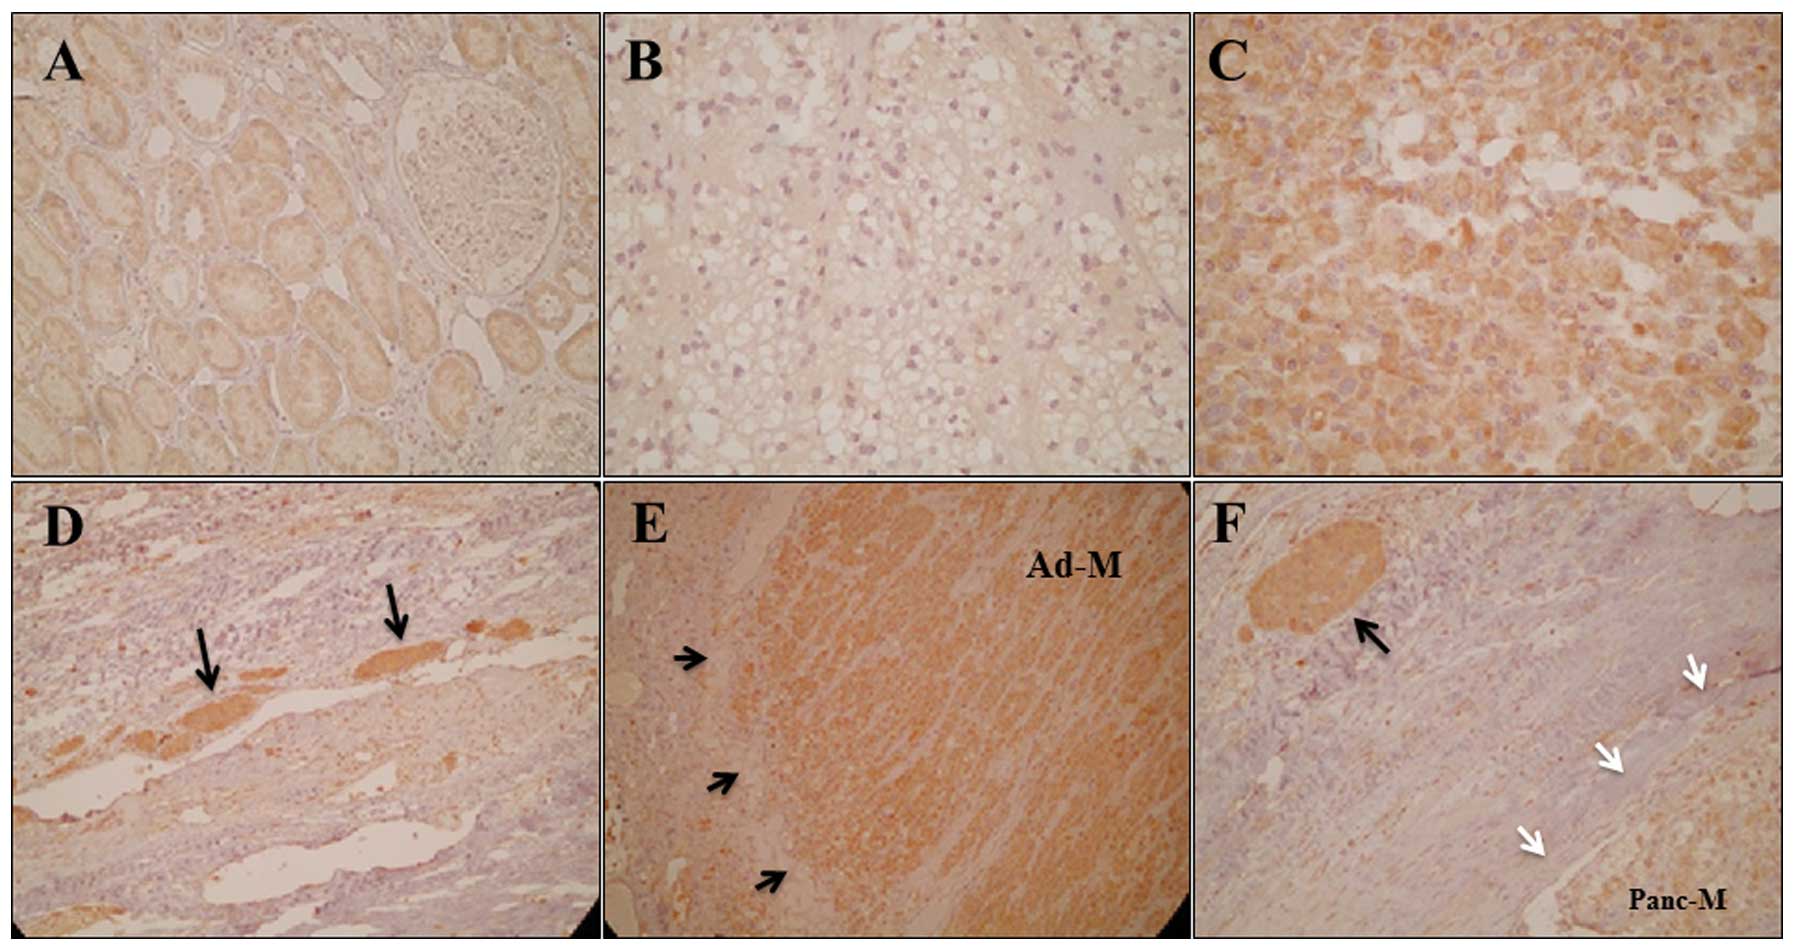
Normal renal tubular epithelium clearly expressed
EpoR, mainly in the cytoplasm (Fig.
1A); this localization of EpoR is consistent with previous
studies (12). EpoR expression in
RCC cells was also observed in the cytoplasm. The expression
intensity was level 1 in 21 tumors (Fig. 1B), level 2 in 20 tumors and level 3
in 15 tumors (Fig. 1C). RCC cell
assemblies in the microvessels surrounding the primary tumors
frequently demonstrated high EpoR expression (Fig. 1D). All five RCC metastases
demonstrated high EpoR expression (level 3) (Fig. 1E). The RCC cell assemblies in the
microvessels surrounding the metastatic lesions demonstrated higher
EpoR expression than the metastatic lesions (Fig. 1F).
Comparison of clinicopathological factors
and survival between patients with low and high EpoR
expression
We compared the clinicopathological factors of 41
patients whose tumors demonstrated low EpoR expression (levels 1
and 2) and 15 patients whose tumors demonstrated high EpoR
expression (level 3) (Table I).
The patients with high EpoR expression had tumors with a
significantly higher pathological T (pT) stage, size and
histological grade than the patients whose tumors had low EpoR
expression, and those patients also had higher C-reactive protein
(CRP) levels and higher percentages of metastatic disease and
microvascular invasion (MVI). Patients whose tumors demonstrated
high EpoR expression had a cause-specific survival (CSS) rate
significantly lower than patients whose tumors demonstrated low
EpoR expression (Fig. 2A). In N0M0
patients (n=41), however, disease-free survival (DFS) did not
differ significantly between those with low EpoR expression and
those with high EpoR expression (Fig.
2B).
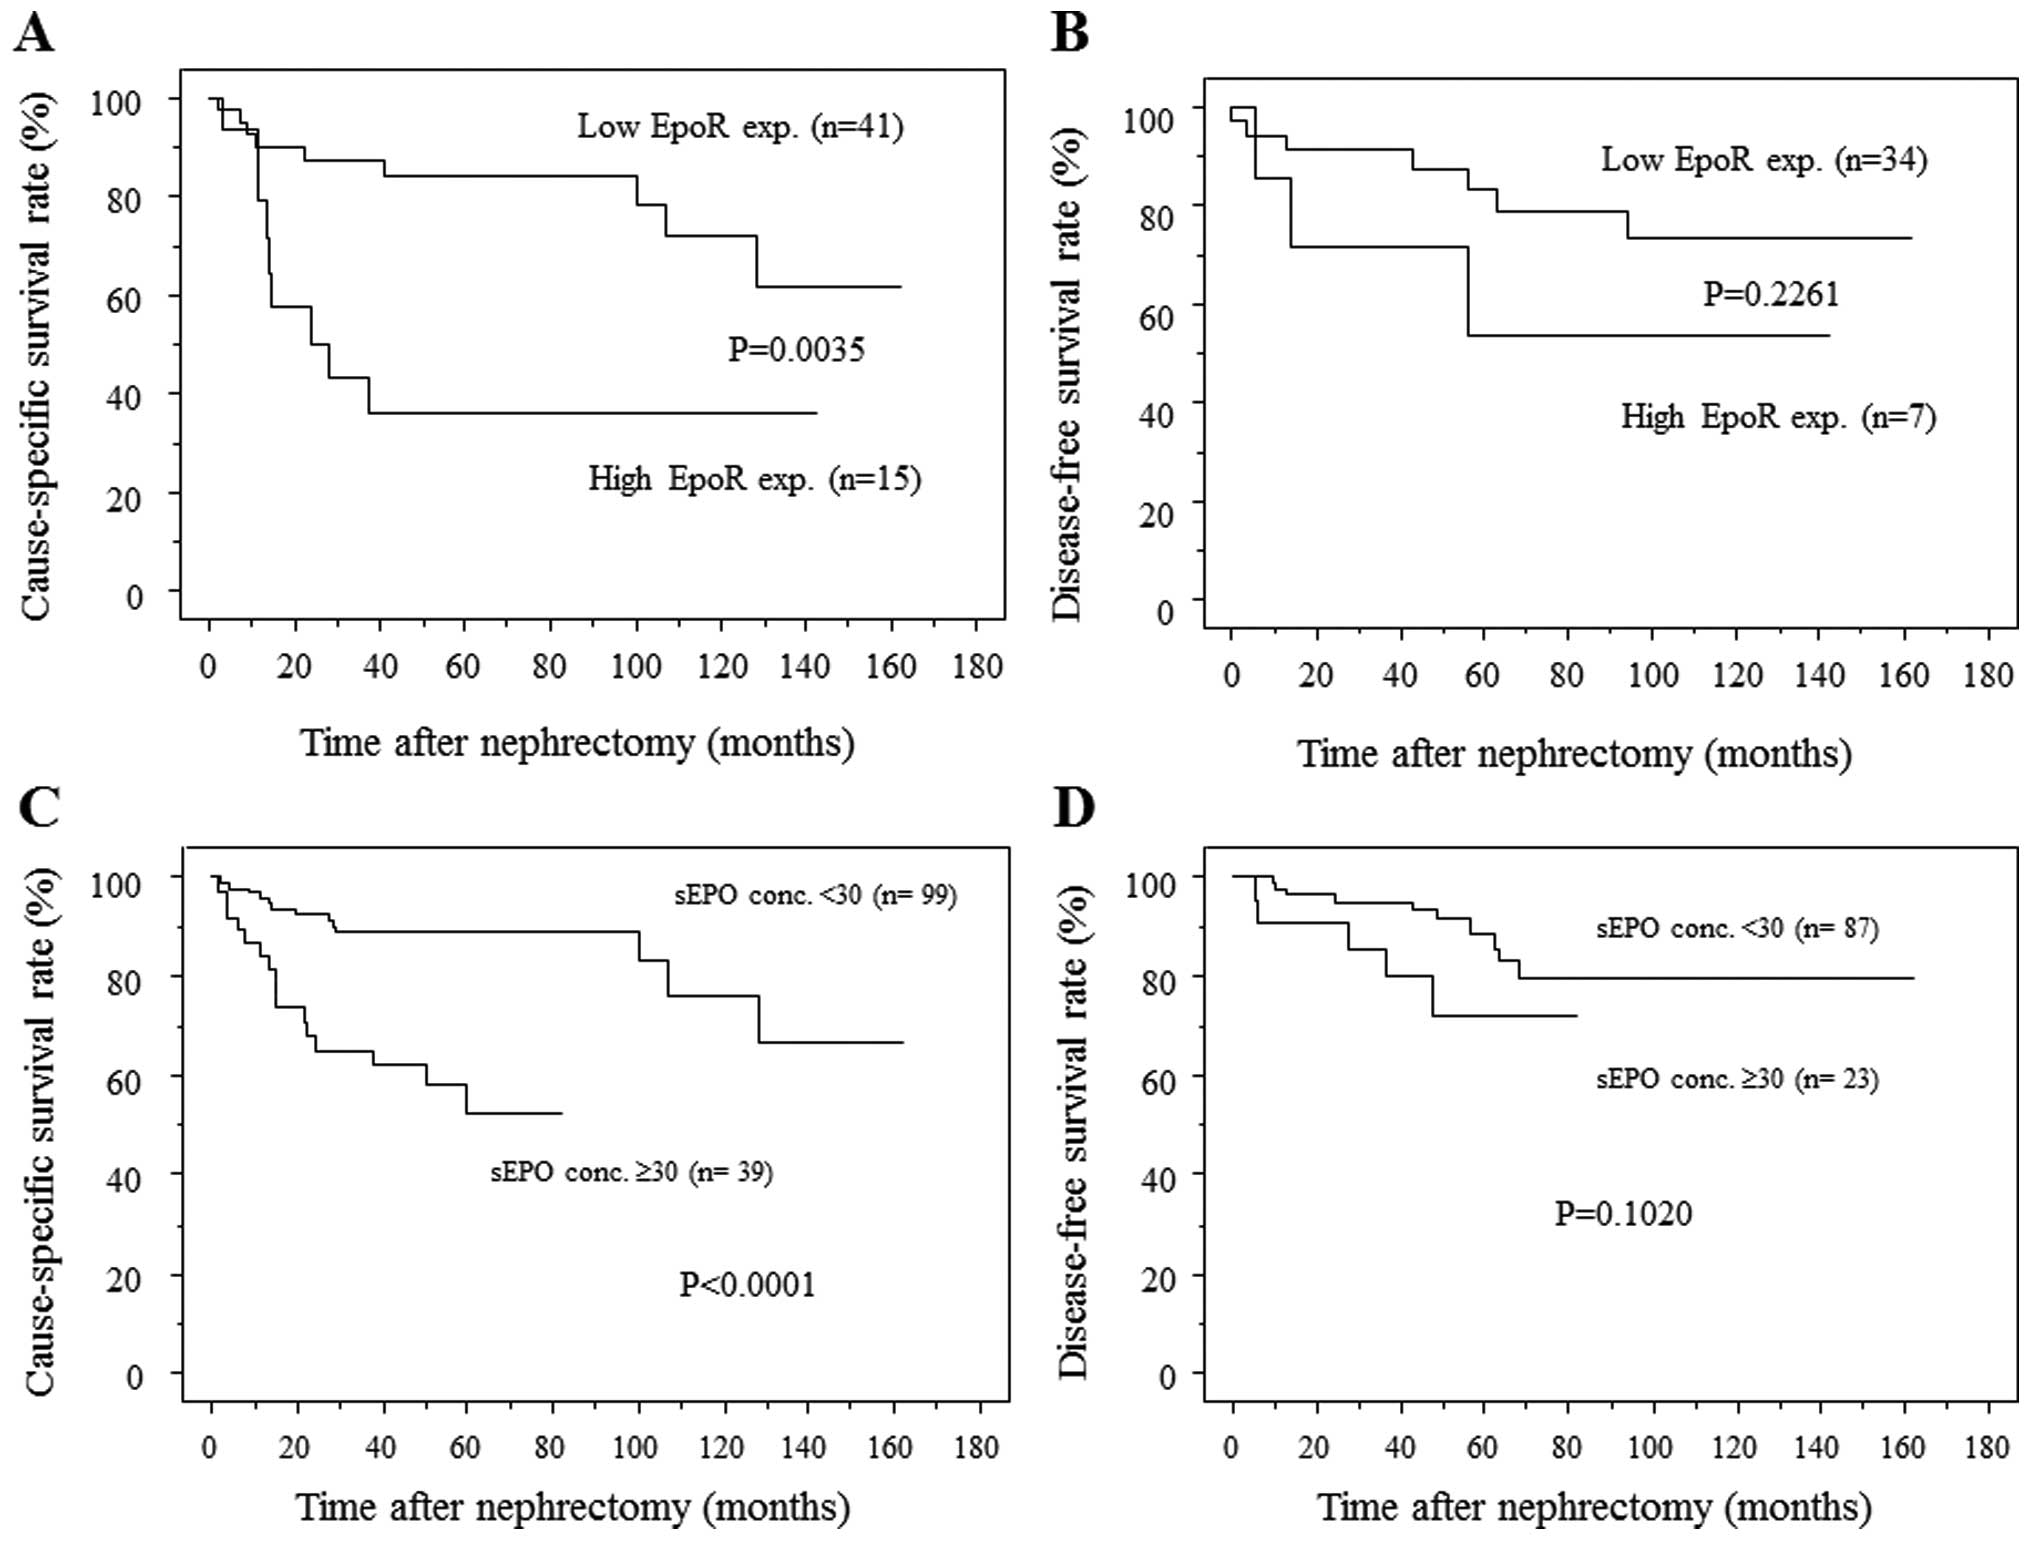 | Figure 2.(A) RCC patients with tumors
demonstrating high EpoR expression had significantly lower survival
rates than those with tumor demonstrating low EpoR expression. The
1-, 3- and 5-year survival rates were 90, 87.3 and 84.2%,
respectively, for patients with tumors demonstrating low EpoR
expression and 79, 43.1 and 35.9%, respectively, for patients with
tumors demonstrating high EpoR expression. (B) In N0M0 patients,
however, DFS did not differ significantly between patients with
tumors demonstrating high EpoR expression than those with low EpoR
expression. (C) Patients with high sEPO levels had significantly
lower rates of CSS than patients with low sEPO levels. The 1-, 3-
and 5-year survival rates of patients with low sEPO levels were
95.8, 89 and 89%, respectively, while those of patients with high
sEPO level were 84.2, 65.2 and 52.4%, respectively. (D) In N0M0
patients there was no significant difference in DFS between those
with low sEPO and those with high sEPO. EpoR, erythropoietin
receptor; RCC, renal cell carcinoma; CSS, cause-specific survival;
DFS, disease-free survival; sEPO, serum erythropoietin. |
Association between EpoR expression level
and proliferation
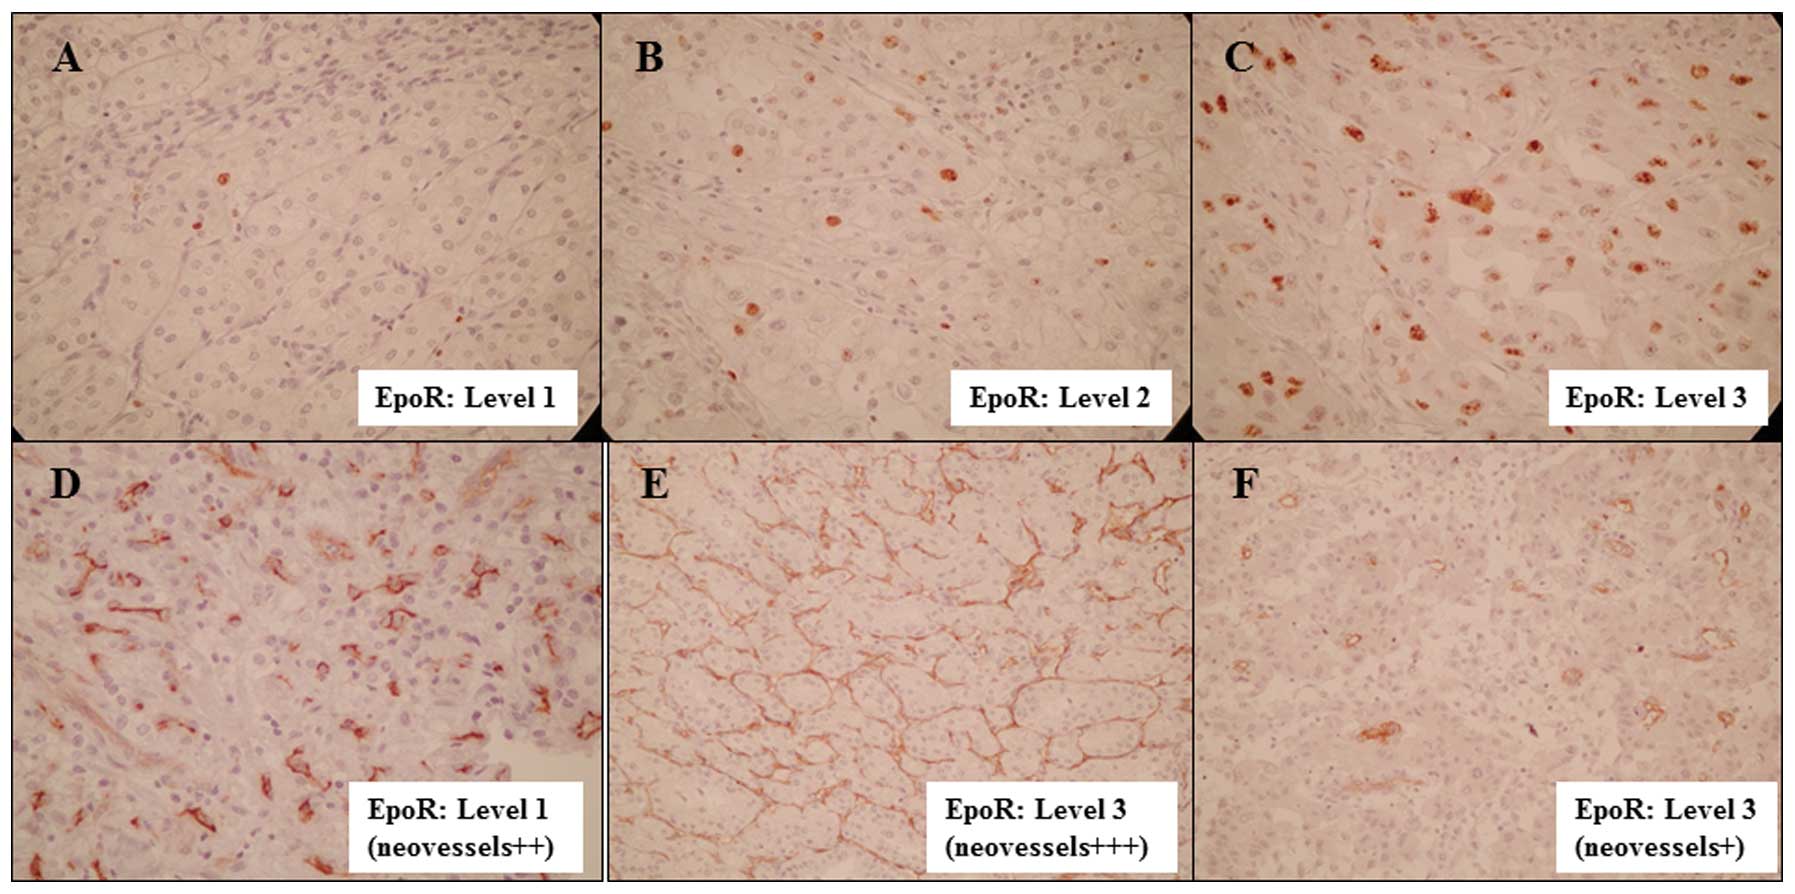
The proliferative status of the cells in each of the
excised tumors was evaluated by Ki-67 immunostaining (Figs. 3A–C). The number of Ki-67-positive
RCC cells per HPF was 7.7±1.0 in level-1, 16.4±2.8 in level-2 and
32.6±5.3 in level-3 tumors. Tumors with higher EpoR expression
levels had significantly larger numbers of Ki-67-positive cells,
suggesting that EpoR expression is associated with the
proliferation of RCC cells.
Association between EpoR expression level
and angiogenesis
Level of angiogenesis was evaluated by CD34
immunostaining. The number of CD34-positive neovessels per HPF was
22.1±2.5 in level-1, 16.6±2.6 in level-2 and 19.2±3.5 in level-3
tumors. RCC specimens with low EpoR expression frequently had a
large number of neovessels (Fig.
3D), and certain specimens with high EpoR expression had a
small number of neovessels (Fig.
3F). There was no correlation between levels of EpoR expression
and the number of CD34-positive neovessels.
Association between EpoR expression
levels and invasiveness
According to a previous study, invasiveness of RCC
was evaluated in terms of pathological growth pattern; infiltrative
or expansive (17). Seven of the
21 tumors with level-1 EpoR expression were infiltrative (33%), 14
of the 20 tumors with level-2 expression were infiltrative, and 10
of the 15 tumors with level-3 expression were infiltrative (67%)
(P=0.0363, Chi-square test). Infiltrative tumors contributed to a
greater percentage of tumors with either level-2 or level-3 EpoR
expression compared to tumors with level 1 EpoR expression.
Therefore, increased EpoR expression appears to be associated with
RCC invasiveness.
Comparison of clinicopathological factors
and survival between patients with low and high sEPO levels
We also compared the clinicopathological factors of
patients with low sEPO levels with those of patients with high sEPO
levels (Table II). Patients with
high sEPO had tumors with a significantly higher pT stage, size and
histological grade, and also had higher CRP levels and higher
percentages of meta-static disease and MVI (P<0.05). Patients
with high sEPO had a significantly lower survival rate than those
with low sEPO (Fig. 2C). The
five-year survival rate for patients with low sEPO was 89%, while
for patients with high sEPO it was 52.4%. In N0M0 patients (n=110),
however, DFS did not differ significantly between those with low
sEPO and those with high sEPO (Fig.
2D).
| Table II.Comparison of the clinocopathological
factors between patients with low and high sEPO levels. |
Table II.
Comparison of the clinocopathological
factors between patients with low and high sEPO levels.
| sEPO <30 mU/ml
(n=99) | sEPO ≥30 mU/ml
(n=39) | P-value |
|---|
| Male/female | 72/27 | 25/14 | 0.3181a |
| Age (years) | 60.5±11.4 | 64.7±10.5 | 0.0531b |
| Side
(right/left) | 44/55 | 15/24 | 0.5224a |
| Size (cm) | 5.1±3.1 | 7.4±4.1 | 0.0004b |
| pT1 or 2/3 or 4 | 84/15 | 21/18 | 0.0001a |
| N+ | 3 (3.0%) | 6 (15.4%) | 0.0081a |
| M+ | 10 (10.1%) | 11 (28.2%) | 0.0081a |
| Histological grade
3+ | 21 (21.2%) | 20 (51.3%) | 0.0005a |
| MVI+ | 27 (27.3%) | 28 (71.8%) | <0.0001a |
| CRP (mg/dl) | 0.9±2.0 | 3.6±5.6 | 0.0010b |
Correlation between EpoR expression and
sEPO levels
Of the 47 patients whose surgical specimens were
evaluated for EpoR expression and whose sEPO levels were measured,
the sEPO level was 17.3±6.4 mU/ml in patients whose tumors
demonstrated level-1 EpoR expression, 26.0±6.4 in patients whose
tumors demonstrated level-2 expression, and 36.2±7.7 in patients
whose tumors demonstrated level-3 expression (P=0.0008, compared to
the level-1 value; P=0.053, compared to the level-2 value). Serum
EPO level increased in proportion to the increase in tissue EpoR
expression level.
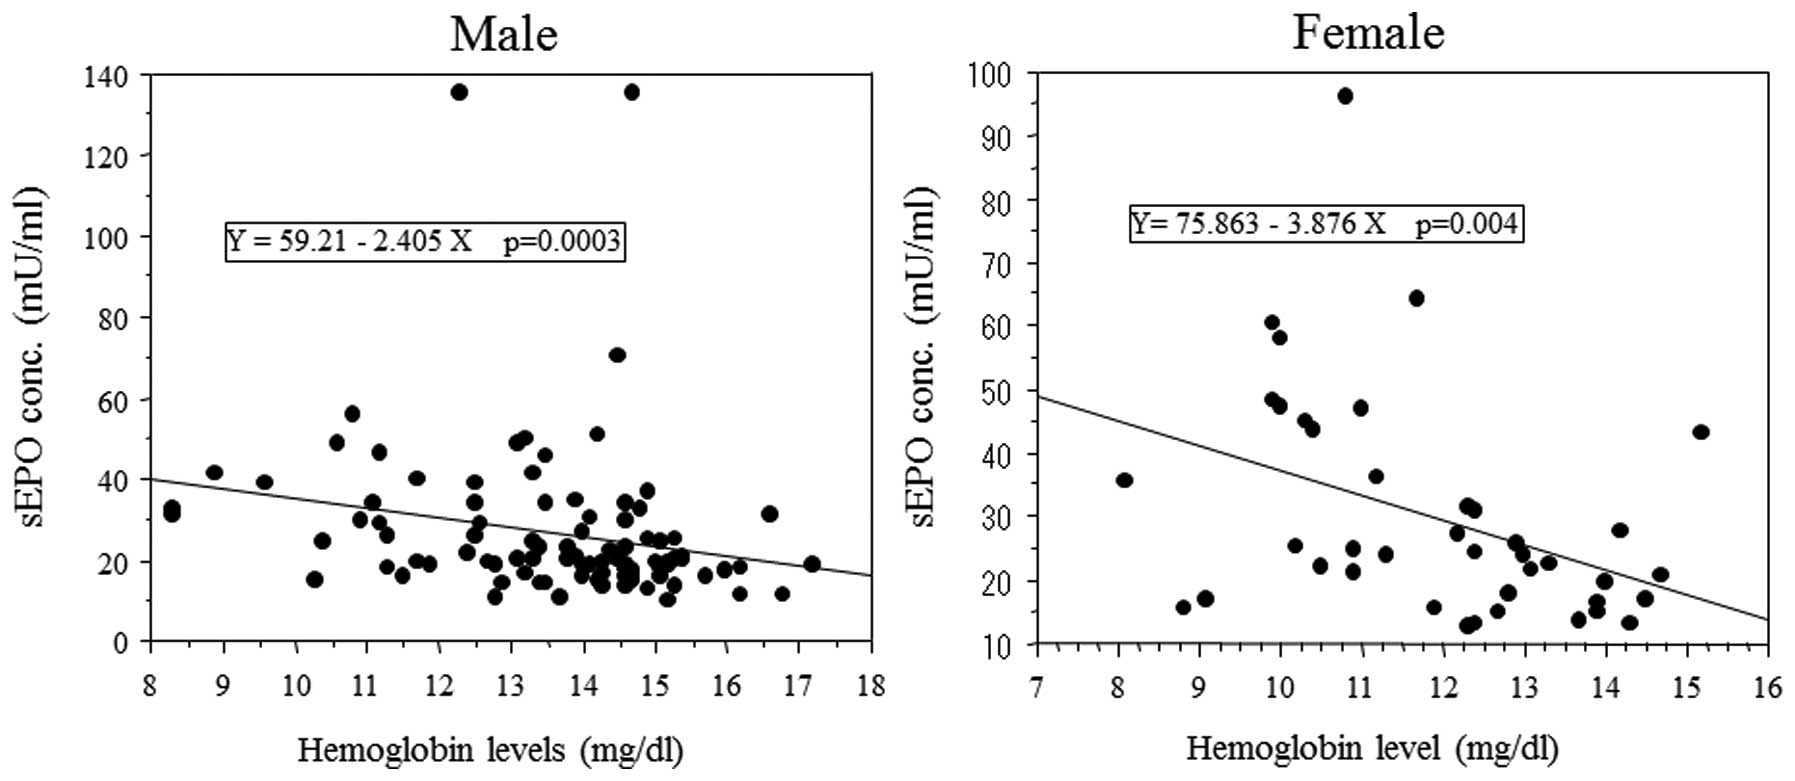
Negative correlation between sEPO levels
and hemoglobin levels
As EPO stimulates erythrocyte production and the
hemoglobin level is reportedly a prognostic factor in RCC patients,
the correlation between sEPO level and hemoglobin level was
evaluated. sEPO levels inversely correlated with hemoglobin levels
in male and female patients (Fig.
4). The percentage of patients with anemia was greater in
patients with high sEPO levels than those with low sEPO levels.
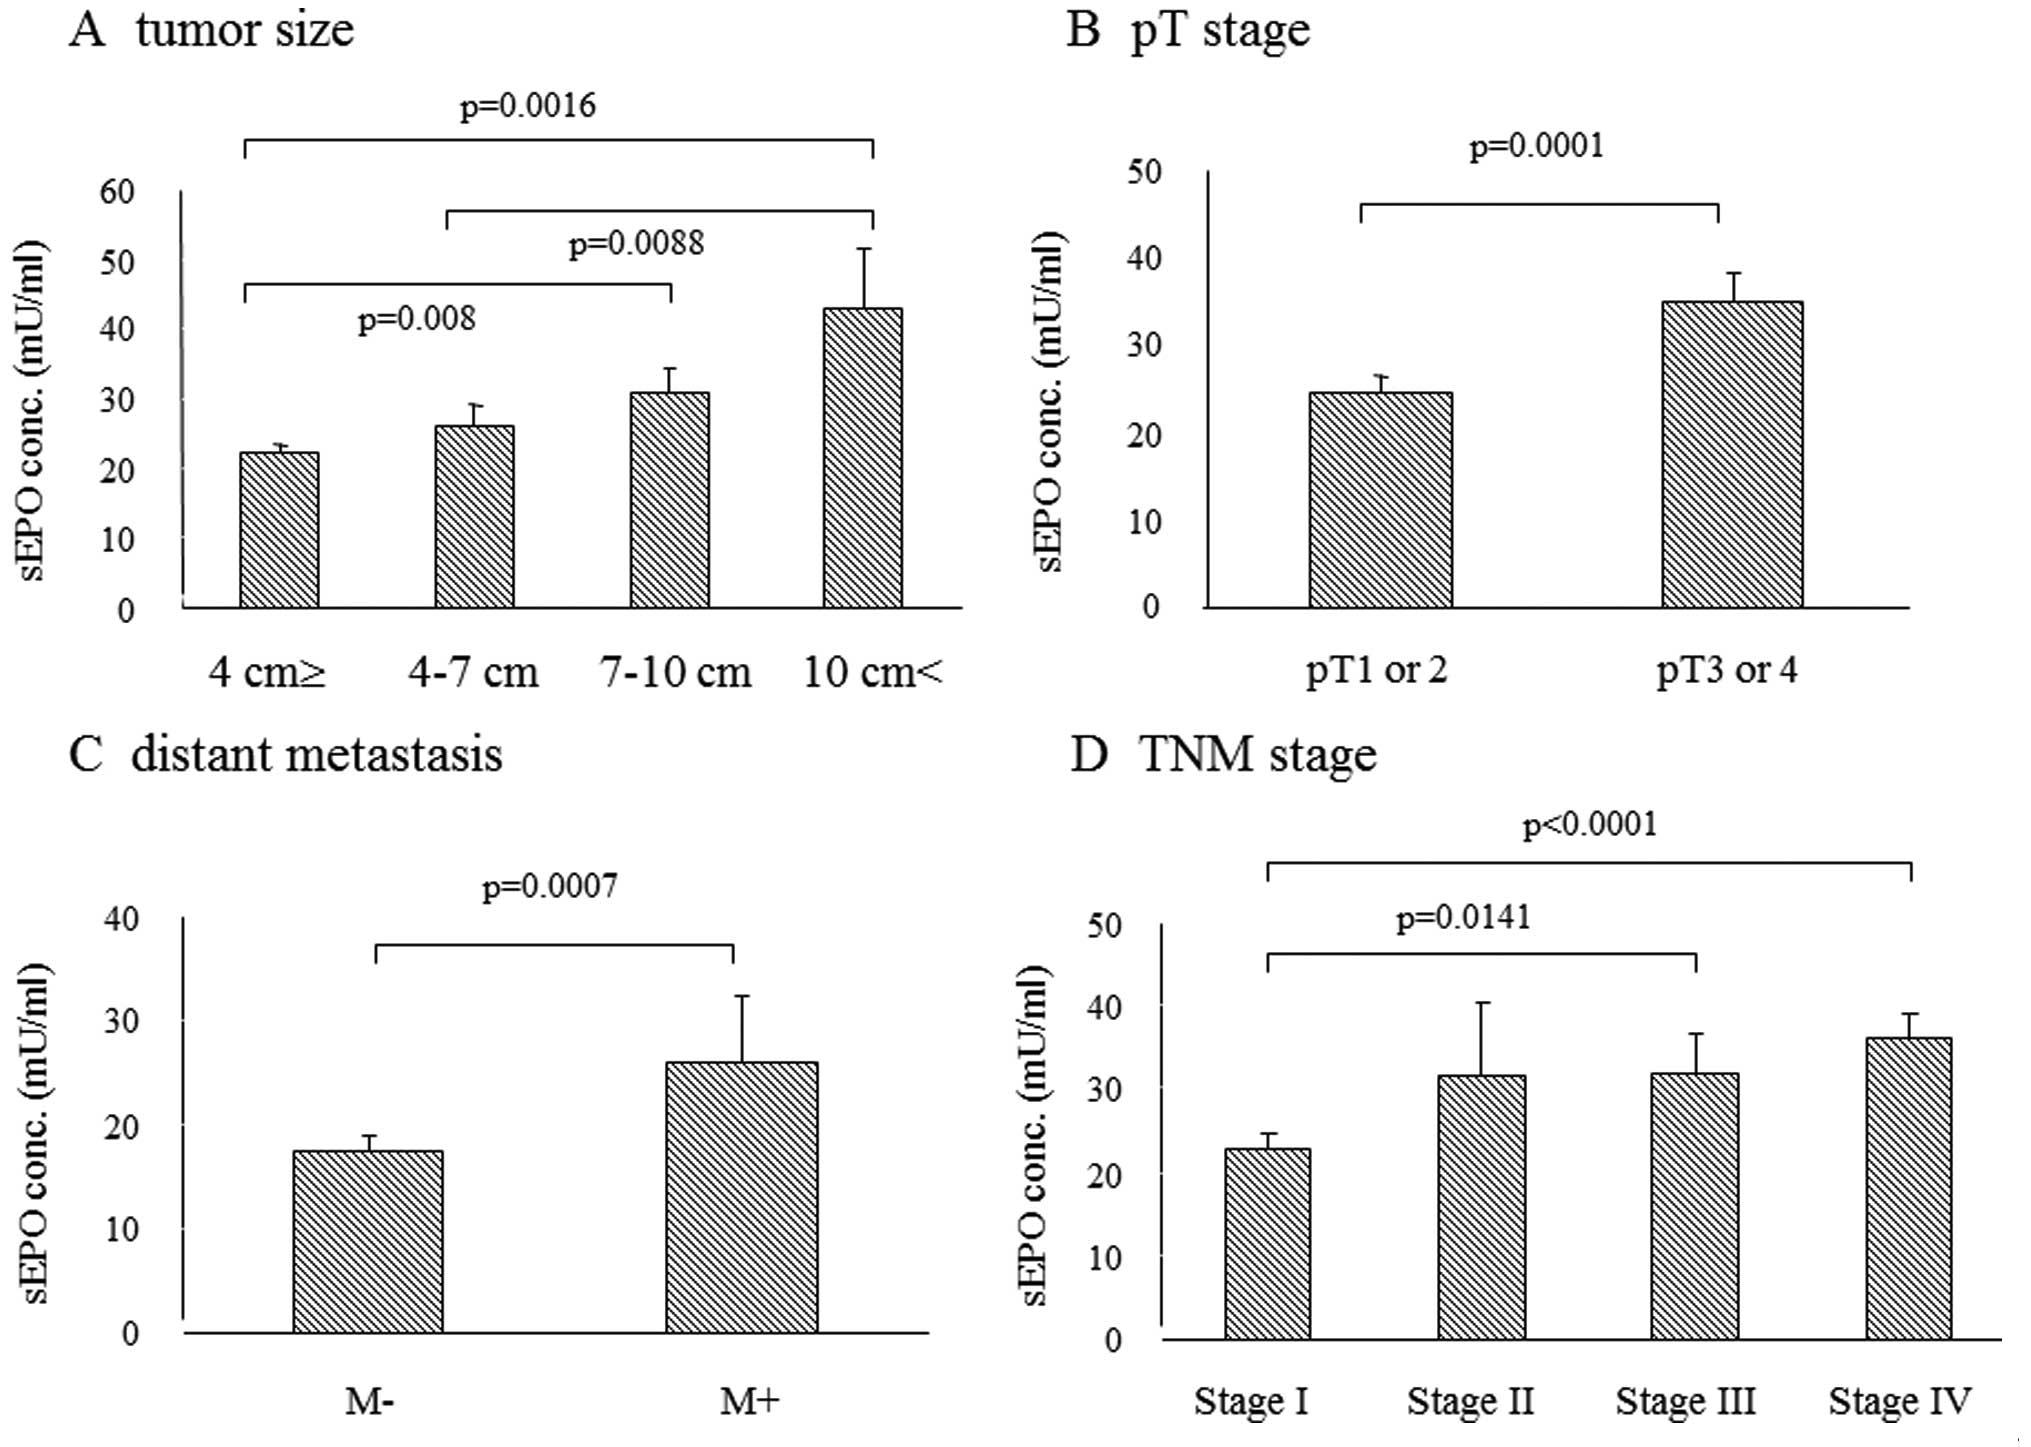
Factors associated with sEPO levels
To identify factors that influence sEPO level, we
evaluated the correlation between sEPO level and various
clinicopathological factors (Table
III). As shown in Fig. 5,
larger size, higher pT stage, distant metastasis (DM) and higher
TNM stage were associated with sEPO elevation. Logistic regression
analysis was used to identify independent factors associated with
sEPO elevation. Univariate analysis demonstrated that tumor size,
pT ≥3, lymph node metastasis (LNM), DM, presence of grade-3
component, MVI, anemia and CRP≥1 were significantly associated with
sEPO elevation. In multivariate analysis, only MVI was
independently associated with sEPO elevation. This result suggests
that EPO-EpoR signaling might promote invasion of RCC cells into
small venules or lymphatics. To confirm the association between MVI
and sEPO elevation, we divided N0M0 patients with primary tumors
4–7 cm in size into 2 groups. Patients with MVI (n=15; mean tumor
size, 5.5±0.2 cm) had significantly higher sEPO levels than those
without MVI (n=20, mean tumor size, 5.4±0.2 cm) (sEPO
level=36.9±7.9 vs. 18.6±1.0 mU/ml, respectively; P=0.0156).
Although tumor size was similar in the two groups, patients with
MVI had significantly higher sEPO levels than those without
MVI.
| Table III.Logistic regression analysis for
factors influencing sEPO elevation. |
Table III.
Logistic regression analysis for
factors influencing sEPO elevation.
| Univariate
| Multivariate
|
|---|
| Variables | P-value | P-value | Odds ratio | Relative risk ratio
95% CI |
|---|
| Male | 0.3196 | | | |
| Age | 0.052 | | | |
| Tumor size | 0.0014 | 0.9150 | | |
Cell type
(Clear cell vs. others) | 0.5527 | | | |
| pT ≥3 | 0.0002 | 0.7951 | | |
| Lymph node
metastasis | 0.0166 | 0.7688 | | |
| Distant
metastasis | 0.0103 | 0.6958 | | |
| Grade 3
component+ | 0.0007 | 0.9201 | | |
|
MVI+ | <0.0001 | 0.0054 | 4.633 | 1.573–13.648 |
| Infiltrative
type | 0.2234 | | | |
|
Anemia+ | 0.0003 | 0.1425 | | |
| CRP ≥1 mg/dl | 0.0004 | 0.2601 | | |
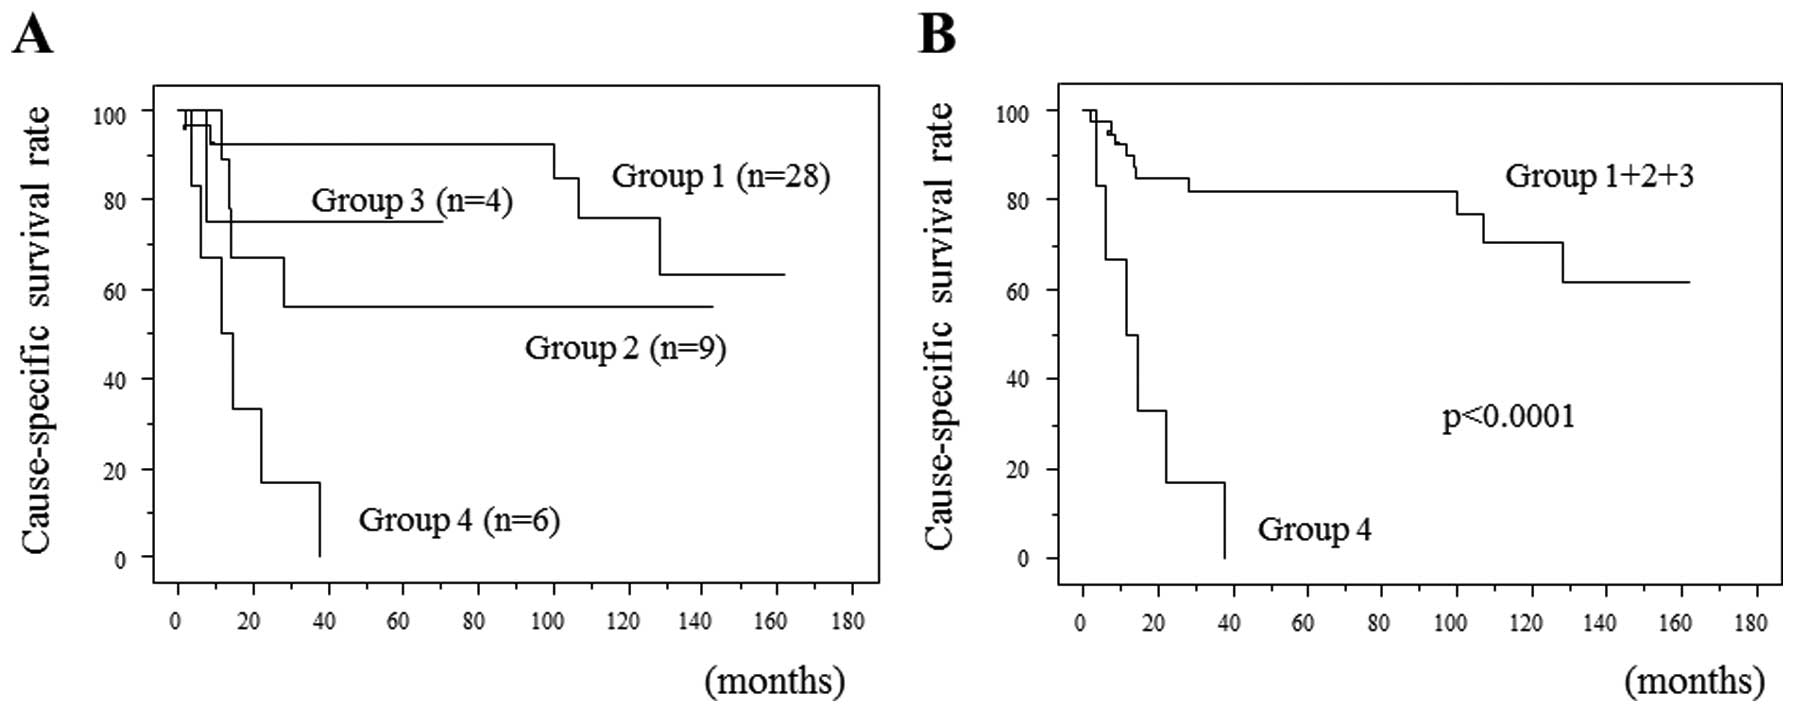
Prognostic significance of increased EpoR
expression and sEPO elevation in RCC patients
As described above, patients with tumors
demonstrating higher EpoR expression appeared to have higher sEPO
levels than those with lower EpoR expression. It is therefore
possible that tumors with increased EpoR expression might have
aggressive biological activities and have an increased ability to
produce EPO. When patients with elevated sEPO have tumors with
increased EpoR expression, the EPO-EpoR pathway might function
effectively and increase the aggressiveness of the tumors. To
examine this possibility, we divided the 47 patients whose sEPO and
specimen EpoR were determined into 4 groups (Fig. 6). The patients with high EpoR
expression and a high sEPO level had a worse prognosis than the
other patients. Their 1-, 2- and 3-year CSS rates were only 50, 33
and 17%, respectively.
Discussion
In the current study, we firstly focused on EpoR
expression in RCC tissue. Since increased EPO expression is
associated with aggressiveness of various malignancies (3), increased EPO receptor expression
might increase activity in the EPO-EpoR signaling pathway. EPO-EpoR
coexpression in cancer tissue is reportedly an independent
predictor for CSS in stage I non-small cell lung cancer (6). However, circulating EPO theoretically
affects its receptor more than intracellular EPO does, and in a
recent study intracellular (cytoplasmic) EPO expression was not
correlated with the sEPO level (12). We therefore evaluated the sEPO
level as well as tissue EpoR expression.
EPO-EpoR signaling reportedly stimulates
proliferation in Caki-2 and 786-O RCC cells (2). In the present study, the degree of
EpoR expression was correlated with the proliferative marker Ki-67.
Several signal transduction pathways have been reported to be
activated by the EPO-EpoR system. EPO-EpoR signaling activates the
JAK-STAT pathway in head and neck squamous cell carcinomas
(8), and Lester et al
demonstrated that EPO activates the ERK/MAPK pathway in breast
cancer cells (9). In the present
study, the level of EpoR expression was correlated with
proliferation, but not with the level of angiogenesis. Even RCC
tissues with low EpoR expression frequently demonstrated prominent
neovessels (Figs. 3D and F).
Low-grade RCC is typically a highly vascular tumor, and in the
present study, the sEPO level did not correlate with the number of
CD34-positive cells (P=0.8078, data not shown). This result is
different from that obtained in a study of gastric cancer (18), in which EpoR level correlated with
angiogenesis. RCC angiogenesis probably depends on other growth
factors, including VEGF and PDGF.
RCC with high EpoR expression was found to
frequently be infiltrative. This might be due to the fact that the
EPO-EpoR pathway is associated with RCC invasion. In head and neck
squamous cell carcinoma, JAK-STAT signaling contributes to cellular
invasion (8). In our results, MVI
was independently associated with elevated sEPO level but other
factors, including tumor size, were not. In N0M0 patients with T1b
tumor, patients with MVI had significantly higher sEPO levels than
those without MVI despite similar tumor sizes between those 2
groups (36.9±7.9 vs. 18.6±1.0 mU/ml). Immunohistochemical analysis
revealed that all 5 of the metastatic lesions examined demonstrated
high EpoR expression (level 3) and that tumor cells in microvessels
also demonstrated very high EpoR expression. EPO-EpoR signaling
probably has a role in MVI, and thus in RCC metastasis, or RCC
cells with high abilities of motility and invasion may produce
larger amounts of EPO.
Renal tubular cells surrounding RCC demonstrated
cytoplasmic EpoR expression, and EPO reportedly has a protective
effect on renal tubular cells. In an ischemic acute injury model,
the EPO system inhibited tubular cell apoptosis (19). The EPO-EpoR system is involved in
the growth of cancer cells (2),
the survival of stressed cancer cells, and probably in
chemoresistance. EPO has also been reported to reduce
cisplatin-induced apoptosis in RCC cells through a PKC-dependent
pathway (20).
sEPO level and hemoglobin level were negatively
correlated, but EPO usually stimulates the production of red blood
cells. The presentation of polycythemia generally requires the
presence of a high level of sEPO; a slightly elevated sEPO does not
cause polycythemia. RCC patients with elevated sEPO levels tend to
have advanced disease and thus may have elevated levels of various
cytokines that cause anemia, including IL-6 and TNF-α. Ljungberg
et al reported no association between sEPO level and
erythrocytosis and reported a negative correlation between
hemoglobin and sEPO level (4), but
the RCC patients in their study were not divided into male and
female groups despite differences in normal ranges of hemoglobin.
In the present study, we found a negative correlation between sEPO
and hemoglobin in both male and female patients.
As EPO and proteins IL-6, PDGF, VEGF and TGF-α are
induced by HIF-α, we evaluated the impact of EPO signaling on the
prognosis of RCC patients, and found neither increased EpoR
expression nor sEPO elevation to be an independent predictor for
CSS. This is probably due to the fact that not only EPO, but
various cytokines, were required for RCC progression. In the
present study, we investigated the combination of tissue EpoR
expression level and sEPO level. This combination can increase the
accuracy with which the clinical outcome for RCC patients can be
predicted. In patients with sEPO elevation and increased EpoR
expression, EPO-EpoR signaling is possibly enhanced. Saintigny
et al reported that EPO and EpoR coexpression was associated
with poor survival in stage I non-small cell lung cancer (6). Although in multivariate analysis
EPO-EpoR coelevation was not an independent factor for prognosis,
the EPO-EpoR system appeared to be important in RCC progression.
Further studies that include larger numbers of patients are
required.
References
|
1.
|
Da Silva JL, Lacombe C, Bruneval P,
Casadevall N, Leporrier M, Camilleri JP, Bariety J, Tambourin P and
Varet B: Tumor cells are the site of erythropoietin synthesis in
human renal cancers associated with polycythemia. Blood.
75:577–582. 1990.PubMed/NCBI
|
|
2.
|
Westenfelder C and Baranowski RL:
Erythropoietin stimulates proliferation of human renal carcinoma
cells. Kidney Int. 58:647–657. 2000. View Article : Google Scholar : PubMed/NCBI
|
|
3.
|
Hardee ME, Arcasoy MO, Blackwell KL,
Kirkpatrick JP and Dewhirst MW: Erythropoietin biology in cancer.
Clin Cancer Res. 12:332–339. 2006. View Article : Google Scholar : PubMed/NCBI
|
|
4.
|
Ljungberg B, Rasmuson T and Grankvist K:
Erythropoietin in renal cell carcinoma: evaluation of its
usefulness as a tumor marker. Eur Urol. 21:160–163. 1992.PubMed/NCBI
|
|
5.
|
Michael A, Politi E, Havranek E,
Corbishley C, Karapanagiotou L, Anderson C, Relph K, Syrigos KN and
Pandha H: Prognostic significance of erythropoietin expression in
human renal cell carcinoma. BJU Int. 100:291–294. 2007. View Article : Google Scholar : PubMed/NCBI
|
|
6.
|
Saintigny P, Besse B, Callard P, Vergnaud
AC, Czernichow S, Colombat M, Girard P, Validire P, Breau JL,
Bernaudin JF and Soria JC: Erythropoietin and erythropoietin
receptor coexpression is associated with poor survival in stage I
non-small cell lung cancer. Clin Cancer Res. 13:4825–4831. 2007.
View Article : Google Scholar : PubMed/NCBI
|
|
7.
|
Acs G, Xu X, Chu C, Acs P and Verma A:
Prognostic significance of erythropoietin expression in human
endometrial carcinoma. Cancer. 100:2376–2386. 2004. View Article : Google Scholar : PubMed/NCBI
|
|
8.
|
Lai SY, Childs EE, Xi S, Coppelli FM,
Gooding WE, Wells A, Ferris RL and Grandis JR:
Erythropoietin-mediated activation of JAK-STAT signaling
contributes to cellular invasion in head and neck squamous cell
carcinoma. Oncogene. 24:4442–4449. 2005. View Article : Google Scholar : PubMed/NCBI
|
|
9.
|
Lester RD, Jo M, Campana WM and Gonias SL:
Erythropoietin promotes MCF-7 breast cancer cell migration by an
ERK/mitogen-activated protein kinase-dependent pathway and is
primarily responsible for the increase in migration observed in
hypoxia. J Biol Chem. 280:39273–39277. 2005. View Article : Google Scholar
|
|
10.
|
Tilbrook PA, Colley SM, McCarthy DJ,
Marais R and Klinken SP: Erythropoietin-stimulated Raf-1 tyrosine
phosphorylation is associated with the tyrosine kinase Lyn in J2E
erythroleukemic cells. Arch Biochem Biophys. 396:128–132. 2001.
View Article : Google Scholar : PubMed/NCBI
|
|
11.
|
Gong K, Zhang N, Zhang Z and Na Y:
Coexpression of erythopoietin and erythopoietin receptor in
sporadic clear cell renal cell carcinoma. Cancer Biol Ther.
5:582–585. 2006. View Article : Google Scholar : PubMed/NCBI
|
|
12.
|
Papworth K, Bergh A, Grankvist K,
Ljungberg B and Rasmuson T: Expression of erythropoietin and its
receptor in human renal cell carcinoma. Tumour Biol. 30:86–92.
2009. View Article : Google Scholar : PubMed/NCBI
|
|
13.
|
Ito K, Yoshii H, Asakuma J, Sato A,
Horiguchi A, Sumitomo M, Hayakawa M and Asano T: Clinical impact of
the presence of the worst nucleolar grade in renal cell carcinoma
specimens. Jpn J Clin Oncol. 39:588–594. 2009. View Article : Google Scholar : PubMed/NCBI
|
|
14.
|
Horiguchi A, Asano T, Asakuma J, Asano T,
Sumitomo M and Hayakawa M: Impact of caveolin-1 expression on
clinicopathological parameters in renal cell carcinoma. J Urol.
172:718–722. 2004. View Article : Google Scholar : PubMed/NCBI
|
|
15.
|
Sturiale A, Campo S, Crascì E, Coppolino
G, Bolignano D, Grasso G and Buemi M: Erythropoietin and its lost
receptor. Nephrol Dial Transplant. 22:1484–1485. 2007. View Article : Google Scholar : PubMed/NCBI
|
|
16.
|
Miyajima A, Kosaka T, Asano T, Asano T,
Seta K, Kawai T and Hayakawa M: Angiotensin II type I antagonist
prevents pulmonary metastasis of murine renal cancer by inhibiting
tumor angiogenesis. Cancer Res. 62:4176–4179. 2002.PubMed/NCBI
|
|
17.
|
Islam AH, Ehara T, Kato H, Hayama M,
Kobayashi S, Igawa Y and Nishizawa O: Calponin h1 expression in
renal tumor vessels: correlations with multiple pathological
factors of renal cell carcinoma. J Urol. 171:1319–1323. 2004.
View Article : Google Scholar : PubMed/NCBI
|
|
18.
|
Ribatti D, Marzullo A, Nico B, Crivellato
E, Ria R and Vacca A: Erythropoietin as an angiogenic factor in
gastric carcinoma. Histopathology. 42:246–250. 2003. View Article : Google Scholar : PubMed/NCBI
|
|
19.
|
Vesey DA, Cheung C, Pat B, Endre Z, Gobé G
and Johnson DW: Erythropoietin protects against ischaemic acute
renal injury. Nephrol Dial Transplant. 19:348–355. 2004. View Article : Google Scholar : PubMed/NCBI
|
|
20.
|
Li J, Vesey DA, Johnson DW and Gobe G:
Erythropoietin reduces cisplatin-induced apoptosis in renal
carcinoma cells via a PKC dependent pathway. Cancer Biol Ther.
6:1944–1950. 2007. View Article : Google Scholar : PubMed/NCBI
|