Introduction
Primary nephrotic syndrome (PNS) is one of the most
common kidney diseases among children. Glucocorticoids (GCs) are
drugs frequently used in the treatment of PNS. Although GCs greatly
reduce the mortality rate in PNS patients, 60 to 80% of
steroid-responsive patients suffer from proteinuria relapse,
steroid-dependent nephritic syndrome and even steroid-resistant
nephrotic syndrome (SRNS) following complete remission at the early
stage of hormonal therapy (1). In
total, >10% of SRNS cases develop into end-stage renal diseases
due to the lack of a treatment protocol at the early stage
(2). Therefore, steroid resistance
has become the most difficult problem to overcome in PNS treatment.
As a reaction of the body to drugs, steroid resistance, whether
caused by abnormal receptor genes (3), disproportion in the receptor protein
structure (4) or protein
phosphorylation of the post-receptor transduction pathway, is
realized by changing the protein levels in PNS patients. Scholars
have demonstrated that certain genetic mutations (5,6) and
membranous nephropathy caused by viral hepatitis type B (7) are closely correlated with SRNS. The
protein expression levels of multidrug resistance-1 (MDR-1) and
P-glycoprotein 170 (Pgp170) serve as predictors for hormonal
responses (8,9). However, none of the mentioned studies
were able to make a complete and systemic judgment on the varying
responses of hormone therapy in PNS patients. Thus, these studies
all have a low specificity. Presently, there is neither a
diagnostic test which precisely detects SRNS (10) nor a protocol design for an
early-stage treatment of SRNS.
With the development of proteomics, the application
of urinary proteomics has become more and more extensively explored
for the treatment of kidney diseases (11,12),
particularly in newborns and children (13). Based on urinary proteomics, the
present study aimed to seek the urinary biomarkers for the early
diagnosis of SRNS in children.
Subjects and methods
Subjects
Patients involved in the present study received
treatment at the Affiliated Hospital of Luzhou Medical College
between September 2009 and December 2010. These patients were
divided into two groups, the SRNS and steroid-sensitive nephrotic
syndrome (SSNS) groups. The SRNS group consisted of 9 children with
an average age of 5.4±3.1 years, of whom 6 were boys and 3 were
girls. They all met the basic diagnostic criteria for SRNS
(1), namely that urinary protein
remained positive subsequent to eight weeks of prednisone
treatment. The SSNS group consisted of 32 children with an average
age of 5.0±3.8 years, of whom 20 were boys and 12 were girls. They
also all met the basic diagnostic criteria for SSNS (7), namely that urine protein was negative
following glucocorticoid treatment (prednisone 1.52 mg/kg daily)
for <8 weeks, and that the negative result remained following
the decrease in hormone levels. The control group consisted of 45
healthy children with an average age of 5.1±3.5 years, of whom 30
were boys and 15 were girls. There were no statistical differences
in age between the three groups (P>0.05). The study was approved
by the ethics committee of the Affiliated Hospital of Luzhou
Medical College, Luzhou, Sichuan, China. Written informed consent
was obtained from the patient’s family.
Preparation of urine samples
Urine samples of patients who met the conditions
were collected within 24 h of each other. A total of 20 ml of urine
was obtained, kept in the refrigerator at 4°C for half an hour and
centrifuged at 3,000 rpm at 4°C for 5 min. The supernatant liquid
was subpackaged into 0.5-ml tubes containing 10 to 100 μl
each and then kept at −80°C. A minimum of three tubes were prepared
for every sample. All procedures were performed below 4°C, and all
samples were frozen and thawed only once. Ten portions consisting
of 2 ml urine were obtained from the control group and centrifuged,
then kept at −80°C. Protease inhibitors were added to the collected
specimens.
Protein chip detection
Given that the protein content in urine is markedly
lower than that in blood, blood chips were not suitable for use in
the present study. Au-chips (ChipHergen, Fremont, CA, USA), a type
of protein chips with Au-plated ponds, were used for protein
selection in this study. Au-chips do not capture proteins; these
chips bear them. In addition, they are able to reflect the
expression of all proteins.
Preparation of half-saturated erucic acid
solution
A solution (200 μl) containing 50% methyl
cyanides and 0.5% trifluoroacetic acid was prepared. A total of 100
μl of the prepared solution was added to overdosed erucic
acid powder, oscillated and then centrifuged at 10,000 rpm for 3
min. The supernatant liquid was then withdrawn and double-diluted
with the prepared solution. The mixture was kept in the dark and
was used on the same day.
Sample application
The urine samples were removed from the freezer,
thawed on ice for 30 to 60 min and centrifuged at 10,000 rpm at 4°C
for 2 min. Exactly 10 μl of the supernatant liquid and 10
μl of the half-saturated erucic acid solution were added
into the centrifuge tube (0.2 ml). The prepared solution was mixed
thoroughly. The mixture was then applied into the Au-chip ponds,
with 1 to 2 μl of the mixture in each chip, and then dried.
According to the protein content in the sample, another 1 μl
of the half-saturated erucic acid may have been added to the pond
if necessary. A single pond on each different chip was randomly
selected for the application of the control urine to evaluate the
variability of the different chips. Control urine was subjected to
the same procedures.
Chip detection
Chips were processed using a Protein Biological
System II mass spectrometer at a laser intensity of 210, detector
sensitivity of 9 and optimized range of 2,000 to 20,000 Da.
Simulated spectra were generated by the computer.
Statistical analysis
Biomarker Wizard 3.1 software was adopted for
cluster and other analyses. The results from the ponds of control
urine showed that the coefficient of variability among the
different chips was <10%. The threshold of frequency for the
significant protein peak was set to 10%. Signal to noise (S/N)
ratio filtration was performed twice. For the preliminarily
screened protein peak, a t-test was carried out which involved a
comparison between the three groups. P<0.01 was considered to
indicate a statistically significant difference.
Establishment of the diagnostic
model
Distinctive protein mass-to-charge ratio (m/e) peak
values were considered as the input layer and peak height as the
quantitative index. The expected output values of SRNS and SSNS
were set to 1 and 0, respectively. A diagnostic model was
established using Biomarker pattern software 5.0.2. Its
sensitivity, specificity and predictive value were analyzed.
Results
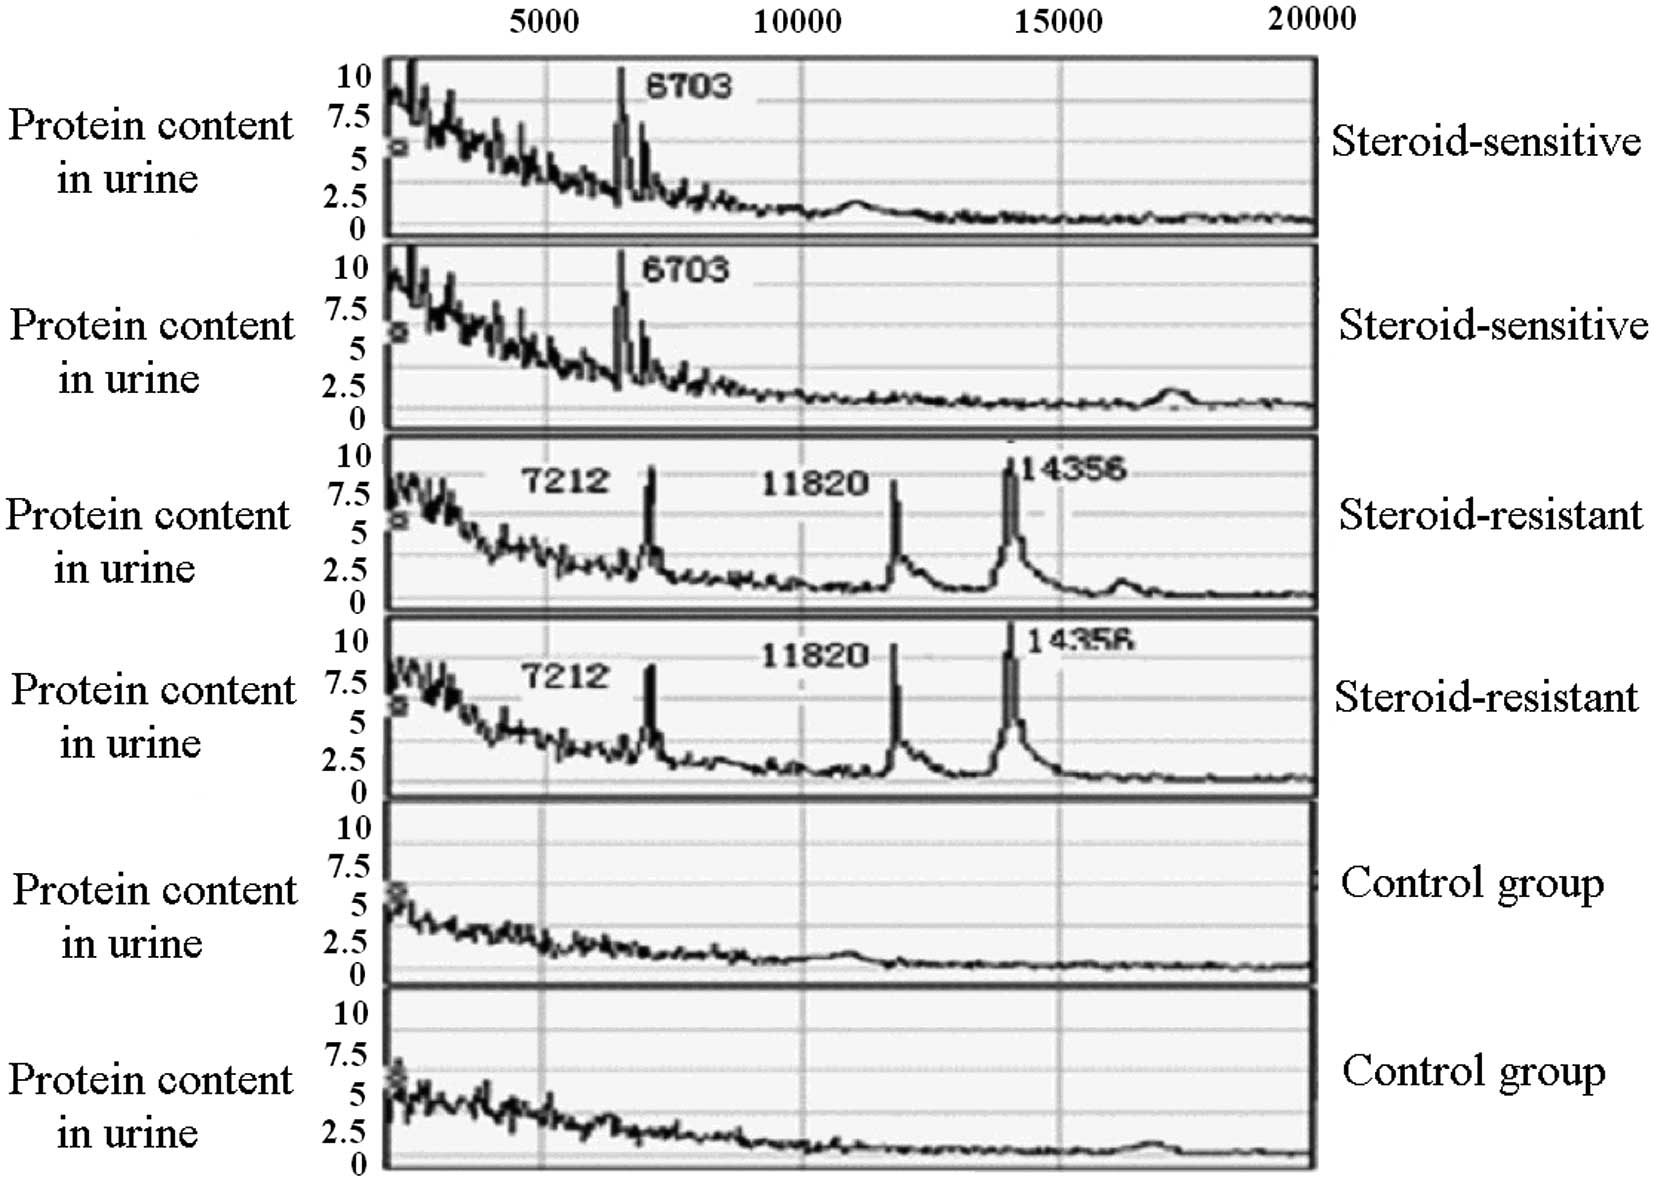
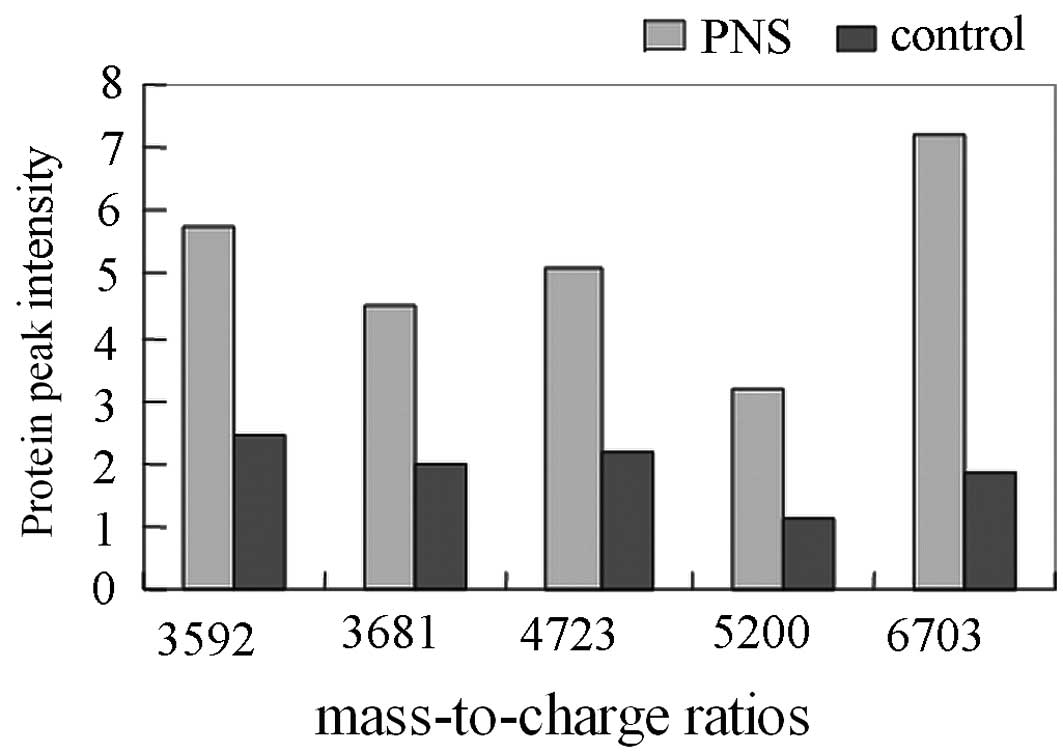
Screening of urinary PNS markers
In every urine sample, ∼50 protein peaks were
detected at the 2,000 to 20,000 range of relative molecular mass.
Comparison of the mass spectra of the 41 PNS and 45 healthy
children showed that there were significant differences in the 5
protein peaks. The m/e peak values were 3592.23, 3681.17, 4723.76,
5200.19 and 6703.72 (P<0.01; Table
I and Figs. 1 and 2). The peak intensities of these proteins
increased notably in the PNS group, which suggested that they may
be protein markers for PNS. Proteins at m/e peak values of 2770.31
and 4729.15 were common proteins shared by the two groups, and were
used as the internal standards in the present study.
 | Table I.Comparison of the m/e ratios of
protein peaks between the PNS and control groups. |
Table I.
Comparison of the m/e ratios of
protein peaks between the PNS and control groups.
| | m/e
|
|---|
| Grouping | n | 3592.23 | 3681.17 | 4723.76 | 5200.19 | 6703.72 |
|---|
| PNS | 41 | 5.73±1.0 | 4.50±2.12 | 5.11±1.99 | 3.16±0.78 | 7.19±1.48 |
| Control | 45 | 2.46±0.9 | 1.97±0.86 | 2.17±0.81 | 1.12±0.51 | 1.85±0.70 |
| T-value | | 16.35 | 7.44 | 9.19 | 14.57 | 22.25 |
| P-value | | <0.01 | <0.01 | <0.01 | <0.01 | <0.01 |
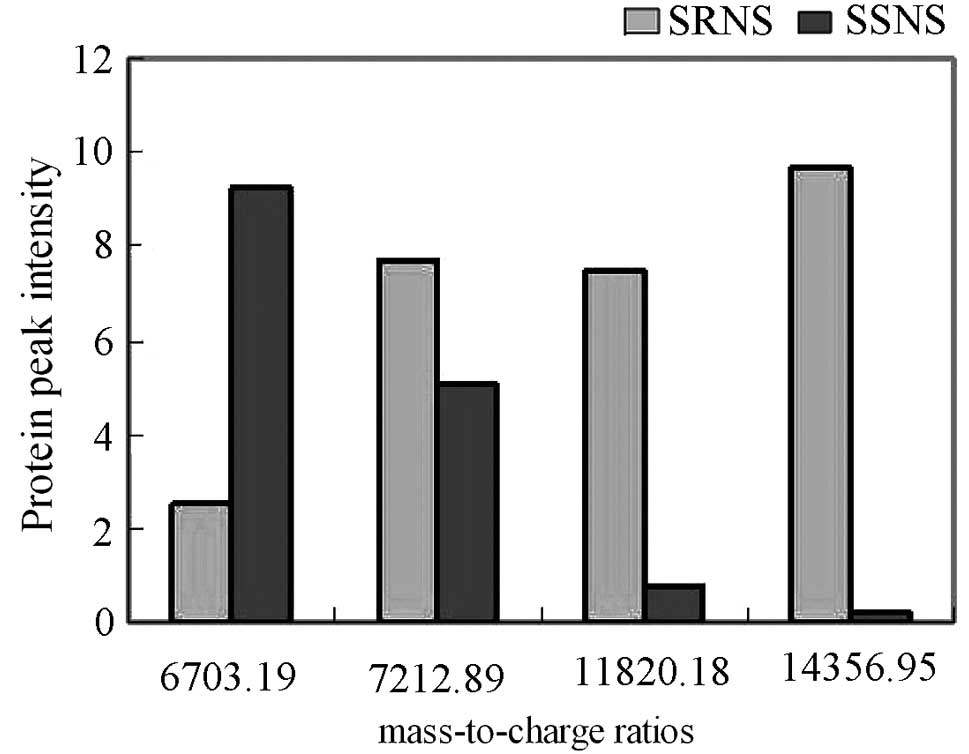
Screening of SRNS biomarkers
The mass spectra of the SRNS and SSNS groups were
analyzed and compared. Results showed that there were significant
differences in the expression of four proteins (P<0.01; Table II and Figs. 1 and 3). Proteins at m/e peak values of
7212.89, 11820.18 and 14356.95 were overexpressed in the SRNS
group, showing a statistically significant difference compared with
the SSNS group (P<0.01). The protein at the m/e peak value of
6703.19 was overexpressed in the SSNS group, showing a statistical
significance compared with the SRNS group (P<0.01).
| Table II.Comparison of the m/e ratios of
protein peaks between the SRNS and SSNS groups. |
Table II.
Comparison of the m/e ratios of
protein peaks between the SRNS and SSNS groups.
| | m/e
|
|---|
| Grouping | n | 6703.19 | 7212.89 | 11820.18 | 14356.95 |
|---|
| SRNS | 9 | 2.54±1.17 | 7.71±2.76 | 7.52±1.32 | 9.69±1.53 |
| SSNS | 32 | 9.20±1.57 | 5.04±1.39 | 0.75±0.21 | 0.33±0.12 |
| T-value | | 11.89 | 4.04 | 28.63 | 35.45 |
| P-value | | <0.01 | <0.01 | <0.01 | <0.01 |
Evaluation of differentially expressed
proteins in SRNS diagnosis
In the present study, the differentially expressed
proteins in the SRNS urine were named R6703, R7210, R11820 and
R14356. These proteins were used for the establishment of the SRNS
diagnostic model. The protein peak heights from the mass spectra of
41 PNS patients were used as inputs for the BP neural network (an
artificial neural network based on error back-propagation
algorithm). The expected output values of SRNS and SSNS were then
set to 1 and 0, respectively. These values were used as the cut-off
point, above which was SRNS and below which was SSNS. The results
showed that one case of diagnostic error was detected in the SRNS
samples (1/9) and 2 cases were detected in the SSNS samples (2/32).
The sensitivity and specificity of the SRNS diagnosis (Table III) were 88.89 and 93.75%,
respectively.
| Table III.Analysis of diagnostic efficiency of
the model. |
Table III.
Analysis of diagnostic efficiency of
the model.
| Grouping | n | SRNS (predictive
value >0.5) | SSNS (predictive
value <0.5) |
|---|
| SRNS | 9 | 8 | 1 |
| SSNS | 32 | 30 | 2 |
| Total | 41 | 38 | 3 |
Protein identification
The m/e ratios of the differentially expressed
proteins were used as inputs into the protein databases (http://us.expasy.org/tools/tagident.html), and their
corresponding proteins were obtained (Table IV).
| Table IV.Identification of differentially
expressed proteins between the SRNS and SSNS groups. |
Table IV.
Identification of differentially
expressed proteins between the SRNS and SSNS groups.
| m/e | Mean SRNS | Mean SSNS | Corresponding
proteins |
|---|
| 6703.19 | 2.54 | 9.20 | 50S ribosomal protein
L32 |
| 7012.89 | 7.53 | 5.04 | S-adenosylmethionine
decarboxylase α chain |
| 11820.18 | 7.52 | 0.75 | FK506-binding protein
1A |
| 14356.95 | 9.69 | 0.23 | 30S ribosomal protein
S11 |
Discussion
Urine is an important source of biomarkers (14), as it contains thousands of
polypeptides and proteins. Changes in the structures of certain
polypeptides and proteins are associated with their functions.
These associations reflect the development of diseases, which not
only serve as specific biomarkers for the early diagnosis and
evaluation of kidney diseases, disease progression and therapeutic
effects (15–17), but also for the diagnosis and
follow-up of certain systemic diseases, including pre-eclampsia
(18) and bladder carcinoma
(19). Presently, the definitive
urinary biomarkers for kidney diseases include albumin and
β2-microglobulin. In the present study, a comparison of the spectra
between the PNS (n=41) and control groups was performed. The result
showed that proteins at m/e peak values of 3592.23, 681.17,
4723.76, 5200.19 and 6703.72 presented significant differences.
These protein peak intensities increased notably in the PNS group
(P<0.01), thus suggesting that they may be the biomarkers for
PNS.
However, although some biomarkers for PNS have been
identified, these failed to further differentiate SRNS from other
PNS diseases. In the present study, a comparison between the SRNS
and SSNS groups was also performed. The results showed that the
protein at peak intensities of 7212.89, 11820.18 and 14356.95 was
overexpressed in the SRNS group compared with the SSNS and control
groups. These proteins may originate from the blood or nephridial
tissues, and appear in the urine following glomerular filtration or
transurethral secretion. These proteins are presumed to be steroid
resistance-related proteins produced by the body which exist prior
to the application of steroids. The existence of these proteins may
be caused by factors which include the PNS resistance-related
pathological type or genes, abnormal activities of GC
metabolism-related isoforms of 11-hydroxysteroid dehydrogenase,
abnormality in GC receptors and abnormality in transcription
factors. Furthermore, the protein at the m/e peak value of 6703.19
was overexpressed in the SSNS group but underexpressed in the SRNS
and control groups. This protein is also presumed to be a steroid
sensitivity-related protein produced by the body.
Urine has an important specificity and sensitivity
in predicting the development and prognosis of diseases. In
addition, it may provide a reference for the early stages of
treatment response. In the present study, an SRNS diagnostic model
was established. The results showed that its sensitivity and
specificity were 88.89 and 93.75%, respectively, in which one
diagnostic error was detected in the SRNS group (1/9) and 2 errors
in the SSNS group (2/32). The sensitivity and specificity of the
urine proteomic diagnosis for diabetics are 89 and 91%,
respectively (20). These results
indicate that the four proteins detected in the urine by the
present study have a high sensitivity and specificity in the
screening of SRNS.
At present, there is no standard criterion for SRNS
diagnosis. Therefore, the identification of early, sensitive,
simple and non-invasive SRNS markers is of great significance in
clinical studies. With the development of proteomics, its wide
application is likely to provide a solution to this puzzle and also
provide a potential substitute method to invasive nephric biopsies.
Based on urinary proteomics, the present study indicates that the
expression of the proteins with mass-to-charge ratios of 7212, 1182
and 14356 increase in SRNS patients. These proteins may be urinary
biomarkers for SRNS.
These results demonstrate that urine proteomics
plays an important role in the screening and identification of the
molecular markers of children with nephrotic syndrome, particularly
hormone drug-resistant nephrotic syndrome. As technology improves,
further drug targets may be identified through the use of urine
proteomics in the future.
References
|
1.
|
Hogg RJ, Portman RJ, Milliner D, Lemley
KV, Eddy A and Ingelfinger J: Evaluation and management of
proteinuria and nephrotic syndrome in children: recommendations
from a pediatric nephrology panel established at the National
Kidney Foundation conference on proteinuria, albuminuria, risk,
assessment, detection, and elimination (PARADE). Pediatrics.
105:1242–1249. 2000.
|
|
2.
|
Otukesh H, Otukesh S, Mojtahedzadeh M, et
al: Management and outcome of steroid-resistant nephrotic syndrome
in children. Iran J Kidney Dis. 3:210–217. 2009.PubMed/NCBI
|
|
3.
|
Charmandari E, Raji A, Kino T, et al: A
novel point mutation in the ligand-binding domain (LBD) of the
human glucocorticoid receptor (hGR) causing generalized
glucocorticoid resistance: the importance of the C terminus of hGR
LBD in conferring transactivational activity. J Clin Endocrinol
Metab. 90:3696–3705. 2005. View Article : Google Scholar
|
|
4.
|
Ruiz M, Lind U, Gåfvels M, et al:
Characterization of two novel mutations in the glucocorticoid
receptor gene in patients with primary cortisol resistance. Clin
Endocrinol (Oxf). 55:363–371. 2001. View Article : Google Scholar : PubMed/NCBI
|
|
5.
|
Mir S, Yavascan O, Berdeli A and Sozeri B:
TRPC6 gene variants in Turkish children with steroid-resistant
nephrotic syndrome. Nephrol Dial Transplant. 27:205–209. 2012.
View Article : Google Scholar : PubMed/NCBI
|
|
6.
|
Mbarek IB, Abroug S, Omezzine A, et al:
Novel mutations in steroid-resistant nephrotic syndrome diagnosed
in Tunisian children. Pediatr Nephrol. 26:241–249. 2011. View Article : Google Scholar : PubMed/NCBI
|
|
7.
|
Bhimma R, Coovadia HM and Adhikari M:
Nephrotic syndrome in South African children: changing perspectives
over 20 years. Pediatr Nephrol. 11:429–434. 1997.PubMed/NCBI
|
|
8.
|
Wasilewska A, Zalewski G, Chyczewski L and
Zoch-Zwierz W: MDR-1 gene polymorphisms and clinical course of
steroid-responsive nephrotic syndrome in children. Pediatr Nephrol.
22:44–51. 2007. View Article : Google Scholar : PubMed/NCBI
|
|
9.
|
Jafar T, Prasad N, Agarwal V, et al: MDR-1
gene polymorphisms in steroid-responsive versus steroid-resistant
nephrotic syndrome in children. Nephrol Dial Transplant.
26:3968–3974. 2011. View Article : Google Scholar : PubMed/NCBI
|
|
10.
|
Traum AZ: Urine proteomic profiling to
identify biomarkers of steroid resistance in pediatric nephrotic
syndrome. Expert Rev Proteomics. 5:715–719. 2008. View Article : Google Scholar : PubMed/NCBI
|
|
11.
|
Kim MJ, Frankel AH and Tam FW: Urine
proteomics and biomarkers in renal disease. Nephron Exp Nephrol.
119:e1–e7. 2011. View Article : Google Scholar : PubMed/NCBI
|
|
12.
|
Siew ED, Ware LB and Ikizler TA:
Biological markers of acute kidney injury. J Am Soc Nephrol.
22:810–820. 2011. View Article : Google Scholar : PubMed/NCBI
|
|
13.
|
Albalat A, Mischak H and Mullen W: Urine
proteomics in clinical applications: technologies, principal
considerations and clinical implementation. Prilozi. 32:13–44.
2011.PubMed/NCBI
|
|
14.
|
Shao C, Wang Y and Gao Y: Applications of
urinary proteomics in biomarker discovery. Sci China Life Sci.
54:409–417. 2011. View Article : Google Scholar : PubMed/NCBI
|
|
15.
|
Mischak H, Delles C, Klein J and Schanstra
JP: Urinary proteomics based on capillary electrophoresis-coupled
mass spectrometry in kidney disease: discovery and validation of
biomarkers, and clinical application. Adv Chronic Kidney Dis.
17:493–506. 2010. View Article : Google Scholar
|
|
16.
|
Pejcic M, Stojnev S and Stefanovic V:
Urinary proteomics - a tool for biomarker discovery. Ren Fail.
32:259–268. 2010. View Article : Google Scholar : PubMed/NCBI
|
|
17.
|
Wu J, Chen YD and Gu W: Urinary proteomics
as a novel tool for biomarker discovery in kidney diseases. J
Zhejiang Univ Sci B. 11:227–237. 2010. View Article : Google Scholar : PubMed/NCBI
|
|
18.
|
Carty DM, Siwy J, Brennand JE, et al:
Urinary proteomics for prediction of preeclampsia. Hypertension.
57:561–569. 2011. View Article : Google Scholar : PubMed/NCBI
|
|
19.
|
Schiffer E, Vlahou A, Petrolekas A, et al:
Prediction of muscle-invasive bladder cancer using urinary
proteomics. Clin Cancer Res. 15:4935–4943. 2009. View Article : Google Scholar : PubMed/NCBI
|
|
20.
|
Rossing K, Mischak H, Dakna M, et al:
Urinary proteomics in diabetes and CKD. J Am Soc Nephrol.
19:1283–1290. 2008. View Article : Google Scholar : PubMed/NCBI
|