Introduction
Numerous immunosuppressive drugs, including
cyclosporin A, tacrolimus (previously termed FK 506), sirolimus
(rapamycin), everolimus and mycophenolic acid, are used to prevent
the rejection of transplanted organs or tissues (1). Narrow therapeutic indices, variable
inter- and intra-individual pharmacokinetics and pharmacodynamics
complicate drug dosing. To maintain drug concentrations in the
therapeutic range and minimize their toxicity or the risk of organ
rejection, regular immunosuppressant drug monitoring is required
(2,3).
Several common and easily automated immunoassays are
currently used to determine the concentrations of immunosuppressive
drugs. These include: the enzyme multiplied immunoassay,
radioimmunoassay, enzyme-linked immunosorbent assay, cloned enzyme
donor immunoassay, chemiluminescence immunoassay (CLIA) and
fluorescence polarization immunoassay (4,5). A
primary disadvantage of these methods is that cross-reactions
between drugs and metabolites may result in overestimation of the
drug concentration with unacceptable bias. Furthermore, they are
high in cost and are not able to assay multiple drugs
simultaneously.
Liquid chromatography-mass spectrometry/mass
spectrometry (LC-MS/MS) has the potential to circumvent the
problems of poor specificity by separating drugs from metabolites
and, therefore, is one of the most selective methods applied to
therapeutic drug monitoring (TDM) (6). Several LC techniques using
ultraviolet detection, mass spectrometry or tandem mass
spectrometry (TMS) have been developed for the measurement of
immunosuppressant drug concentrations (7–12).
In the present study, the performance of a recently
developed high-throughput, rapid, ultra-performance liquid
chromatography (UPLC) TMS method was analyzed, using common sample
pretreatments for the simultaneous quantification of cyclosporin A
and tacrolimus in whole blood. The analytical procedure was
validated by the comparison of the UPLC-TMS results with those of
CLIA for >3,000 clinical samples from transplant patients.
Materials and methods
Collection of specimens
Whole blood samples (stored in EDTA tube at 4ºC
until tested) were collected from multiple transplant patients
receiving cyclosporin A or tacrolimus during hospitalization or
outpatient treatment between May 2011 and May 2013. All samples
were anonymized and measured by two analytical methods (UPLC-TMS
and CLIA) within three days of collection. The study was approved
by the Institutional Review Board of Soonchunhyang University
Bucheon Hospital (Buchneon, Korea). Informed consent was obtained
from the patients
UPLC-TMS
Materials and reagents
All solvents were LC-MS grade. Methanol and
acetonitrile were obtained from Duksan Pure Chemicals (Gyeonggi,
Korea) and formic acid, ammonium acetate and zinc sulfate
heptahydrate were purchased from Sigma-Aldrich (St. Louis, MO,
USA). The MassCheck® immunosuppressants kit
(Chromsystems Instruments and Chemicals GmbH, Munich, Germany)
included six level calibrators and four level controls. Ascomycin
served as an internal standard for tacrolimus and was obtained from
Sigma-Aldrich, and cyclosporin D served as an internal standard for
cyclosporin A and was obtained from United States Biological, Inc.
(Salem, MA, USA).
Sample preparation
Calibrators and controls were reconstituted by
dissolving in 2 ml LC-MS grade water for 10 min. The solutions were
then agitated on a roller mixer for 2 h. The contents of the
internal standard were reconstituted in 1 ml methanol. The volume
of the internal standard was brought to 250 ml with
acetonitrile.
Forty microliters of whole blood (obtained from
calibrators, control materials and patient samples) were
transferred into individual 1.5-ml tubes. Subsequently, 80 ml 0.1 M
zinc sulfate solution was added to induce hemolysis. The samples
were vortexed for 1 min, followed by the addition of 200 μl
internal standard with acetonitrile to precipitate proteins. The
contents were mixed until the samples were thoroughly dissolved and
then centrifuged at 15,000 × g for 5 min. The supernatant was
transferred to a V-bottomed microplate (Chromsystems Instruments
and Chemicals GmbH) and sample aliquots were injected into the
UPLC-TMS instrument for analysis.
UPLC-TMS measurements
UPLC was performed on a Waters Acquity®
UPLC system (Waters Corporation, Milford, MA, USA). The extract (20
μl) was injected via an autosampler into an Acquity UPLC C18 column
(2.1×10 mm, 1.8 μm) and maintained at 55ºC in the column oven. LC
separation was performed using a gradient profile of mobile phase A
and B solutions, consisting of 2 mM ammonium acetate with 0.1%
formic acid (v/v) in water and 2 mM ammonium acetate with 0.1%
formic acid (v/v) in methanol, respectively. The flow rate was 400
μl/min and the running time was 1.8 min. The gradient program was
50% mobile phase B for 0.2 min, increased to 100% mobile phase B at
400 μl/min and followed by a change to 50% mobile phase B for 1
min. The total instrumental analysis time was 2.5 min, including
re-equilibration of the column.
TMS was used to detect cyclosporin A, tacrolimus and
their corresponding deuterium-labeled internal standards on a
Waters Acquity® TQ-Detector (Waters Corporation). At
unit mass resolution, the mass analyzer had the following settings:
cone voltage at 34 V; collision energy at 20 eV; source and
desolvation temperatures of 130 and 350ºC, respectively; and
desolvation gas flow at 800 l/h. The analysis was performed using
electrospray positive ionization in the multiple reaction
monitoring (MRM) mode: a mass to charge ratio (m/z) of cyclosporin
A, tacrolimus, ascomycin and cyclosporin D of 1,219.9>1,202.5,
821.5>768.1, 809.5>756.1 and 1,234.0>1,216.6,
respectively. Quantitation was performed using the TargetLynx
Manager in the Waters MassLynx 4.1 software (Waters Corporation) by
the linear regression of the peak area ratios of cyclosporin
A/cyclosporin D and tacrolimus/ascomycin against the calibrator
concentrations with 1/x weighting.
CLIA
The EDTA-whole blood sample was extracted with a
protein precipitation reagent comprising methanol and zinc sulfate
and then centrifuged at centrifuged at 15,000 × g for 4 min. The
supernatant obtained was recovered for analysis using the Abbott
Architect i2000 system (Abbott Diagnostics, Abbott Park, IL, USA).
Cyclosporin A or tacrolimus in the specimen bound to microparticles
in the Abbott reagent that were coated with mouse antibodies raised
against these drugs. After a brief period, an acridinium-labeled
drug conjugate was added to the reaction mixture. This compound
competed with the drug in the patient specimen for the available
binding sites on the microparticles. Following incubation, the
microparticles were washed and trigger solutions were added to the
reaction mixture. The resulting chemiluminescent signal was
expressed as relative light units. Due to the competitive binding
nature of this reaction, an indirect correlation was observed
between the quantity of drug and the relative light units detected
by the system optics.
Method validation
Precision
The within- and between-run precision of the
UPLC-TMS method was assessed using duplicate level 1–4 serum
control material samples for two days.
Limit of quantification (LOQ) and
limit of detection (LOD)
The LOQ was determined using pooled samples. Pooled
specimens were diluted with the blank pool to generate three
concentrations of cyclosporin A and tacrolimus. Each sample was
measured five times per pool, including the lowest pool
concentration. The LOQ was defined as the concentration
corresponding to the 20% coefficient of variation (CV) and >10:1
signal to noise ratio. LOD was defined as the lowest concentration
corresponding to a >3:1 signal to noise ratio.
Matrix effect
The matrix effect was evaluated by a continuous
infusion of internal standard (IS) at a flow rate of 20 μl/min into
the effluent from the column, prior to its introduction into the MS
system. Ion suppression/enhancement was analyzed on blood and water
matrices by injecting 2 μl of pretreated blood and water into the
MS/MS system and recording the MRM signal of the IS.
Method comparison
The UPLC-TMS method was compared with the CLIA
method in the analysis of 3,469 clinical specimens obtained from
various transplant patients receiving cyclosporin A or tacrolimus
during hospitalization or outpatient clinic visits. The samples
were distributed evenly from low to high concentrations.
Statistical analysis
Descriptive statistical analysis of the data was
accomplished using Analyse-it for Microsoft Excel (Analyse-it
Software Ltd., Leeds, UK). P<0.05 was considered to indicate a
statistically significant difference. Passing and Bablok regression
and a Bland-Altman plot were performed for comparison.
Results
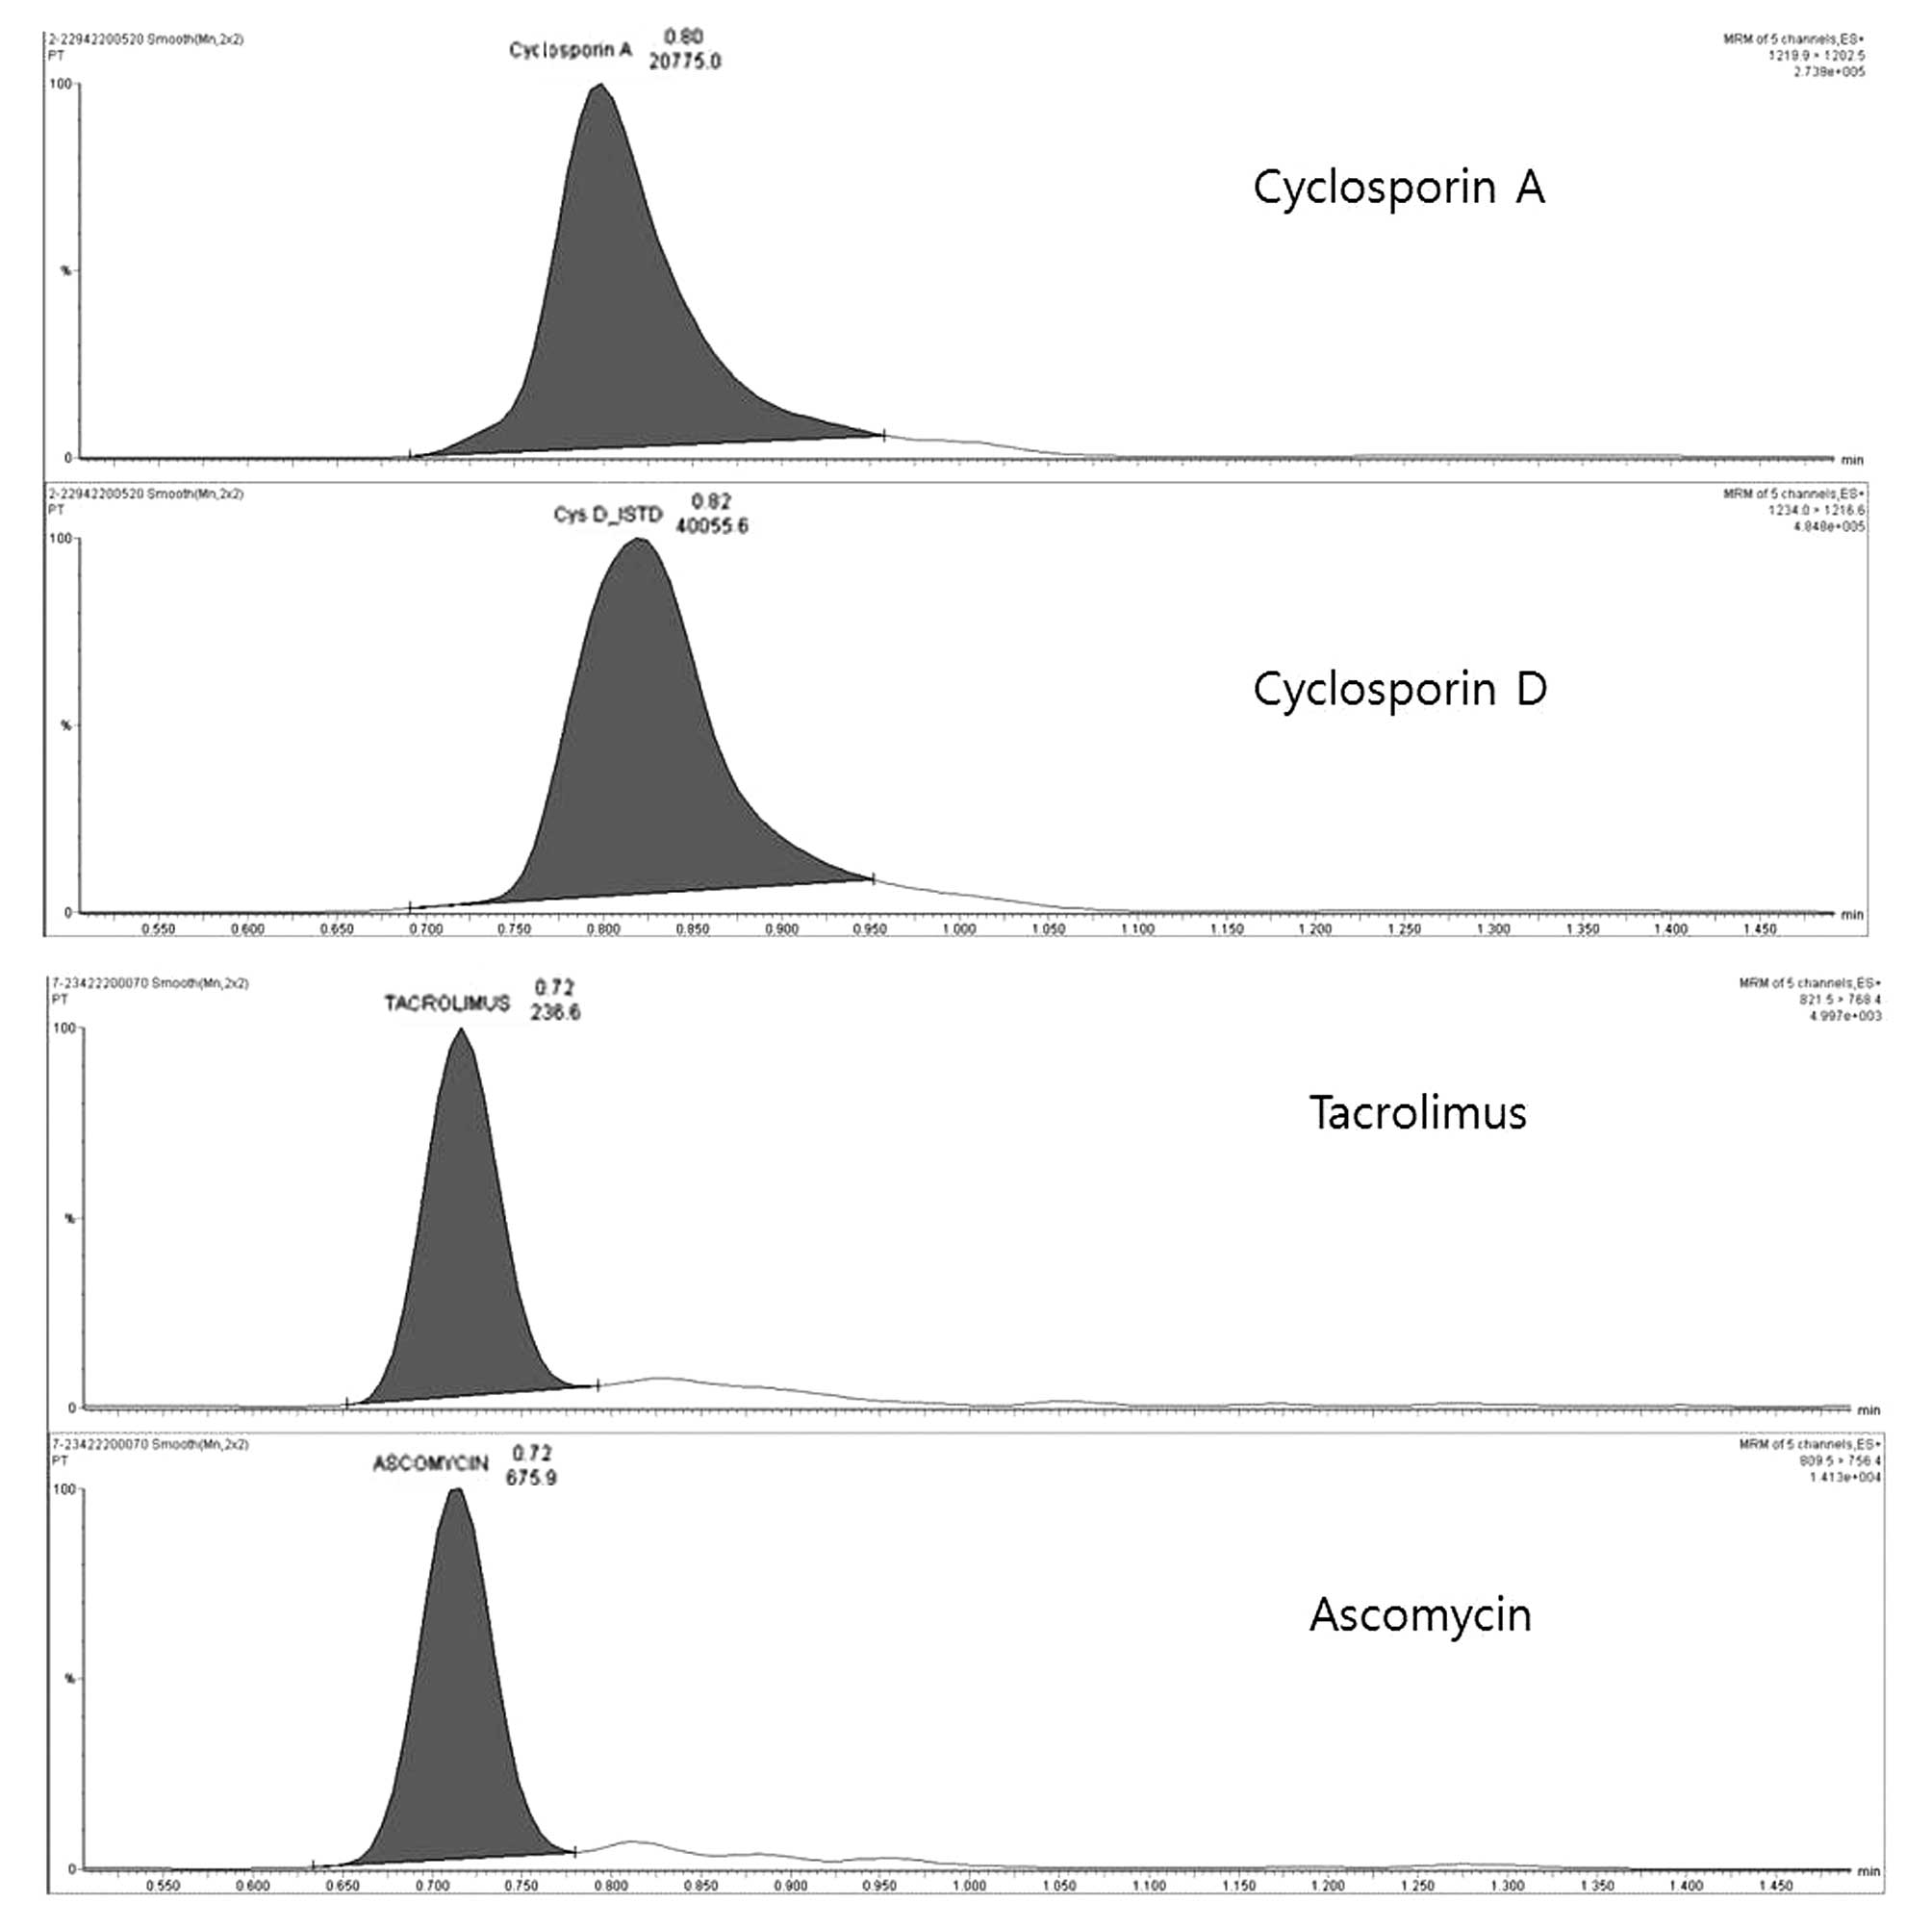
Chromatograms of cyclosporin A and
tacrolimus using UPLC-TMS
Four isolated peaks were chromatographically
separated, corresponding to cyclosporin A and tacrolimus with their
internal standards, as shown in Fig.
1. The retention times of cyclosporin A and tacrolimus were
0.80 and 0.74 min, respectively. These are identical to the
retention times of the calibration and internal standards (Fig. 1).
Performance validation of UPLC-TMS
The assay precision performance is summarized in
Table I, which shows within-run
and between-run quality control precision. Overall, the CVs were
less than the maximum CV tolerated and widely accepted for drug
measurements (15%) and showed a bias of <5% (13).
 | Table IWithin- and between-run precision for
cyclosporin A and tacrolimus control materials. |
Table I
Within- and between-run precision for
cyclosporin A and tacrolimus control materials.
| | Within-run | Between-run |
|---|
| |
|
|
|---|
| Material | Target (ng/ml) | Mean (ng/ml) | SD | CV (%) | Mean (ng/ml) | SD | CV (%) |
|---|
| Cyclosporin A |
| Level 1 | 53.0 | 53.2 | 2.1 | 3.9 | 53.6 | 2.4 | 4.4 |
| Level 2 | 261.0 | 251.0 | 9.5 | 3.8 | 244.4 | 10.3 | 4.2 |
| Level 3 | 495.0 | 485.9 | 25.4 | 5.2 | 479.0 | 29.6 | 6.2 |
| Level 4 | 1140.0 | 1121.6 | 51.9 | 4.6 | 1105.6 | 62.4 | 5.6 |
| Tacrolimus |
| Level 1 | 2.8 | 2.8 | 0.11 | 3.9 | 2.8 | 0.14 | 5.0 |
| Level 2 | 7.8 | 7.7 | 0.31 | 4.0 | 7.6 | 0.38 | 5.0 |
| Level 3 | 15.5 | 15.4 | 0.70 | 4.5 | 15.5 | 0.81 | 5.2 |
| Level 4 | 32.6 | 32.6 | 2.36 | 7.2 | 32.6 | 2.59 | 7.9 |
The LOD and LOQ were 2.0 ng/ml (CV, 20.5) and 2.5
ng/ml (CV, 16.0%), respectively, for cyclosporin A. The LOD and LOQ
were 0.3 ng/ml (CV, 21.1%) and 0.4 ng/ml (CV, 18.1%), respectively,
for tacrolimus.
Interference from the matrix was not observed. The
ion suppression tests showed that neither of the immunosuppressant
drugs exhibited ion suppression at their elution times. Throughout
the run, the sensitivity increased due to the increasing methanol
concentration in the gradient.
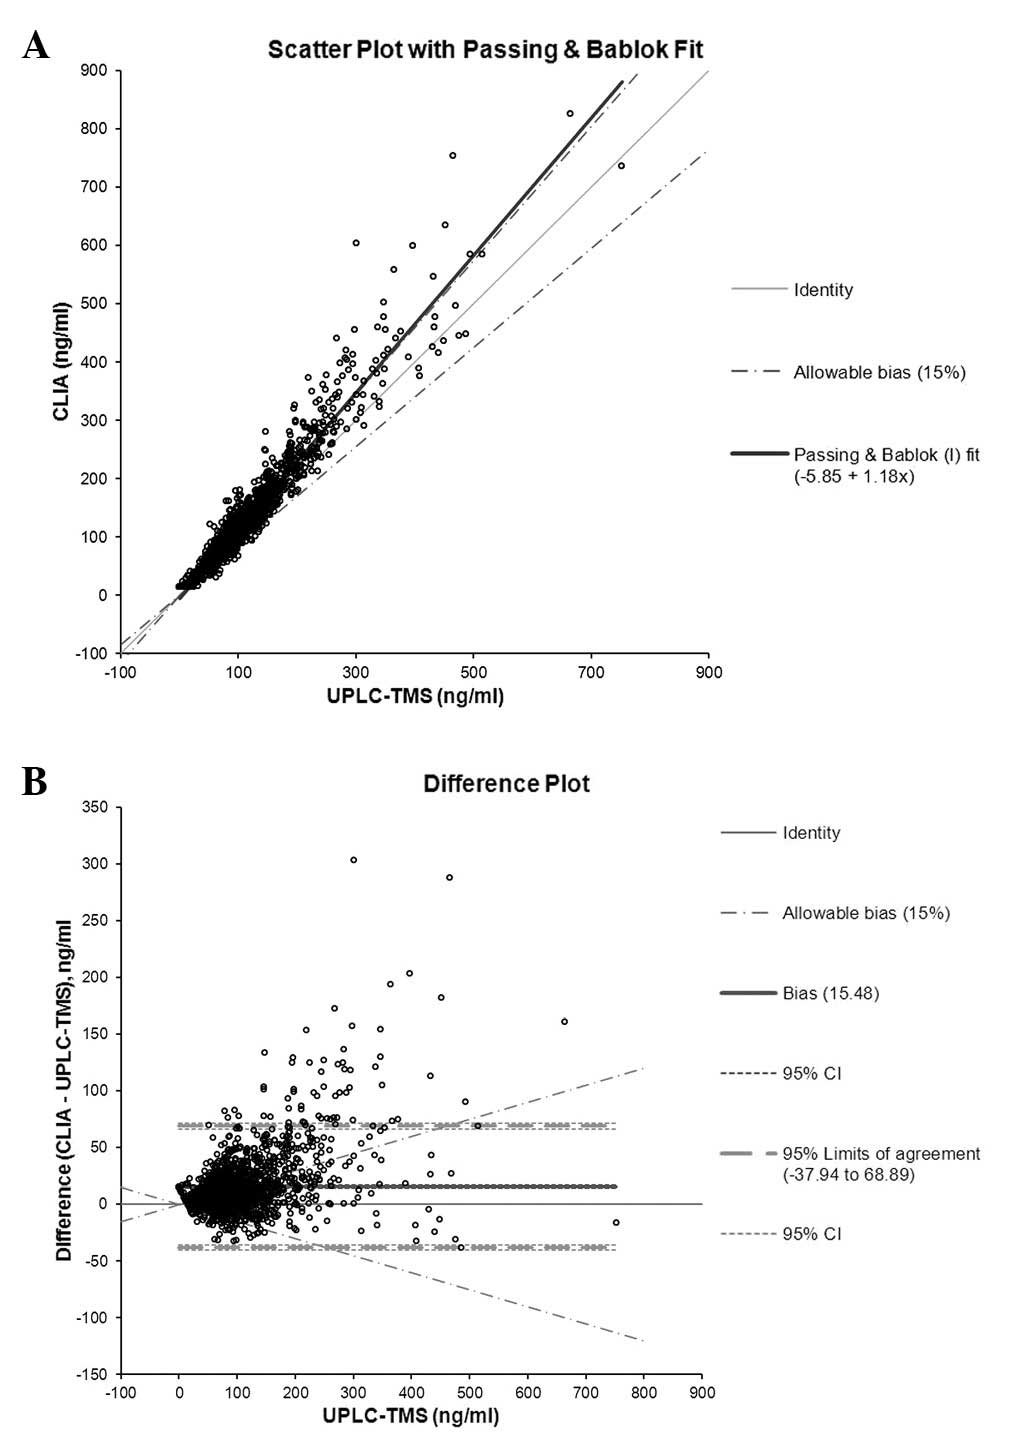
In the comparative study, the results of UPLC-TMS
measurements were comparable to those of CLIA by Passing and Bablok
regression analysis. The slope of Concentration(CLIA)
was 1.18, the intercept was −5.85 [(Concentration(CLIA)
= 1.18 × UPLC-TMS – 5.85; 95% CI: proportional, 1.16–1.19;
constant, −6.86–(−4.81)] and the mean difference between the two
methods was 15.5 ng/ml (95% CI: proportional, 14.1–16.8) for
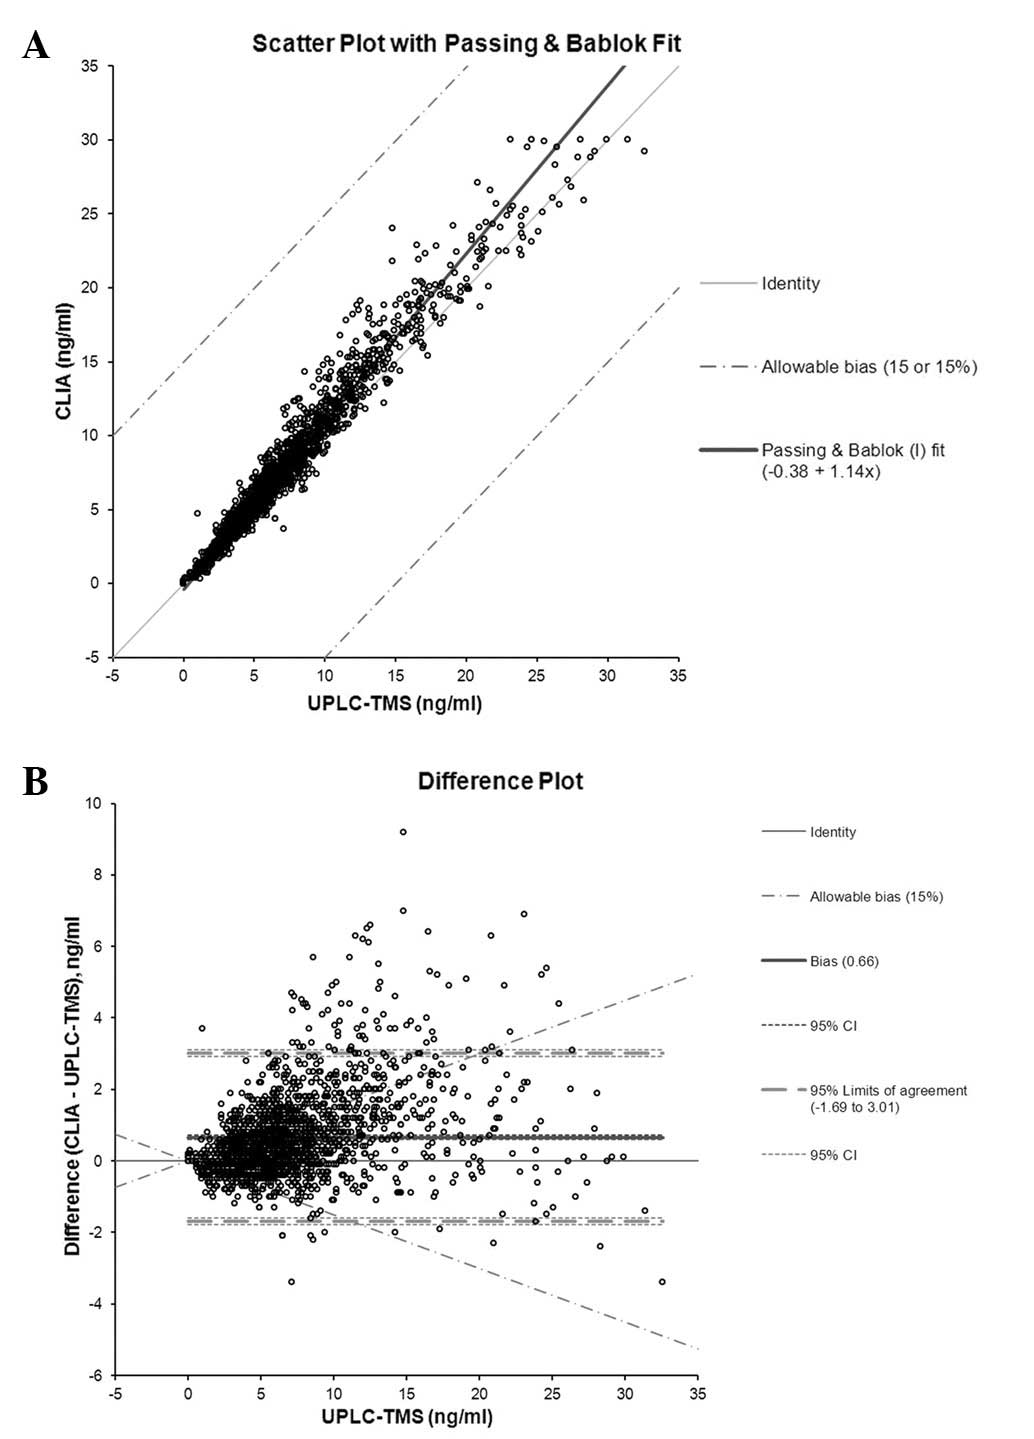
cyclosporin A, based on the Bland-Altman plot (Fig. 2). For tacrolimus, the slope of
Concentration(CLIA) was 1.14, the intercept was −0.38
[Concentration(CLIA) = 1.14 × UPLC-TMS – 0.38, 95% CI:
proportional, 1.13–1.14; constant, −0.35–(−0.43)] and the mean
difference between the two methods was 0.66 ng/ml (95% CI 0.60 to
0.71) (Fig. 3). There was a
systematic deviation in the blood levels measured by UPLC-TMS
compared with those measured by CLIA for the two drugs. For
cyclosporin A, the concentrations measured by UPLC-TMS were ~18%
lower than those measured by CLIA. For tacrolimus, the
concentrations measured by UPLC-TMS were ~14% lower. The majority
of the results were higher for the immunoassay than for
UPLC-TMS.
Discussion
The use of spectrometry-based technology for routine
quantitative immunosuppressant drug monitoring in clinical
laboratories is increasing. In this study, evaluation of the newly
developed high-throughput UPLC-TMS technique in the measurement of
cyclosporin A and tacrolimus in clinical samples was performed. The
method described in the present study was validated and shown to be
selective, rapid and robust with little interference from
compromising peaks.
Linearity was determined using 10 calibration curves
for the immunosuppressant drugs in whole blood. The calibration
concentrations covered the entire range of the expected patient
sample concentrations. The calibration curves were linear for
cyclosporin A, and tacrolimus was within the calibration range. The
R2 coefficients for the calibration curves were >0.99
for the two drugs.
The LODs allowed the concentration of each analyte
to be measured with accuracy and precision. Thus, the described
methods exhibited sufficient sensitivity for diagnostic purposes.
The 2007 European Consensus Conference on Tacrolimus Optimization
recommended the use of tacrolimus assays with an LOQ of <1.0
ng/ml to support low dose tacrolimus therapy monitoring (14).
The within- and between-run precision analysis of
the UPLC-TMS method showed that the values of cyclosporin A and
tacrolimus obtained had a CV of <8.0% per drug, which is
consistent with data reported by the manufacturer of the UPLC-TMS
system.
A comparative analysis of >3,400 patient samples
was conducted with CLIA. As expected, in the majority of the blood
samples, the levels of cyclosporin A and tacrolimus were
systematically higher when measured by CLIA, due to significant
metabolite or structural analogue cross-reactivity; however,
reading variability was also dependent upon sample collection time
and individual metabolic characteristics. Therefore, these
confounding factors contribute to the difficulty associated with a
UPLC-TMS correlational study.
The concentrations measured by UPLC-TMS were
observed to be ~18% lower than those measured by CLIA for
cyclosporin A. The gradient is the primary reason for this
deviation. In addition, similar results for cyclosporin were
demonstrated in a previous study (15).
For tacrolimus, however, varying results from
comparisons of UPLC-TMS and CLIA have been reported (13,16).
Such variations may be in part due to differences in patient
population. These factors suggest a requirement for more accurate
drug measurement methods. Thus, the high selectivity of the
UPLC-TMS method may prevent the overestimation of drug
concentrations in patient samples.
In the present study, the newly developed UPLC-TMS
method was shown to perform well for a wide range of therapeutic
immunosuppressant drug concentrations. In addition, the sample
preparation was simple and the method allowed the assay of multiple
drugs simultaneously, while also being high-throughput. Thus,
UPLC-TMS used in this capacity significantly lowers the cost of
analysis. In conclusion, this method may improve the accuracy,
speed and expense associated with the routine measurement of
immunosuppressive drug concentrations in whole blood compared with
other typical immunoassays.
Acknowledgements
This study was supported by the Soonchunhyang
University Research Fund.
References
|
1
|
Ferrara JL and Deeg HJ: Graft-versus-host
disease. N Engl J Med. 324:667–674. 1991. View Article : Google Scholar : PubMed/NCBI
|
|
2
|
Kahan BD, Keown P, Levy GA and Johnston A:
Therapeutic drug monitoring of immunosuppressant drugs in clinical
practice. Clin Ther. 24:330–350. 2002. View Article : Google Scholar : PubMed/NCBI
|
|
3
|
Jusko WJ, Thomson AW, Fung J, et al:
Consensus document: therapeutic monitoring of tacrolimus (FK-506).
Ther Drug Monit. 17:606–614. 1995. View Article : Google Scholar : PubMed/NCBI
|
|
4
|
Ansermot N, Fathi M, Veuthey JL, Desmeules
J, Rudaz S and Hochstrasser D: Simultaneous quantification of
cyclosporine, tacrolimus, sirolimus and everolimus in whole blood
by liquid chromatography-electrospray mass spectrometry. Clin
Biochem. 41:728–735. 2008. View Article : Google Scholar
|
|
5
|
Chung JW, An D, Song J, et al: Performance
evaluation of affinity column mediated immunometric assay for
tacrolimus. Korean J Lab Med. 29:415–422. 2009.(In Korean).
|
|
6
|
Oellerich M and Armstrong VW: The role of
therapeutic drug monitoring in individualizing immunosuppressive
drug therapy: recent developments. Ther Drug Monit. 28:720–725.
2006. View Article : Google Scholar : PubMed/NCBI
|
|
7
|
Taylor PJ: Therapeutic drug monitoring of
immunosuppressant drugs by high-performance liquid
chromatography-mass spectrometry. Ther Drug Monit. 26:215–219.
2004. View Article : Google Scholar : PubMed/NCBI
|
|
8
|
Poquette MA, Lensmeyer GL and Doran TC:
Effective use of liquid chromatography-mass spectrometry (LC/MS) in
the routine clinical laboratory for monitoring sirolimus,
tacrolimus, and cyclosporine. Ther Drug Monit. 27:144–150. 2005.
View Article : Google Scholar
|
|
9
|
Korecka M, Solari SG and Shaw LM:
Sensitive, high throughput HPLC-MS/MS method with on-line sample
clean-up for everolimus measurement. Ther Drug Monit. 28:484–490.
2006. View Article : Google Scholar : PubMed/NCBI
|
|
10
|
Christians U, Jacobsen W, Serkova N, et
al: Automated, fast and sensitive quantification of drugs in blood
by liquid chromatography-mass spectrometry with on-line extraction:
immunosuppressants. J Chromatogr B Biomed Sci Appl. 748:41–53.
2000. View Article : Google Scholar : PubMed/NCBI
|
|
11
|
Deters M, Kirchner G, Resch K and Kaever
V: Simultaneous quantification of sirolimus, everolimus, tacrolimus
and cyclosporine by liquid chromatography-mass spectrometry
(LC-MS). Clin Chem Lab Med. 40:285–292. 2002. View Article : Google Scholar : PubMed/NCBI
|
|
12
|
Ceglarek U, Lembcke J, Fiedler GM, et al:
Rapid simultaneous quantification of immunosuppressants in
transplant patients by turbulent flow chromatography combined with
tandem mass spectrometry. Clin Chim Acta. 346:181–190. 2004.
View Article : Google Scholar : PubMed/NCBI
|
|
13
|
Wallemacq P, Goffinet JS, O’Morchoe S, et
al: Multi-site analytical evaluation of the Abbott ARCHITECT
tacrolimus assay. Ther Drug Monit. 31:198–204. 2009. View Article : Google Scholar : PubMed/NCBI
|
|
14
|
Wallemacq P, Armstrong VW, Brunet M, et
al: Opportunities to optimize tacrolimus therapy in solid organ
transplantation: report of the European consensus conference. Ther
Drug Monit. 31:139–152. 2009. View Article : Google Scholar : PubMed/NCBI
|
|
15
|
Napoli KL: 12-hour area under the curve
cyclosporine concentrations determined by a validated liquid
chromatography-mass spectrometry procedure compared with
fluorescence polarization immunoassay reveals sirolimus effect on
cyclosporine pharmacokinetics. Ther Drug Monit. 28:726–736. 2006.
View Article : Google Scholar
|
|
16
|
Wang S, Magill JE and Vicente FB: A fast
and simple high-performance liquid chromatography/mass spectrometry
method for simultaneous measurement of whole blood tacrolimus and
sirolimus. Arch Pathol Lab Med. 129:661–665. 2005.PubMed/NCBI
|
|
17
|
Kaptein EM, Yi SS, Endres DB, Kaptein JS
and Chan LS: Vitamin D deficiency in urban indigent patients in
Southern California. Endocr Pract. 19:404–413. 2013. View Article : Google Scholar : PubMed/NCBI
|