Introduction
Approximately 1.5 million individuals develop
pleural effusions (PEs) in the USA each year (1). PE is the abnormal accumulation of
fluid between the two layers of pleura resulting from disruption of
the homeostatic forces that control the flow into and out of the
area. The accumulation of PEs is associated with numerous medical
conditions; the most common conditions that cause PE are cardiac
failure, pneumonia and malignant neoplasm disease (2–4).
Diagnosis of a PE begins with obtaining the patient’s clinical
history and performing a physical examination, and is followed by
chest radiography and the analysis of pleural fluid in appropriate
instances. Thoracentesis is routinely performed on patients with
PE; the aspirated pleural fluid is usually sent for biochemical,
microbiological and cytological analyses, with the first being
readily available for decision-making (5). In clinical practice, PEs are
classified as transudates or exudates, according to the biochemical
characteristics of the fluid. Grouping PEs into transudates and
exudates does not attach a specific label to the disease. Certain
experts, including Light (1), have
recommended focusing research on the identification of specific
pleural disease markers rather than spending excessive time and
resources in transudate -exudate differentiation. For further
testing, malignant and benign effusions are often a diagnostic
challenge. The diagnosis of a PE is not always straightforward,
particularly when patients have coexisting heart failure, infection
(6,7) or malignancy (5,8–10).
Conventional leukocyte counts, effusion cell and differential
counts, and Light’s criteria do not provide adequate information
(11–14). Microbiological studies may provide
more definitive results; however, the diagnosis yield rate is ~60%
and the long turnaround time may result in a delayed diagnosis
(3,5,15).
Cytological examination of pleural fluid is a convenient and
relatively efficient method for establishing the diagnosis of
pleural malignancy. However, pleural fluid cytology is positive in
only 50% of cases, leading to the requirement for further
diagnostic tests (16). In
clinical practice a variety of laboratory tests are in use for the
differential diagnosis of PE; nevertheless, the efficiency of these
measurements is not always sufficient to establish a diagnosis
(1,17). Thus, the requirement for biomarkers
that may aid in this differentiation is imperative.
In recent years, the development of disease-specific
diagnostic biomarkers for common causes of PE has become an area of
active research. PEs that are secondary to malignancy or infection
usually have similar biochemical profiles, but certain biomarkers
may have potential diagnostic value. These include PA (18) and CRP (14,15,19),
which have been recently used to improve the differentiation
between benign PE (BPE) and MPE. CRP is an acute-phase reactant
produced primarily by hepatocytes, whose production is induced by
systemic inflammation of either infectious or noninfectious origin
(14,15). PA is a carrier of thyroxin and
retinol (vitamin A), is a well-known negative acute-phase protein
and is downregulated during inflammation (18).
At present, none of the proposed disease-specific
biomarkers have gained widespread acceptance (5). Few studies have investigated the
diagnostic role of pleural fluid PA (18) and CRP (14) in the etiology of PE, so there is
little evidence available and the external validity has not been
adequately analyzed. Additional studies are necessary to evaluate
the roles of these biomarkers, individually and in combination, in
the diagnosis of PE. Measurement of these two biomarkers is simple,
rapid and cheap in the laboratory. Therefore, the primary aim of
this study was to distinguish between infectious PE and MPE by
measuring the levels of the two major acute phase response
biomarkers, PA and CRP.
Materials and methods
Ethics statement
Ethical approval for this study was granted from the
Affiliated Dongyang Hospital of Wenzhou Medical University Human
Investigation Ethics Committee (Dongyang, China) and all patients
provided written informed consent for enrolment into the study.
Subjects and sample collection
PE specimens were prospectively collected from 209
patients who presented at the Affiliated Dongyang Hospital of
Wenzhou Medical University between September 2012 and May 2013. The
etiology of PE was based on accepted criteria (20); MPE was diagnosed by the
identification of malignant cells in pleural fluid or pleural
biopsy during cytological or histological examinations. Patients
with infectious PE were divided into two subgroups: tuberculous PE
(TBPE) and parapneumonic PE (PNPE). TBPE was diagnosed with the
presence of positive stain or culture for Mycobacterium
tuberculosis in the pleural fluid, sputum or pleural biopsy, or
the presence of typical caseating granulomas in the pleural biopsy.
PNPE was characterized by any PE associated with pneumonia and a
response to antibiotics; patients with pleural empyema were also
included in this group. Patients with PE that showed no evidence of
MPE, TBPE or PNPE were classified as chronic non-specific PE
(NSPE). Exclusion criteria included hyperlipidemia, coronary heart
disease, central nervous system diseases, such as intracranial
tumors or Alzheimer’s disease, cholelithiasis and liver disease.
The baseline demographic characteristics of the patients are
summarized in Table I. Samples of
the pleural fluid from the participants were frozen at −80°C until
analysis.
 | Table ISubject characteristics. |
Table I
Subject characteristics.
| Group | Enrolled subjects
(n) | Age (years) (mean ±
SD) | Male gender n
(%) |
|---|
| MPE | 47 | 70±11 | 29 (61.7)b |
| Lung
adenocarcinoma | 22 | 71±15 | 13 (59.1) |
| Mesothelioma | 5 | 62±14 | 3 (60.0) |
| Other lung
carcinoma | 7 | 62±19 | 4 (57.1) |
| Metastatic
carcinoma | 13 | 54±17 | 9 (69.2) |
| TBPE | 53 | 54±22a | 33 (62.3)b |
| PNPE | 51 | 50±16a | 28 (54.9)b |
| NSPE | 58 | 53±17a | 32 (55.2)b |
| Total | 209 | 56±16 | 122 (58.4) |
Biochemical analyses and differential
cell counts
The demographic variables, the values of biochemical
parameters in the pleural fluid and the levels of PA and CRP were
analyzed prior to the start of treatment. The biochemical
parameters were as follows: differential cell counts, pH, total
proteins, lactate dehydrogenase (LDH), glucose, total cholesterol
(TC), triglycerides (TG) and adenosine deaminase (ADA). In
addition, if a patient had been submitted to repeated
thoracentesis, only the results of the first were considered. The
biomarker levels in the pleural fluid were determined using a
Hitachi 7600 clinical analyzer (Hitachi, Tokyo, Japan). The pH
readings were obtained using a selective electrode in various
standard blood-gas analyzers (Radiometer, Bronshoj, Denmark).
Differential cell counts were detected using a Sysmex XE-2100
Automated Hematology system (Sysmex, Kobe, Japan). In addition,
cytological examination of PEs on pleural fluid smears was
performed following Wright’s staining.
Statistical analysis
Results are presented as mean ± standard deviation
or median and interquartile range (IQR), depending on the
distribution. Univariate comparisons of continuous variables were
performed using an unpaired Student’s t-test for normally
distributed data, or nonparametric Mann-Whitney U test for
non-normally distributed variables. For multiple comparisons of
several groups, ANOVA or a Kruskal-Wallis test were performed. For
comparing categorical data, a chi-square test was performed.
Spearman’s rank correlation coefficient was used to investigate the
association between PA and CRP in each group. The receiver
operating characteristics (ROC) analysis was used to determine the
optimum cutoff value for the studied diagnostic markers.
Furthermore, the accuracy of pleural fluid biomarkers in
distinguishing between infectious and malignant PE was established
by calculating sensitivity, specificity, positive predictive values
(PPVs) and negative predictive values (NPVs). P<0.05 was
considered to indicate a statistically significant result. All
statistical calculations were performed using the SPSS 13.0 for
Windows (SPSS, Inc., Chicago, IL, USA).
Results
Demographic characteristics of the study
subjects
The study subjects included 122 men and 87 women
with a mean age of 56 years. One hundred and three patients had a
history of smoking and 37 had a previous history of cancer (17 MPE
patients, 6 TBPE patients, 8 PNPE patients and 6 NSPE patients).
Among the 47 patients with MPE, 22 (47%) had a positive cytology in
the initial thoracentesis examination; in the remaining 25
patients, MPE was finally confirmed by repeated cytological
analysis or histological examination of pleural biopsy. Of the 25
patients with an initial negative cytology, eight had positive
cytology in the second thoracentesis examination, 10 had positive
cytology in the third thoracentesis, four had positive cytology in
the fourth thoracentesis and three achieved a positive histology
result in the pleural biopsy. The demographic characteristics of
the study subjects are presented in Table I. The mean age of the MPE group was
higher than those of the TBPE, PNPE and NSPE groups. There were no
significant differences among the four groups with regard to
subject gender ratios.
Basic characteristics of pleural fluid
samples
The basic characteristics of the pleural fluid
samples are recorded in Table II.
A Kruskal-Wallis test was employed to compare pleural markers among
the four groups (P<0.05) and this was followed by the
Mann-Whitney U test to evaluate the differences between each two
groups. The median leukocyte concentration in the infectious PE
group was higher than that in the MPE group. The levels of
neutrophils (%) in the PNPE group were significantly higher than
those in the other groups, and the levels of lymphocytes (%) and
ADA in the TBPE group were significantly higher than those in the
other groups. No significant differences in the levels of glucose
and LDH were identified between the MPE and infectious PE groups.
The levels of albumin (ALB) and TC in the MPE and TBPE groups were
significantly higher than those in the other two groups. The
comparison of conventional pleural markers between infectious PEs
and MPEs presented similar results to those in previous reports
(14,15). However, the levels of TG were
significantly different among the four groups as revealed by the
Mann-Whitney U test.
| Table IIBasic characteristics of pleural
fluid samples. |
Table II
Basic characteristics of pleural
fluid samples.
| Pleural
markers | MPE (n=47) | TBPE (n=53) | PNPE (n=51) | NSPE (n=58) | P-valuea |
|---|
| Leukocytes
(/μl) | 1360
(500–2100)d | 3100
(1930–3900)c | 3000
(1220–4600)c | 450
(225–1100)e | <0.01 |
| Neutrophils
(%) | 10 (6–20)d | 3 (2–10)e | 82 (65–91)c | 9 (5–25)d | <0.01 |
| Lymphocytes
(%) | 60 (32–78)d | 78 (62–89)c | 11 (3–22)f | 30 (15–41)e | <0.01b |
| Glucose
(mmol/l) | 6.0
(3.8–7.6)d | 5.1
(4.4–5.9)e | 6.4
(5.5–8.0)d | 8.1
(7.4–9.1)c | <0.01 |
| Proteins (g/l) | 43 (31–49)d | 49 (43–53)c | 26 (17–41)e | 22 (17–31)e | <0.01 |
| ALB (g/l) | 30 (19–35)c | 29 (25–32)c | 15 (10–25)d | 14 (12–22)d | <0.01 |
| TC (mmol/l) | 2.01
(1.29–2.65)c | 2.23
(1.85–2.49)c | 0.94
(0.57–1.40)d | 0.75
(0.49–1.27)d | <0.01 |
| TG (mmol/l) | 0.31
(0.17–0.48)d | 0.37
(0.25–0.53)c | 0.21
(0.16–0.35)e | 0.12
(0.07–0.20)f | <0.01b |
| LDH (IU/l) | 361
(162–486)c | 374
(285–518)c | 206
(139–986)c | 122
(78–189)d | <0.01 |
| ADA (U/l) | 12 (7–30)d | 64 (43–87)c | 8 (5–25)d | 7 (5–23)d | <0.01 |
| pH | 7.41
(7.30–7.48)c | 7.38
(7.29–7.49)c | 7.28
(7.12–7.44)d | 7.43
(7.36–7.51)c | <0.01 |
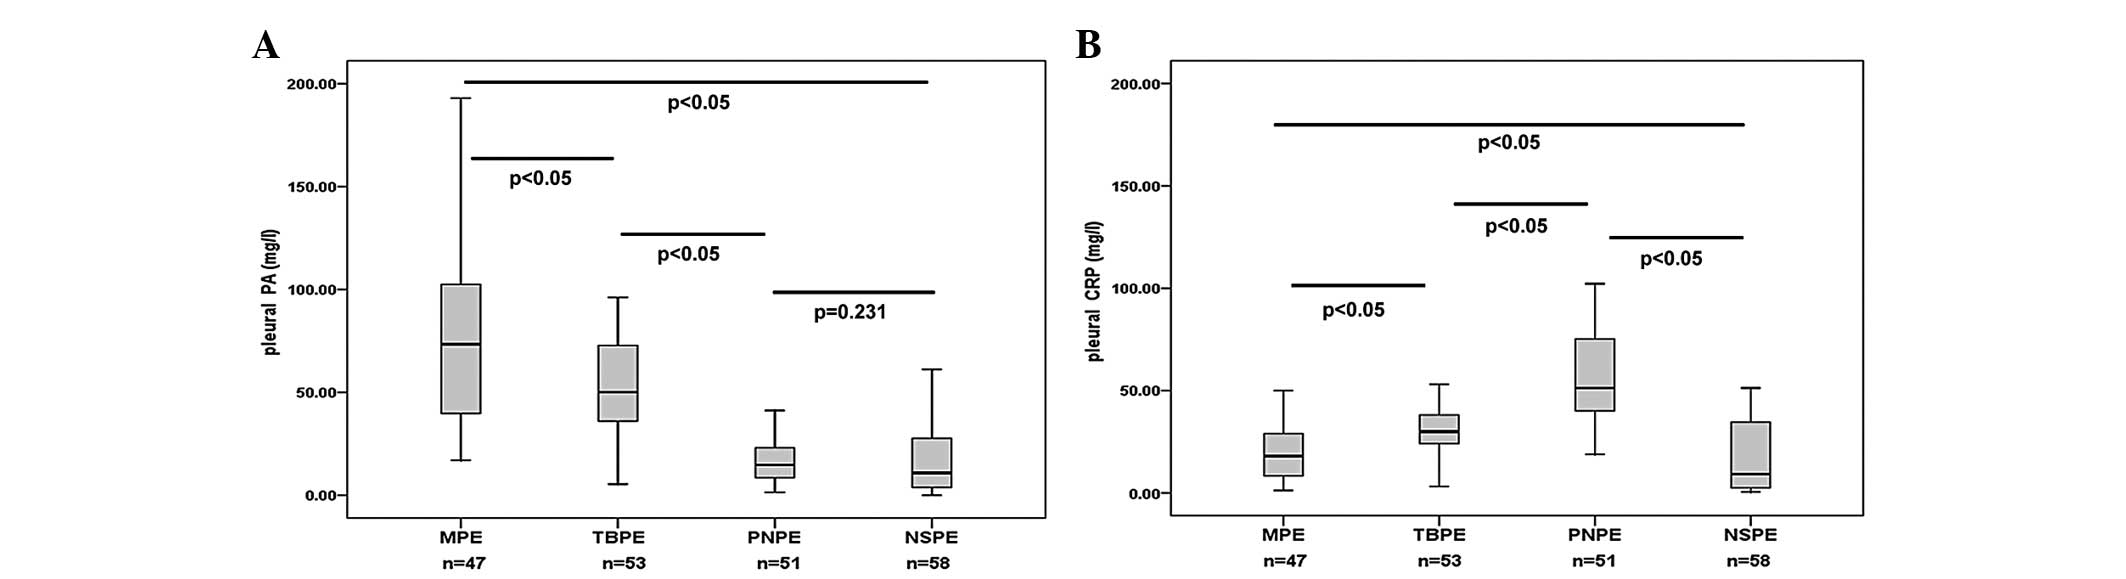
Levels of PA and CRP in pleural
fluid
The median level of PA in the pleural fluid was
highest in the MPE group (73 mg/l), followed by the TBPE (50 mg/l),
PNPE (15 mg/l) and NSPE (11 mg/l) groups; the difference in pleural
fluid PA levels between the PNPE and NSPE groups was not observed
to be significant (Fig. 1A). The
median level of CRP in the pleural fluid was highest in the PNPE
group (52 mg/l), followed by the TBPE (30 mg/l), MPE (18 mg/l) and
NSPE (9 mg/l) groups. No significant differences were observed
between pleural fluid CRP levels in the MPE and NSPE groups
(Fig. 1B).
Correlation between PA and CRP in pleural
fluid
Spearman’s correlation test was performed to analyze
the correlation between PA and CRP. In the correlation analysis of
patients with PEs (Fig. 2), the
levels of pleural fluid PA correlated with the pleural fluid CRP
levels in the enrolled subjects with a statistically significant
correlation coefficient of −0.250 (Fig. 2A). Spearman’s correlation analysis
was also conducted to investigate the correlation between pleural
fluid PA and CRP in infectious PE and MPE. A statistically
significant negative correlation was identified (r=−0.352; P=0.015)
in the MPE group (Fig. 2B).
However, there was a non-statistically significant negative
correlation (r=−0.198; P=0.155) in the TBPE group (Fig. 2C). Pleural fluid PA levels were
significantly negatively correlated with pleural fluid CRP levels
with a correlation coefficient of −0.492 in the PNPE group
(Fig. 2D).
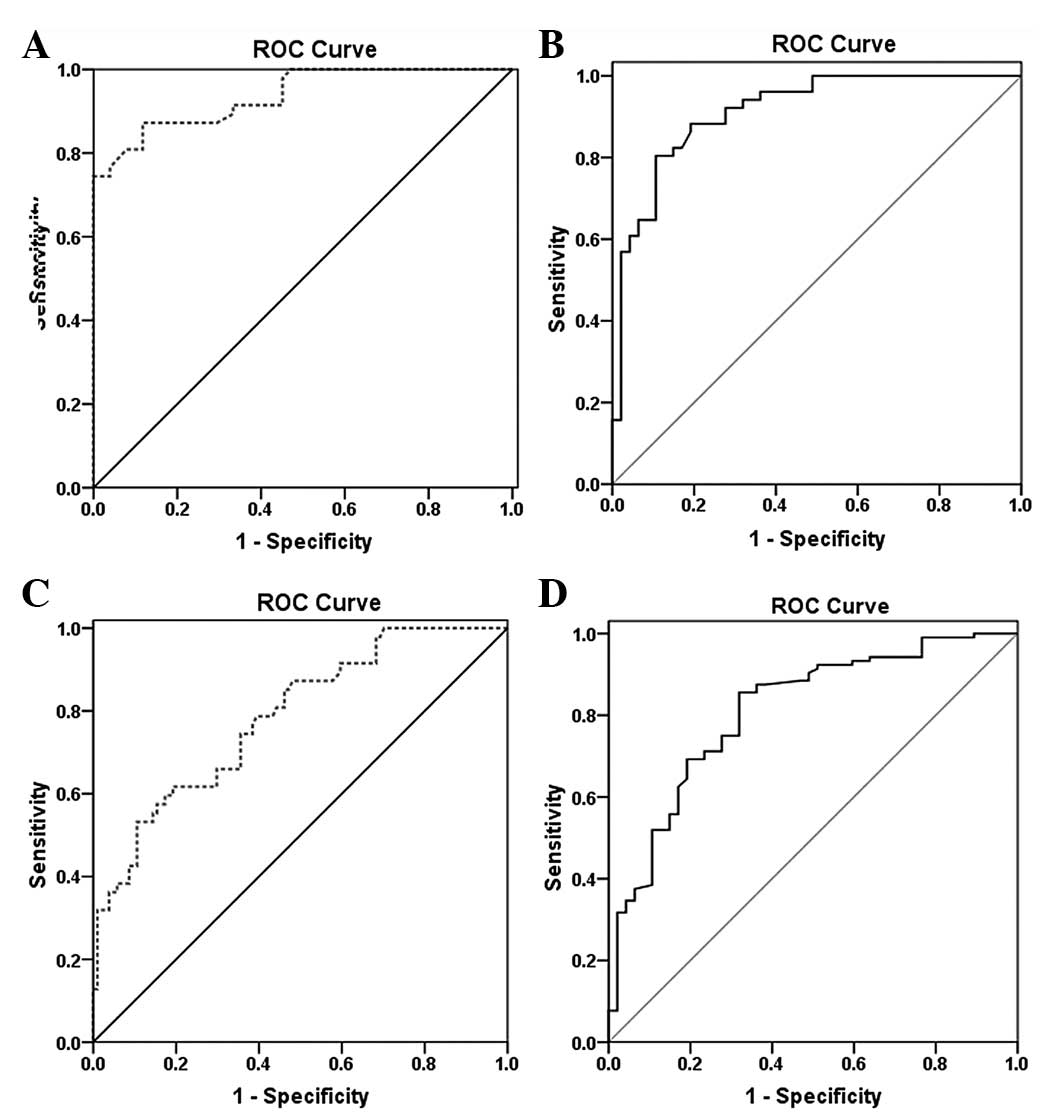
Diagnostic values of PA and CRP in
pleural fluid
In ROC curve analysis to discriminate between MPE
and PNPE (Fig. 3A and B), pleural
fluid PA and CRP levels were demonstrated to have high diagnostic
accuracy for discriminating MPE and PNPE. The AUC of pleural fluid
CRP [0.913 (95% CI, 0.857–0.969)] tended to be smaller than that of
pleural fluid PA [0.937 (95% CI, 0.891–0.982)]. However, the
overlapping 95% CI values for the two markers indicated that
neither was superior. If the analysis was expanded to patients with
infectious PE and MPE (Fig. 3C and
D), the diagnostic accuracy of pleural fluid PA (AUC, 0.784;
95% CI, 0.707–0.861) and CRP (AUC, 0.810; 95% CI, 0.736–0.885) for
discriminating between infectious PE and MPE tended to be lower
than the diagnostic accuracy for discriminating between MPE and
PNPE. For the analysis, the cutoffs for the pleural fluid PA and
CRP levels were 28.3 and 35.2 mg/l, respectively.
Predictors of MPE
The performances of pleural fluid PA and CRP at the
optimum cutoff values for differentiating between infectious and
malignant PE are listed in Table
III. CRP exhibited superior discriminative properties, yielding
an AUC ≥0.80. PA and CRP were potential predictors of MPE due to
low PPVs. The sensitivity, specificity, PPV and NPV for MPE when
the values for PA and CRP exceeded or did not meet the suggested
diagnostic cutoff values were calculated. If both tests were
positive, the specificity increased to 0.903. In particular, the
criteria of pleural fluid PA >28.3 mg/l and CRP <35.2 mg/l
had the highest PPV. However, if either test was positive, the
sensitivity for detecting MPE increased to 0.936. The corresponding
PPVs, NPVs and AUCs are shown in Table III.
| Table IIIPleural fluid PA and CRP levels for
the diagnosis of infectious and malignant PEs. |
Table III
Pleural fluid PA and CRP levels for
the diagnosis of infectious and malignant PEs.
| Biomarkers | Cutoff | Sensitivity | Specificity | PPV | NPV | AUC | P-value |
|---|
| PA | >28.3 mg/l | 0.851 | 0.548 | 0.460 | 0.890 | 0.784 | <0.05 |
| CRP | <35.2 mg/l | 0.856 | 0.680 | 0.680 | 0.856 | 0.810 | <0.05 |
| PA or CRP | PA >28.3 mg/l or
CRP <35.2 mg/l | 0.936 | 0.490 | 0.454 | 0.944 | - | - |
| PA and CRP | PA >28.3 mg/l
and CRP <35.2 mg/l | 0.617 | 0.903 | 0.743 | 0.854 | - | - |
Discussion
Clinical history and physical examination are
helpful for indicating the potential causes of PEs. However, the
accurate diagnosis and establishment of the causes of PE is an
ongoing challenge in daily clinical practice, despite the wide
variety of laboratory tests and complementary studies that been
carried out for the differential diagnosis of PE (2,9,21,22).
The analysis of soluble biomarkers from effusions may be a useful
adjunctive diagnostic tool. Considerable effort has been made to
develop a simple, inexpensive and noninvasive method for
distinguishing different types of PE in laboratory and clinical
settings (23–27). No standard biochemical approach has
yet been established. Ideal biomarkers should be easily measured at
a reasonable cost (analytical validity), sensitive and specific to
the disease state being examined, and aid in decision-making
(clinical usefulness) (28).
However, few fulfill these three criteria sufficiently to be used
clinically. Biomarkers such as PA and CRP have potential diagnostic
value due to their simple, rapid and cheap detection in the
clinical laboratory. The present study indicates that pleural fluid
PA and CRP are potentially powerful differential diagnostic tools
for infectious PE and MPE. In particular, these data are widely
available (as a part of the clinical detection conducted in the
laboratory) to the clinician at a low cost. To the best of our
knowledge, this is the first study to associate PA and CRP with
infectious and malignant PE.
Unlike previous studies (29,30),
which reported that the concentration of PA was lower in the sera
of cancer patients than in that of normal individuals, the present
study indicates that the median pleural fluid PA level was higher
in the MPE group (73 mg/l) compared with the levels observed in
patients with PE of other etiologies. However, no significant
differences between pleural fluid PA levels were identified between
the PNPE and NSPE groups; therefore, PA did not demonstrate any
diagnostic value for patients with PNPE and NSPE. Wang et al
(18) reported similar findings
from a clinical trial of patients with PE from lung cancer and
benign inflammatory disease; PA was overexpressed in PEs from
patients with lung cancer, but not from patients with benign
inflammatory disease. The median pleural fluid CRP level was higher
in the PNPE group (52 mg/l) compared with the levels observed in
patients with PE of other etiologies. However, there were no
significant differences between pleural fluid CRP levels in the MPE
and NSPE groups, so CRP did not demonstrate any diagnostic value
for patients with MPE and NSPE. Similar independent associations
have been revealed by previous studies evaluating the role of
pleural fluid CRP (15,17,19);
the highest pleural fluid CRP levels were observed in patients with
PNPE. However, the findings of the present study conflict with the
observations of Botana-Rial et al (14), who found no correlation between CRP
values in TBPE and MPE patients. Porcel et al (15) differentiated TBPE from MPE when CRP
levels in pleural fluid were >20 mg/l. The results of the
present study are similar, as the CRP levels in the pleural fluid
were higher in the TBPE group than in the MPE group (30 vs. 18
mg/l). Although the precise reasons for the difference in the
reported associations remain speculative, it is plausible that
differences in population characteristics, sample size and the
different detection methods used, may have been responsible.
PA is a nutritional marker used to evaluate recent
nutritional status with a short half-life and a rapid synthesis
rate, and it is also a negative acute-phase protein and inversely
associated with inflammation (31). CRP is one of the widely used
biomarkers for monitoring the course of infection and inflammation.
The results of the current study indicate that there was a weak
negative correlation between pleural fluid PA and CRP levels in the
enrolled subjects. Pinilla et al (32) demonstrated a strong correlation
between the ratio of CRP to PA and the severity of organ
dysfunction in critically ill patients. The present study also
investigated the correlation between pleural fluid PA and CRP
levels in MPEs and PNPEs. There was a statistically significant
negative correlation (r=−0.352) in the MPE group and a
statistically significant negative correlation with a correlation
coefficient of −0.492 in the PNPE group. It is uncertain whether
the high levels of PA in MPE are the consequence of the
pathological processes that take place or whether the increase in
PA participates in the induction of MPE. The pathophysiological
significance of the observations in the present study may be
investigated through serial measurements and further assessment of
these markers in a larger prospective study. These data provide
evidence supporting the measurement of CRP and PA levels as an
inexpensive and useful tool in the evaluation of PE.
The diagnostic sensitivity, specificity and AUCs of
PA levels in comparison with CRP levels for the diagnosis and
differential diagnosis of different types of PE were fully
investigated in the present study. It was observed that threshold
levels of PA and CRP without high PPV were insufficient for the
identification of MPE patients. For example, at the cutoff 28.3
mg/l, the sensitivity and specificity of PA were 0.851 and 0.548,
respectively, for the diagnosis of MPE. The AUC was 0.784 and the
PPV was 0.460. Used in a clinical situation, this means that 54% of
subjects would have a false positive result, while 15% of the
subjects with MPE would be missed. Choosing a low PA cutoff point
for clinical practice would lead to unnecessary tumor treatment for
a significant number of patients. Increasing the cutoff decreases
the false positive rate and improves the specificity of the test
measurement. It may be concluded that neither of the two variables
is satisfactory for the differential diagnosis of different types
of PE. Although the data have been shown to be of differential
value, they are of limited use. The most important limitation of
using individual fluid parameters in the discrimination process,
namely the lack of test sensitivity, may be resolved by using
either biomarker. For instance, the finding in the pleural fluid of
a CRP <35.2 mg/l or a PA>28.3 mg/l characterized MPE with a
sensitivity of 93.6%, thus increasing the sensitivity of each
individual analysis by 9%. Higher PPVs were achieved by combining
changes in PA and CRP, but still at the expense of sensitivity. For
example, CRP <35.2 mg/l and PA >28.3 mg/l resulted in a PPV
of 0.743, but the corresponding sensitivity was 0.617. Similar
values were observed with other combinations of different threshold
levels.
The limitations of this study require consideration.
A relatively small sample size may cause a certain bias of the
results. Patients with MPE from different primary tumors were
included, which may influence the detection result of these
molecular markers. In addition, the lack of differentiation between
complicated and uncomplicated PNPE may affect the findings. Despite
the potential biases, the authors suggest that the strong
statistical significance of the results allows for optimism
regarding PA and CRP as potential biomarkers for diagnosing PE.
In conclusion, the use of pleural fluid PA and CRP
levels for the differential diagnosis of infectious and malignant
PE was assessed. The measurement of pleural fluid PA and CRP levels
may be a useful adjunctive test in PE, as a potential
differentiator between infectious PE and MPE.
Acknowledgements
This study was supported by the funds from Jinhua
Municipal Science and Technology Bureau, Zhejiang, China
(2012-3-083). The authors would like to thank the nurses, residents
and consultants from the Department of Respiratory Medicine
(Affiliated Dongyang Hospital of Wenzhou Medical University,
Dongyang, China), who were involved in the management of patients,
and the patients who participated in the study.
References
|
1
|
Light RW: Pleural effusions. Med Clin
North Am. 95:1055–1070. 2011. View Article : Google Scholar
|
|
2
|
Stathopoulos GT and Kalomenidis I:
Malignant pleural effusion: tumor-host interactions unleashed. Am J
Respir Crit Care Med. 186:487–492. 2012. View Article : Google Scholar : PubMed/NCBI
|
|
3
|
Muzumdar H: Pleural effusion. Pediatr Rev.
33:45–47. 2012. View Article : Google Scholar
|
|
4
|
Bays AM and Pierson DJ: Tuberculous
pleural effusion. Respir Care. 57:1682–1684. 2012. View Article : Google Scholar : PubMed/NCBI
|
|
5
|
McGrath EE and Anderson PB: Diagnosis of
pleural effusion: a systematic approach. Am J Crit Care.
20:119–128. 2011. View Article : Google Scholar : PubMed/NCBI
|
|
6
|
Sutherland JS, Garba D, Fombah AE, et al:
Highly accurate diagnosis of pleural tuberculosis by immunological
analysis of the pleural effusion. PLoS One. 7:e303242012.
View Article : Google Scholar : PubMed/NCBI
|
|
7
|
Ye ZJ, Yuan ML, Zhou Q, et al:
Differentiation and recruitment of Th9 cells stimulated by pleural
mesothelial cells in human Mycobacterium tuberculosis
infection. PLoS One. 7:e317102012. View Article : Google Scholar : PubMed/NCBI
|
|
8
|
Meveychuck A, Osadchy A, Chen B and
Shitrit D: Pleural effusion in chronic obstructive pulmonary
medicine (COPD) patients in a medical intensive care unit:
characteristics and clinical implications. Harefuah. 151:198–201.
2552012.(In Hebrew).
|
|
9
|
Froudarakis ME: Pleural effusion in lung
cancer: more questions than answers. Respiration. 83:367–376. 2012.
View Article : Google Scholar : PubMed/NCBI
|
|
10
|
Wang T, Lv M, Shen S, et al: Cell-free
microRNA expression profiles in malignant effusion associated with
patient survival in non-small cell lung cancer. PLoS One.
7:e432682012. View Article : Google Scholar : PubMed/NCBI
|
|
11
|
Morgensztern D, Waqar S, Subramanian J,
Trinkaus K and Govindan R: Prognostic impact of malignant pleural
effusion at presentation in patients with metastatic non-small-cell
lung cancer. J Thorac Oncol. 7:1485–1489. 2012. View Article : Google Scholar : PubMed/NCBI
|
|
12
|
Cha SI, Shin KM, Jeon KN, et al: Clinical
relevance and characteristics of pleural effusion in patients with
Mycoplasma pneumoniae pneumonia. Scand J Infect Dis.
44:793–797. 2012. View Article : Google Scholar : PubMed/NCBI
|
|
13
|
Fernández de Larrea C, Duplat A,
Giampietro F, et al: Diagnostic accuracy of immunological methods
in patients with tuberculous pleural effusion from Venezuela.
Invest Clin. 52:23–34. 2011.PubMed/NCBI
|
|
14
|
Botana-Rial M, Casado-Rey P,
Leiro-Fernández V, Andrade-Olivié M, Represas-Represas C and
Fernández-Villar A: Validity of procalcitonin and C-reactive
protein measurement when differentiating between benign and
malignant pleural effusion. Clin Lab. 57:373–378. 2011.PubMed/NCBI
|
|
15
|
Porcel JM, Bielsa S, Esquerda A,
Ruiz-González A and Falguera M: Pleural fluid C-reactive protein
contributes to the diagnosis and assessment of severity of
parapneumonic effusions. Eur J Intern Med. 23:447–450. 2012.
View Article : Google Scholar : PubMed/NCBI
|
|
16
|
Porcel JM: Pearls and myths in pleural
fluid analysis. Respirology. 16:44–52. 2011. View Article : Google Scholar : PubMed/NCBI
|
|
17
|
Wang Y, Chen Z, Chen J, et al: The
diagnostic value of apolipoprotein E in malignant pleural effusion
associated with non-small cell lung cancer. Clin Chim Acta.
421:230–235. 2013. View Article : Google Scholar : PubMed/NCBI
|
|
18
|
Wang Z, Wang C, Huang X, Shen Y, Shen J
and Ying K: Differential proteome profiling of pleural effusions
from lung cancer and benign inflammatory disease patients. Biochim
Biophys Acta. 1824:692–700. 2012. View Article : Google Scholar : PubMed/NCBI
|
|
19
|
Park DS, Kim D, Hwang KE, et al:
Diagnostic value and prognostic significance of pleural C-reactive
protein in lung cancer patients with malignant pleural effusions.
Yonsei Med J. 54:396–402. 2013. View Article : Google Scholar : PubMed/NCBI
|
|
20
|
Heffner JE: Diagnosis and management of
malignant pleural effusions. Respirology. 13:5–20. 2008.
|
|
21
|
Hyun TS, Barnes M and Tabatabai ZL: The
diagnostic utility of D2–40, calretinin, CK5/6, desmin and MOC-31
in the differentiation of mesothelioma from adenocarcinoma in
pleural effusion cytology. Acta Cytol. 56:527–532. 2012.
|
|
22
|
Bass LC, Dillard TA, Forseen CJ and Davis
WB: An unusual cause of massive pleural effusion. Am J Med Sci.
344:505–507. 2012. View Article : Google Scholar : PubMed/NCBI
|
|
23
|
Toworakul C, Kasitanon N, Sukitawut W,
Wichinun R and Louthrenoo W: Usefulness of pleural effusion
antinuclear antibodies in the diagnosis of lupus pleuritis. Lupus.
20:1042–1046. 2011. View Article : Google Scholar : PubMed/NCBI
|
|
24
|
Elsammak MY, Attia A, Hassan HA, Zaytoun
TM, Shorman M and Suleman M: Evaluation of pleural fluid human
epididymis 4 (HE4) as a marker of malignant pleural effusion.
Tumour Biol. 33:1701–1707. 2012. View Article : Google Scholar : PubMed/NCBI
|
|
25
|
Li J, Li ZN, Bao QL, Ge LP, Li XQ and Chen
P: Evaluation of pleural fluid survivin and XIAP for the diagnosis
of malignant pleural effusion. Tumour Biol. 33:1803–1810. 2012.
View Article : Google Scholar : PubMed/NCBI
|
|
26
|
Trapé J, Molina R, Sant F, et al:
Diagnostic accuracy of tumour markers in serous effusions: a
validation study. Tumour Biol. 33:1661–1668. 2012.PubMed/NCBI
|
|
27
|
Davidsen JR, Laursen CB and Madsen PH:
Measuring pH in pleural fluid is valuable when identifying the
cause of purulent pleural effusion. Ugeskr Laeger. 174:1469–1470.
2012.(In Danish).
|
|
28
|
Porcel JM: Pleural fluid biomarkers:
beyond the Light criteria. Clin Chest Med. 34:27–37. 2013.
View Article : Google Scholar : PubMed/NCBI
|
|
29
|
Lin MY, Liu WY, Tolan AM, Aboulian A,
Petrie BA and Stabile BE: Preoperative serum albumin but not
prealbumin is an excellent predictor of postoperative complications
and mortality in patients with gastrointestinal cancer. Am Surg.
77:1286–1289. 2011.PubMed/NCBI
|
|
30
|
Kawai H: Low perioperative prealbumin
level predicts early recurrence after curative pulmonary resection
for non-small cell lung cancer. World J Surg. 37:20062013.
View Article : Google Scholar
|
|
31
|
Guerra LT, Rosa AR, Romani RF, Gurski RR,
Schirmer CC and Kruel CD: Serum transferrin and serum prealbumin as
markers of response to nutritional support in patients with
esophageal cancer. Nutr Hosp. 24:241–242. 2009.PubMed/NCBI
|
|
32
|
Pinilla JC, Hayes P, Laverty W, Arnold C
and Laxdal V: The C-reactive protein to prealbumin ratio correlates
with the severity of multiple organ dysfunction. Surgery.
124:799–806. 1998. View Article : Google Scholar : PubMed/NCBI
|