Introduction
High-altitude pulmonary edema (HAPE) is a
life-threatening respiratory disease that occurs in previously
healthy people within 2–4 days of rapid ascent and exposure to an
altitude >2,500 m above sea level (1–3).
HAPE is a noncardiogenic pulmonary edema characterized by high
pressure in the pulmonary arteries, edema in pulmonary interstitial
tissues and alveoli and non-uniform pulmonary vasoconstriction,
which results in pulmonary capillary stress failure and a high
permeability type of edema (4,5).
Although the hypobaric hypoxia is a major trigger factor, the exact
mechanism underlying the development of HAPE remains unclear.
Previous studies have observed high levels of
inflammatory cells in the bronchoalveolar lavage fluid of patients
with HAPE (6–9). A marked increase in total cells, with
macrophages being predominant, along with elevated levels of
cytokines, including interleukin (IL)-6, IL-8 and tumor necrosis
factor-α has been identified (9).
Previous studies have identified changes in the levels of various
cytokines in the plasma of patients with HAPE, but have not shown
complete expression profiles (8–13).
Recently, proteomic analyses have greatly facilitated the
comprehensive cataloging of protein expression profiles, in not
only cell lines but also in clinical samples, including
serum/plasma, urine, spinal fluid, synovial fluid and tissues
(14). Certain scholars have
focused on determining the biomarkers in the plasma of patients
with HAPE (19–17). Proteomics is one of the most powerful
biological research techniques and has the potential to
simultaneously detect differentially expressed proteins (18).
In the present study, two-dimensional gel
electrophoresis (2-DE) was used to observe the plasma proteome
profile in the acute stage and the recovery phase in the same
patients with HAPE. The resulting gels were then compared to
identify proteins that were differentially expressed and the
proteins were determined by mass spectrometry. The comparison of
proteomic results between the acute stage and the recovery phase
was conducted to improve understanding of the pathogenic mechanisms
of HAPE and the developmental changes in the plasma proteome of
patients with HAPE during transition from the acute stage to the
recovery phase.
Material and methods
Patients
All patients with HAPE (n=20) had been hospitalized
in Yushu People’s Hospital (Yushu, China) between March and June
2012 due to the onset of HAPE within 1–3 days of arrival at Yushu
(3,760 m above sea level). The patients had arrived at the Yushu
area as construction workers following an earthquake (magnitude,
7.1) on April 4, 2010. The diagnosis of HAPE was based on chest
X-rays and standard diagnostic criteria, which was in accordance
with the Lake Louise scoring system (19). The patients met the criteria for
HAPE at the onset of the disorder and recovered promptly with
hospitalization. Examinations to exclude any additional diseases
were conducted in the hospital after their recovery. The patients
with HAPE were all Han-Chinese males who had been born and resided
at lowland levels. These individuals were healthy and had
previously shown no signs of sickness. A total of 20 highland
healthy Han-Chinese controls who were resistant to HAPE (HAPE-r),
were randomly selected from the coworkers of the patients with
HAPE, matching the patients in age, gender, ethnicity and working
conditions. These subjects remained healthy after working at Yushu
for ≥3 months, without suffering from HAPE or high altitude
cerebral edema. As lowland controls, 20 healthy Han-Chinese
individuals from Xining, China (2,260 m above sea level) were
randomly selected, matching the other two groups in age, gender,
ethnicity and working conditions. With informed consent from all
participants, 5 ml venous blood samples (with EDTA-Na as an
anticoagulant) were collected from each patient with HAPE in the
acute stage prior to treatment and in the recovery phase following
the termination of treatment. The whole blood was immediately
separated to blood cells and plasma by centrifuging at 1,500 × g
for 10 min and the plasma was stored in liquid nitrogen. The plasma
from three of the patients with HAPE in the acute stage and
recovery phase was processed by 2-DE differential display with
linear immobilized pH gradient (IPG) strips of 17 cm (pH range,
3.0–10.0). The remaining plasma was used for validation. The
specimens were then transported to Xining for the following
biochemical assays. The study was approved by the ethics committee
of Qinghai University School of Medicine (Xining, China).
2-DE materials
IPG strips (pH range, 3.0–10.0) were obtained from
Bio-Rad (Hercules, CA, USA). Mineral oil, urea, bromophenol blue,
3-[(3-cholamidopropyl)dimethylammonio]-1-propanesulfonate (CHAPS),
agarose, acrylamide, Bis, Tris, sodium dodecyl sulfate (SDS),
dithiothreitol (DTT), ammonium persulfate, iodoacetamide,
tetramethylethylenediamine, sodium thiosulfate, sodium carbonate,
potassium ferricyanide, and Trypsin Singles™ proteomics grade were
obtained from Sigma-Aldrich (St. Louis, MO, USA). The
electrophoresis apparatus, scanner and image analysis software were
obtained from Amersham Biosciences (Uppsala, Sweden). Additional
analytical-grade chemicals used in this study were from domestic
sources. All buffers were prepared with Milli-Q deionized
water.
Depletion of high-abundance plasma
proteins
The albumin and immunoglobulin (Ig)G proteins were
removed using the Aurum Serum Protein Mini kit (Bio-Rad) to enrich
the lower abundance proteins according to the manufacturer’s
instructions (20). The protein
content of all the samples was determined by Pierce BCA Protein
Assay kit (Thermo Fisher Scientific, Waltham, MA, USA).
2-DE and mass chromatographic
analysis
A volume of each sample that contained 900 μg of
total plasma protein based on the BCA results was diluted in
rehydration solution containing 7 M urea, 2 M thiourea, 2%(w/v)
CHAPS, 0.3% (w/v) DTT and 0.5% (v/v) IPG buffer to a final volume
of 450 μl, and applied to each electrophoresis strip. The IPG
strips were rehydrated in protein solution for ~15 h under low
viscosity paraffin oil (sample loading by rehydration). The IPG
strips were then subjected to 1D isoelectric focusing using a flat
bed electrophoresis system (IPGphor II; Amersham Biosciences) at
room temperature for 17 h to a total of ~80,000 Vh. Upon completion
of the first dimension, reduction was performed with DTT (6 M urea,
2% SDS, 0.375 M Tris HCl (pH 8.8), 20% glycerol and 0.2 g DTT) at
room temperature for 12 min. A second equilibration step was
performed for 12 min in a similar solution, with the exception that
DTT was replaced by 2.5% w/v iodoacetamide. The two aforementioned
steps were performed with gentle shaking. The second dimension of
SDS-polyacrylamide gel electrophoresis was performed on 12.0%
homogeneous running gels. The program was as follows: 1 W for 1 h,
2 W for 1 h followed by 48 W until the dye front reached the end of
the gel. During this procedure the circulating water temperature
was maintained at 12°C.
After the 2-DE procedure was performed, the gels
were soaked in a fixing solution containing 40% methanol and 10%
acetic acid overnight, and then rinsed in Millipore purified water
three times for a total of 60 min. The gels were placed in a
Coomassie brilliant blue G-250 solution consisting of 0.12% G-250,
10% (NH4)2SO4, 10%
H3PO4 and 20% methanol (21). All steps were performed with gentle
shaking. When protein spots became visible, images of the gels were
captured by Umax and LabScan scanners, and analyzed with
ImageMaster 7.0 software (22).
Automatic spot detection and matching of the gels was performed,
followed by manual rechecking of the matched and unmatched protein
spots. The intensity volumes of the individual spots were
normalized with the total intensity volume of all the spots present
in each gel (%V). Differences of >1.5 in expression (ratio, %V)
between matched spots were considered significant whenever a spot
group passed statistical analysis (t-test, P<0.05) and a second
manual verification of the spots on the gel images. All of the
protein spots from each individual peptide mass fingerprinting were
acquired by Bruker autoflex™ TOF/TOF II (Bruker Corporation,
Billerica, MA, USA) after gel digestion. The resulting data
combined with molecular weight (Mw) and isoelectric point (pI) was
then searched against an online protein database (Mascot;
http://www.matrixscience.com) for the
identification of the proteins; the score was
−10*Log10(P), where P is the probability that
the observed match is a random event. Protein scores of >66 for
humans were significant (P<0.05); the proteins were identified
and an initial analysis was made accordingly (23).
Quantitative validation by enzyme-linked
immunosorbent assay (ELISA)
The protein quantifications of apolipoprotein A-I
(Apo A-I) and Apo A-IV were validated by ELISA with 60 plasma
samples, including 20 from patients with HAPE (acute stage and
recovery phase), 20 from HAPE-r individuals and 20 from lowland
healthy controls according to the manufacturer’s instructions
(E0604h and E1967h; USCN Life Science Inc. Wuhan, China)
Statistical analysis
All data are presented as the mean ± standard
deviation. Statistical analysis was performed by one-way analysis
of variance followed by a least significant difference post hoc
test. P<0.05 was considered to indicate a statistically
significant difference.
Results
Plasma proteome profiles of patients with
HAPE
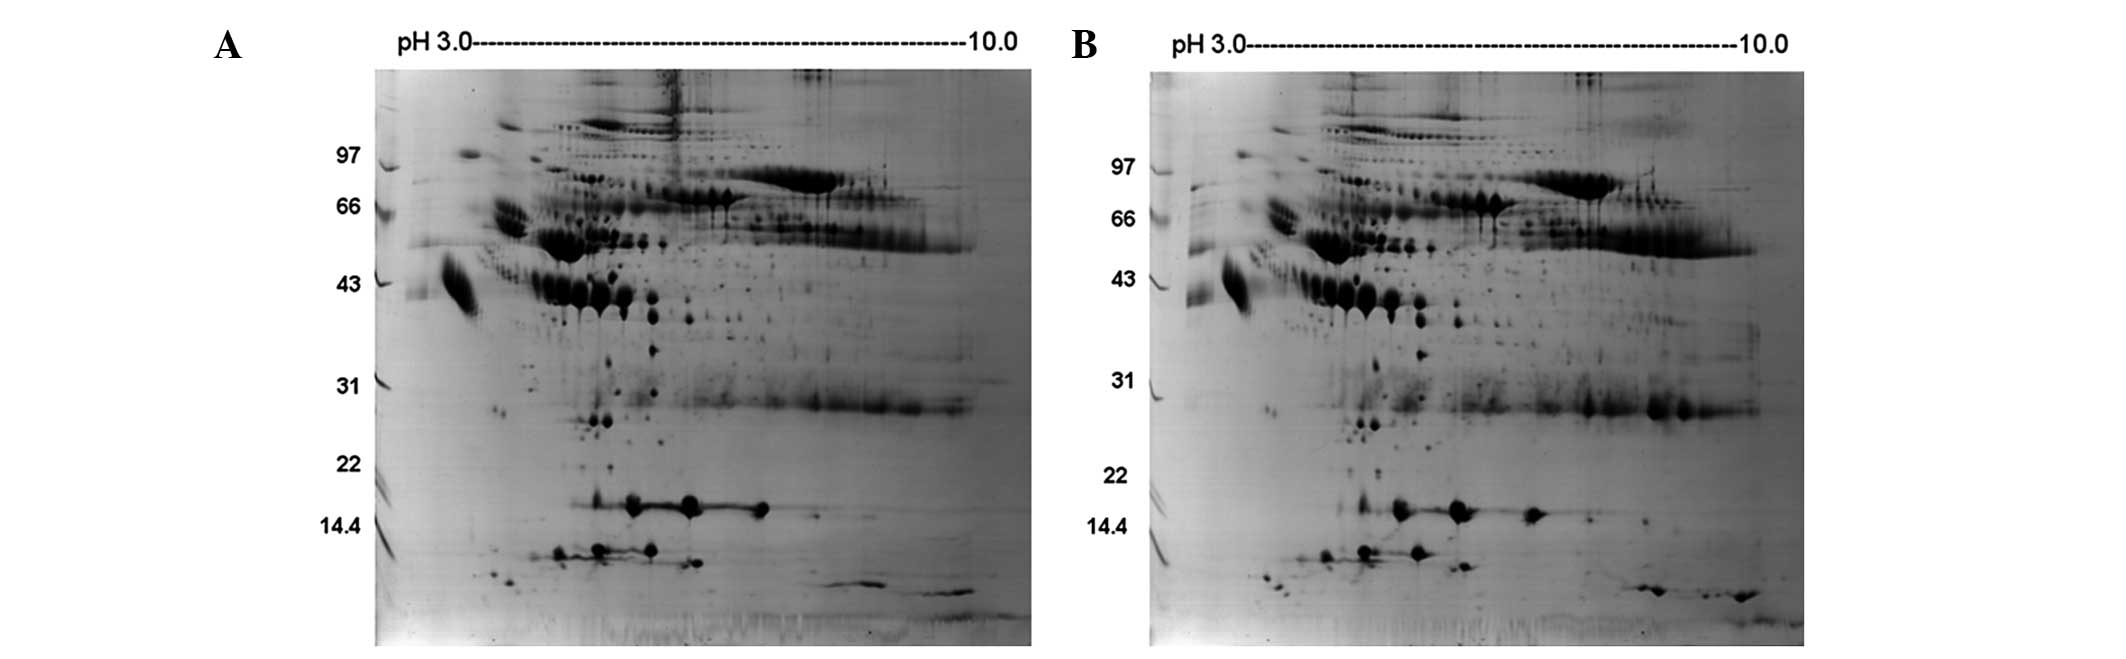
Fig. 1 shows the
representative plasma proteome profile of a patient with HAPE. The
differences in protein profiles in patients with HAPE at the acute
stage and recovery phase were examined using 2-DE with linear IPG
strips. More than 300 protein spots in each gel were visualized by
the 2D ImageMaster software. The relative intensities of the
protein spots (normalized spot volume) were compared and analyzed
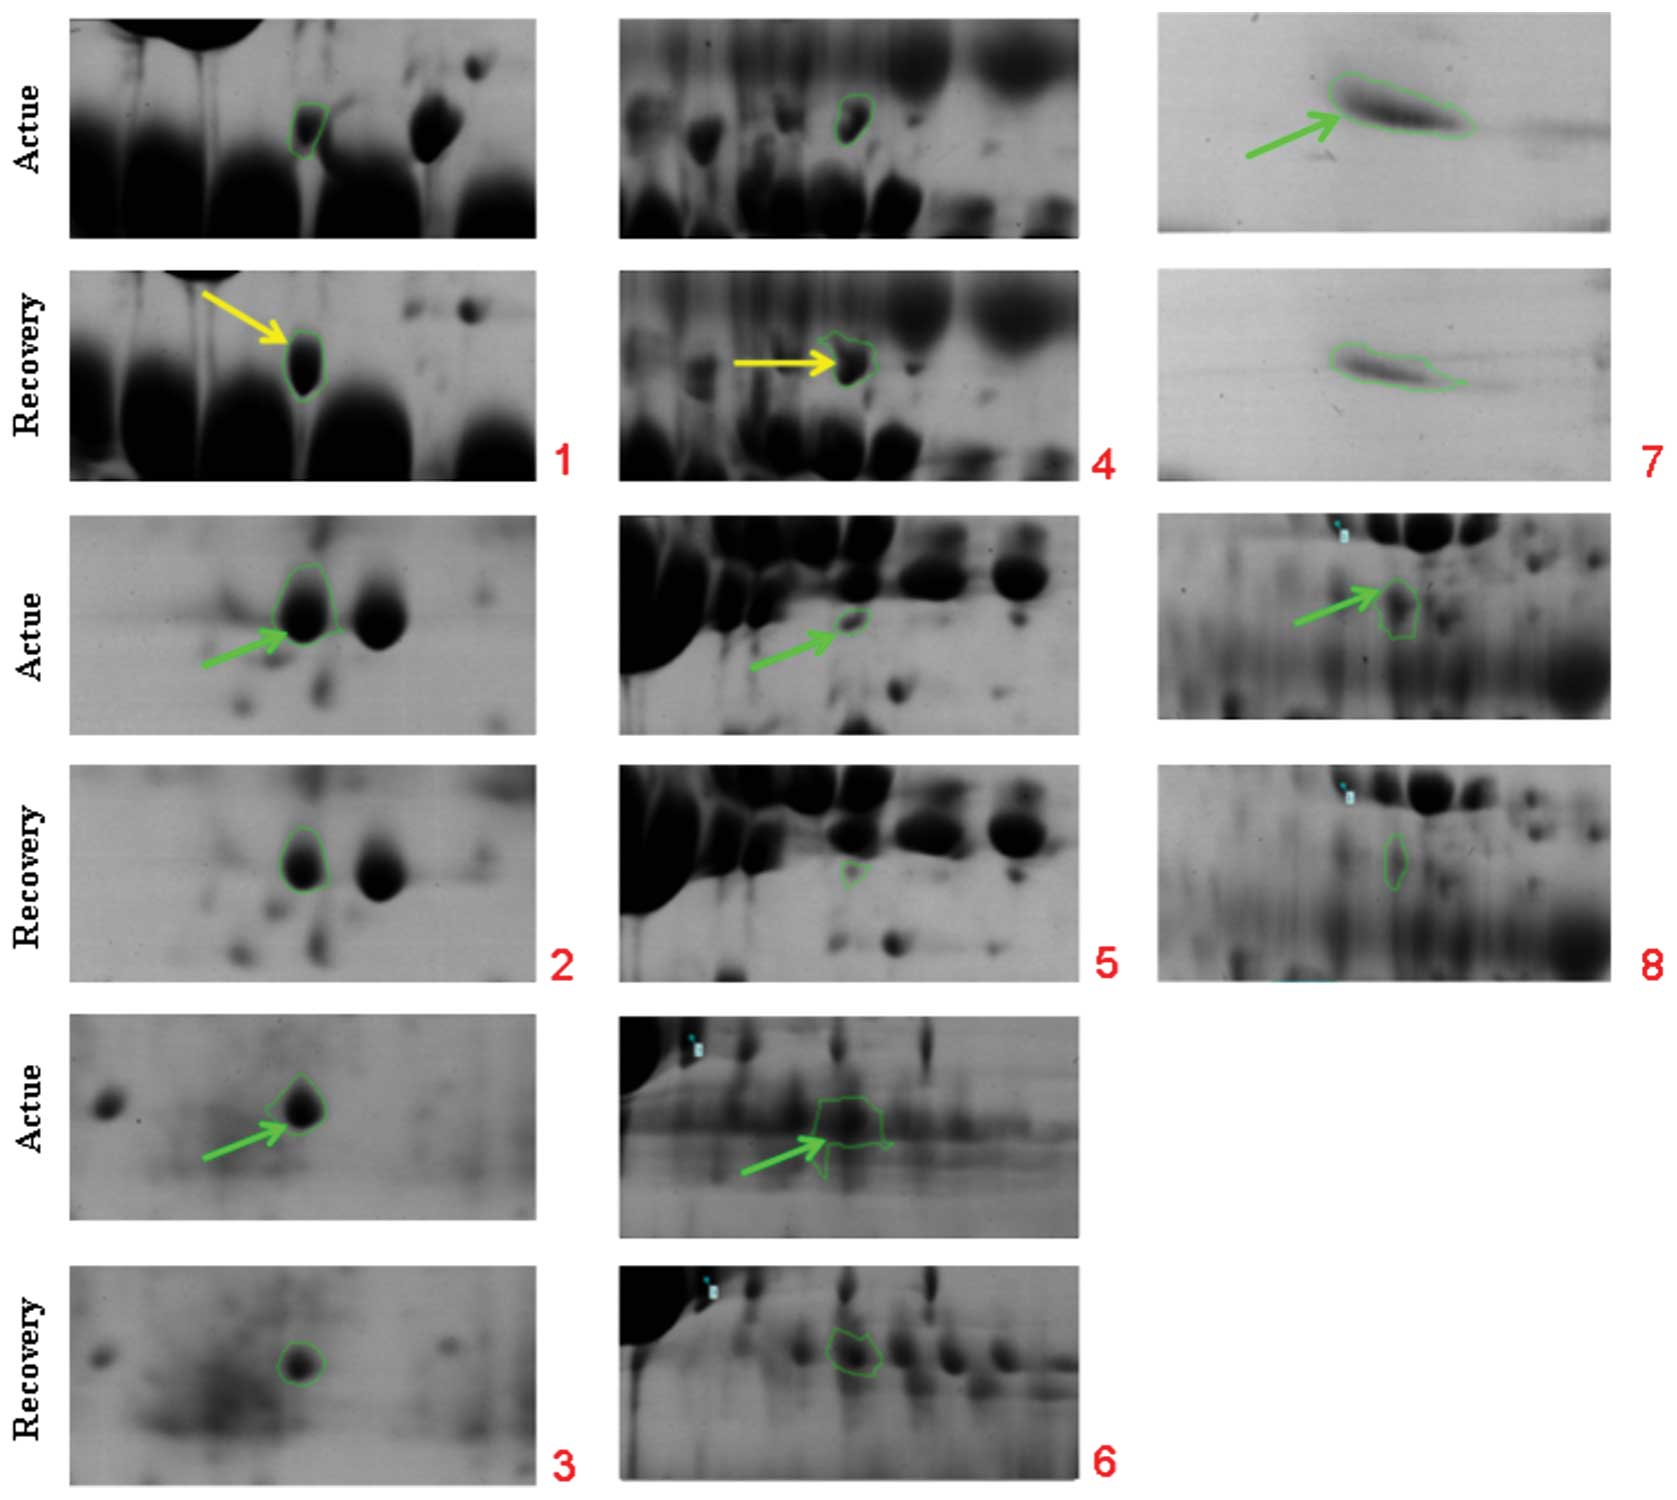
using the 2-DE gel analysis software. Comparison of the 2-DE
results from the patients between the acute and recovery phases led
to the selection of eight spots that significantly varied by
>1.5-fold in expression level (Table I, Fig.
2). The spots were analyzed using Bruker autoflex TOF/TOF II
mass spectrometry. Identification was based on NCBInr, MSDB and
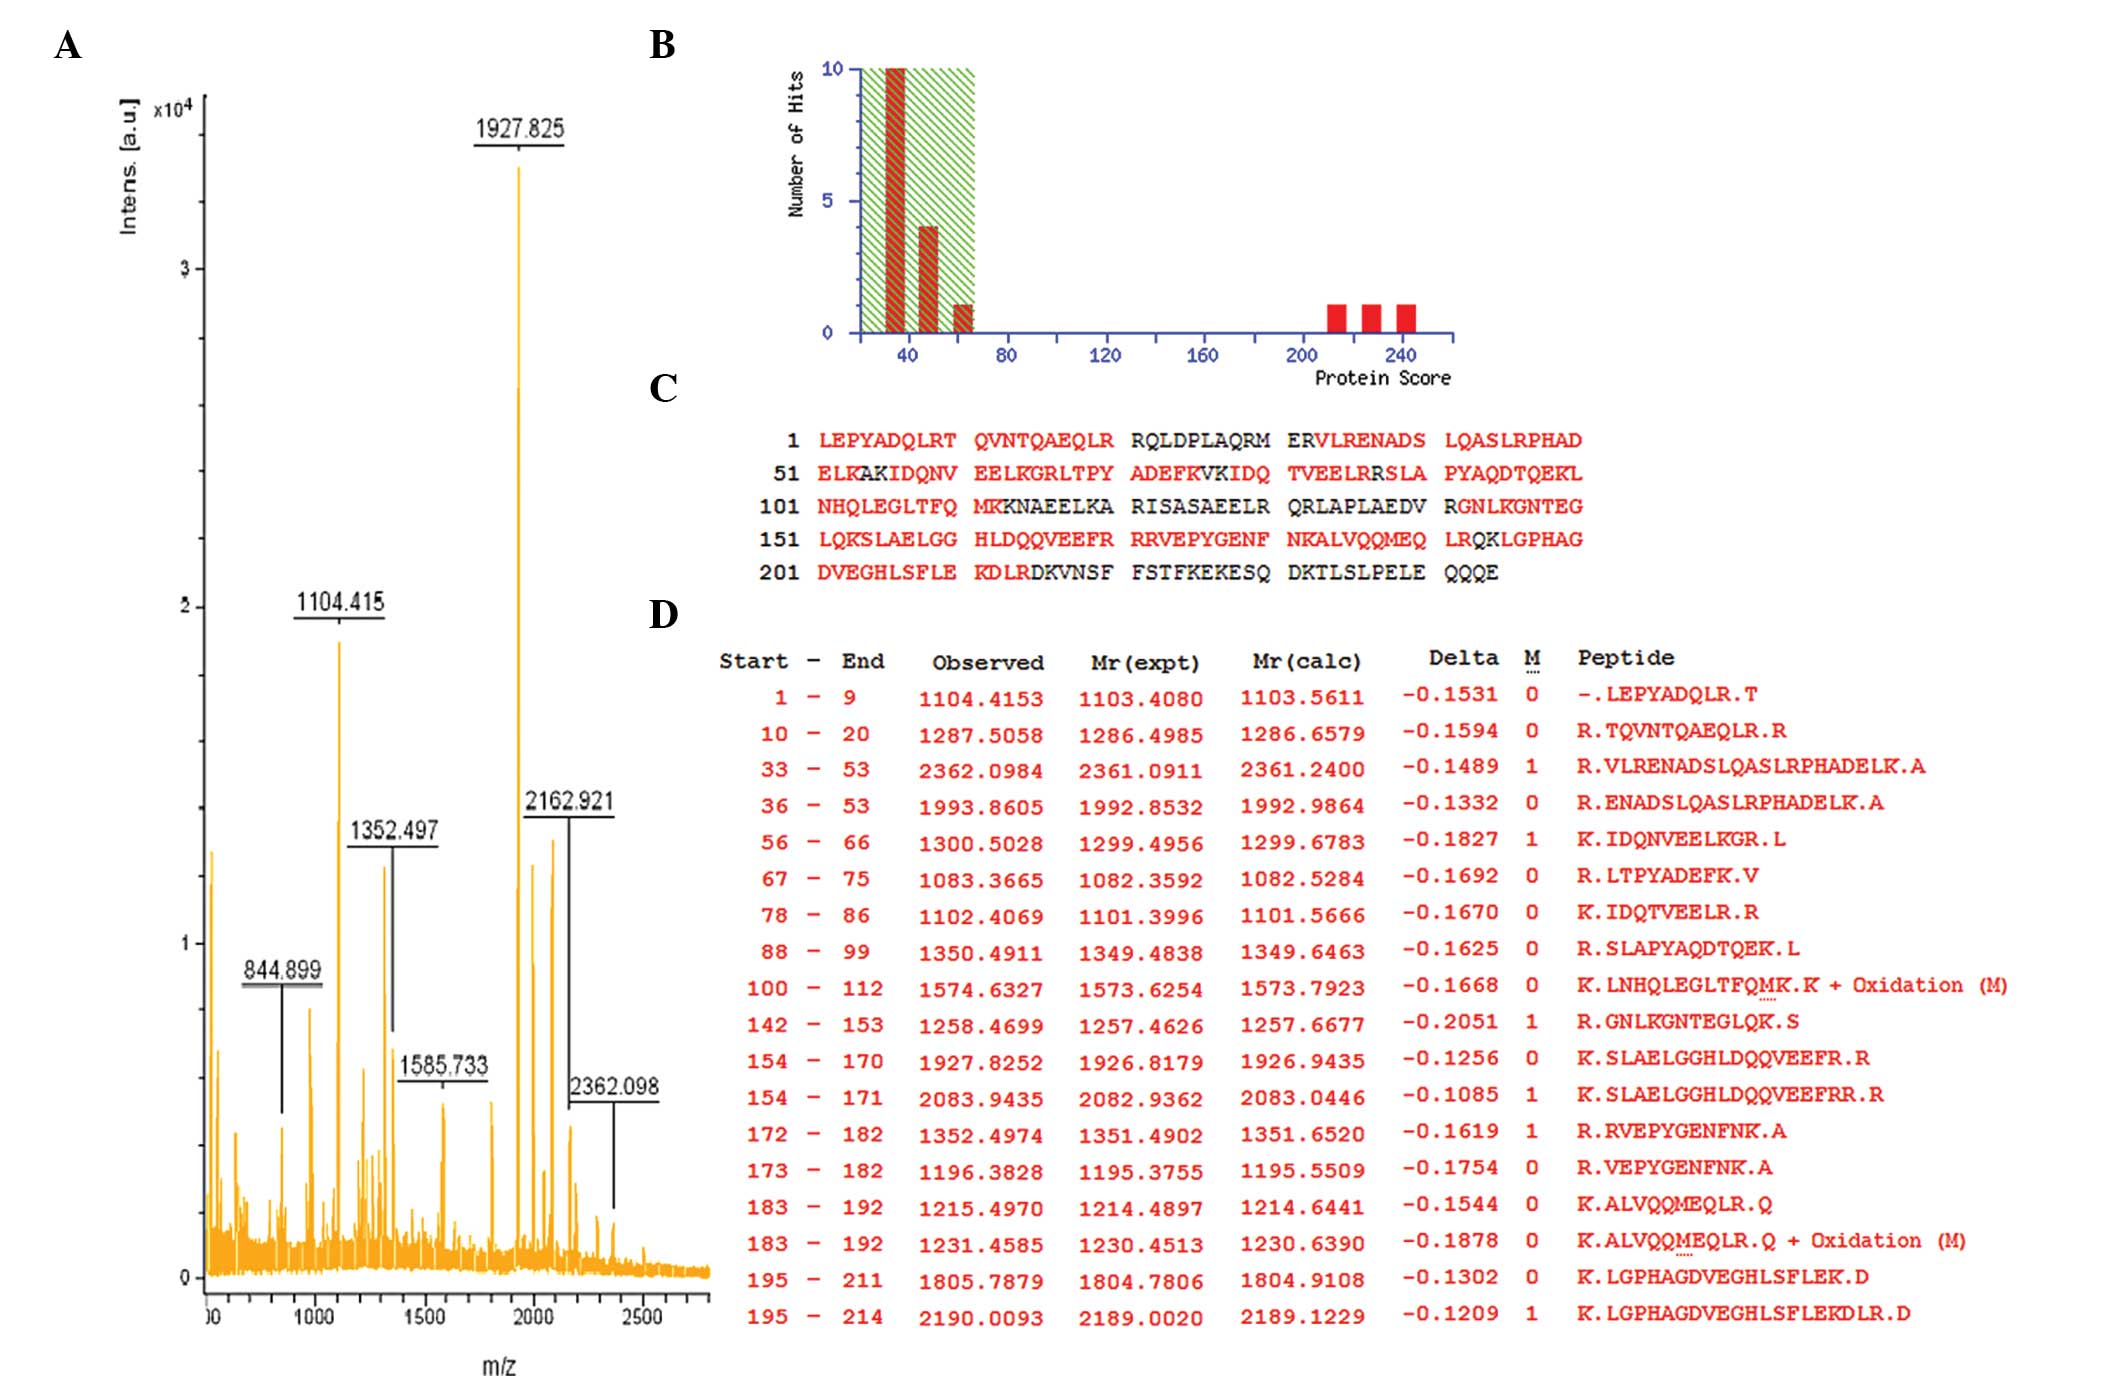
SwissProt database entries with the Mascot search engine. Fig. 3 shows the mass spectrometry peptide
mass fingerprint map and database query result of protein spot 1,
which was identified as human Apo A-IV. Table I lists the SwissProt accession
numbers as well as the full names of the protein spots, Mw and pI
values, and the percentage of matching peptide and protein amino
acid sequence coverage by matching peptides. A comparison of 2-DE
gels from patients at different phases indicated that six spots
were significantly upregulated in the acute stage and two spots
were expressed at higher levels in the recovery phase. Among these
changed protein spots, Apo A-I and Apo A-IV were selected for
further analysis.
 | Table IIdentification of the selected
proteins in plasma 2-DE profiles from patients with HAPE. |
Table I
Identification of the selected
proteins in plasma 2-DE profiles from patients with HAPE.
| | | | | | Expression |
|---|
| | | | | |
|
|---|
| ID | Protein name | Accession no. | Protein score | Sequence coverage
(%) | Experimental Mw,
(ku)/pI | Acute | Recovery | Fold |
|---|
| 1 | Apolipoprotein
A-IV | AAB59516 | 241 | 68 | 28141/5.39 | | U | 2.0 |
| 2 | Apolipoprotein
A-I | 2A01_A | 183 | 51 | 28061/5.27 | U | | 1.5 |
| 3 | Serum amyloid P
component | 1SAC_A | 111 | 28 | 23358/6.12 | U | | 2.0 |
| 4 | Antithrombin-III | 2B4X_I | 108 | 41 | 48751/5.72 | | U | 1.5 |
| 5 | Tubulin β-1
chain | NP_110400 | 104 | 34 | 50865/5.05 | U | | 2.0 |
| 6 | Fibrinogen | 3GHG_A | 89 | 22 | 61305/7.31 | U | | 2.0 |
| 7 | Inter-α (globulin)
inhibitor H3 | BAD96477 | 84 | 17 | 100024/5.45 | U | | 2.0 |
| 8 | Serpin peptidase
inhibitor | EAW90578 | 77 | 19 | 57358/6.47 | U | | 2.0 |
Validation of Apo A-I and Apo A-IV with
ELISA
To validate the results of the proteomic analysis,
Apo A-I and Apo A-IV were selected for ELISA (Table II). The mean plasma Apo A-I
concentration was 498.3±20.8 μg/ml (mean ± standard deviation) in
patients with HAPE at the acute stage versus 430.3±16.0 μg/ml at
the recovery phase (P<0.05). The mean Apo A-I concentration was
584.2±60.6 μg/ml in the HAPE-r group versus 436.2±24.9 μg/ml in the
lowland controls (P<0.05). The expression level of Apo A-I was
upregulated in the plasma of the HAPE-r group and patients with
HAPE at the acute stage. The mean plasma Apo A-IV concentration was
14.96±0.43 μg/ml in patients with HAPE at the acute stage versus
16.43±0.76 μg/ml at the recovery phase (P<0.05); and the mean
Apo A-IV concentration was 15.70±0.80 μg/ml in HAPE-r versus
21.56±1.80 μg/ml in the lowland controls (P<0.05). The
expression levels of Apo A-IV were downregulated in the plasma of
the patients with HAPE and the HAPE-r individuals.
| Table IIComparison of Apo A-I and Apo A-IV
concentrations in plasma among HAPE, HAPE-r and the lowland control
groups. |
Table II
Comparison of Apo A-I and Apo A-IV
concentrations in plasma among HAPE, HAPE-r and the lowland control
groups.
| Group | No. | Apo A-I
(μg/ml) | Apo A-IV
(μg/ml) |
|---|
| Acute stage | 10 | 498.3±20.8a | 14.96±0.43a |
| Recovery phase | 10 | 430.3±16.0b | 16.43±0.76a,b |
| HAPE-r | 20 | 584.2±60.6a,b | 15.70±0.80a,b |
| Lowland
control | 20 | 436.2±24.9 | 21.56±1.80 |
Discussion
Plasma is a primary clinical specimen that is useful
for disease diagnosis and therapeutic monitoring (14). The plasma proteome is the most
complex human-derived proteome, containing all tissue proteomes as
subsets plus numerous distinct immunoglobulins. It has an large
dynamic range with >10 orders of magnitude in concentration
separating albumin and the rarest proteins, which are now measured
clinically or researched in laboratories. With the availability of
proteomic tools, the profiling of the human plasma proteome has
become increasingly feasible; when searching for disease-related
markers, the presence of a particular protein and/or its isoforms
in the plasma represents the likelihood of other biologically
active molecules as potential biomarkers for disease diagnosis and
therapeutic monitoring (24).
Cellular functions and the protein expression pattern often change
during different disease states. To the best of our knowledge, no
previous studies have compared the plasma proteome profile in the
acute stage with that of the recovery phase in patients with HAPE.
Therefore, the present study aimed to demonstrate the
differentially expressed proteins in the plasma of patients with
HAPE at different phases, as these have the potential to be
developed as biomarkers for the prediction of disease. These
differentially expressed proteins may also be important in disease
development and recovery.
HAPE usually occurs at altitudes of >3,000 m
above sea level in rapidly ascending non-acclimatized individuals
(1,2). HAPE is a noncardiogenic pulmonary
edema in pulmonary interstitial tissue and alveoli (3). Although hypoxia is a major trigger
factor, the pathogenesis of HAPE remains unclear. The search for
biomarkers for early-stage prognosis is ongoing. Ren et al
(25) found out that the plasma
concentrations of D-dimer, fibrinogen, fibrin/fibrinogen
degradation products (FDP), tissue plasminogen activator (t-PA) and
plasminogen activator inhibitor-1 (PAI-1) were significantly higher
in patients with HAPE than in the controls and these abnormalities
were correlated with the severity of HAPE. Following recovery from
HAPE, the plasma concentrations of D-dimer and fibrinogen recovered
to normal but the t-PA, PAI-1 and FDP levels in patients with HAPE
remained significantly increased compared with those of
unacclimatized controls. The development of HAPE is associated with
abnormalities in the fibrinolysis and coagulation system, and these
abnormalities are correlated with the severity of HAPE. Ahmad et
al (15) identified 25 protein
spots in human plasma of which 14 showed changes in patients with
HAPE; these were mainly acute phase proteins, complement components
and apolipoproteins. Haptoglobin and Apo A-I were upregulated in
the plasma of patients with HAPE.
In the present study, 2-DE followed by mass
spectrometry was used to analyze the plasma of patients with HAPE
at the acute stage and recovery phase. By comparison of the results
of 2-DE from the patients at different phases, eight spots that
significantly varied in expression by >1.5-fold were selected;
six spots (Apo A-I, antithrombin-III, tubulin β-1 chain,
fibrinogen, inter-α inhibitor H3 and serpin peptidase inhibitor)
were significantly upregulated in the acute stage and two spots
(Apo A-IV and serum amyloid P component) were expressed at higher
levels in the recovery phase. Among these changed protein spots,
Apo A-I and Apo A-IV were selected for further analysis in the
patient and control groups. The Apo A-I concentration was
upregulated in patients with HAPE in the acute stage, but was lower
compared with that of the HAPE-r group (P<0.05). The Apo A-IV
concentrations were downregulated in the plasma of patients with
HAPE in the acute stage and the HAPE-r individuals; however, in the
recovery phase the Apo A-IV levels were slightly higher in the
patients with HAPE than in the HAPE-r individuals (P<0.05).
These results are partially supported by those of Ahmad et
al (15).
The levels of high-density lipoprotein and its major
(70%) protein component, Apo A-I, are strongly inversely correlated
with the risk of atherosclerosis and other vascular diseases. Apo
A-I may contribute to the protective effects, including removal of
cholesterol from peripheral tissues to the liver (reverse
cholesterol transport), anti-inflammatory and anti-oxidative
activities, and modulation of vascular function (15,26).
A series of studies have shown that Apo A-I is able to bind LPS to
subsequently interrupt the activation of macrophages, inhibit the
LPS-activated release of inflammatory cytokines by macrophages and
inhibit the activation of neutrophils (27–29),
and that Apo A-I overexpression has a protective effect on
LPS-induced multiple organ injury (30). Apo A-I has also been shown to be
essential for maintaining normal lipid composition and architecture
of the lung as well as respiratory physiology (31). In addition, Apo A-I levels were
observed to be lower in patients with homozygous sickle cell anemia
with pulmonary arterial hypertension (PAH) than in patients with
sickle cell anemia without PAH (32). There is emerging evidence that Apo
A-I has a critical role in protecting pulmonary artery and airway
function as well as preventing inflammation and collagen deposition
in the lung (33). Local treatment
with Apo A-I is very effective against the development of
experimental lung injury and fibrosis (34). Intermittent hypoxic exercise has
been shown to stimulate the levels of Apo A-I and strengthen the
metabolism of lipids, and may have certain functions in
cardiovascular disease treatment (35). In the present study, Apo A-I was
found to be upregulated in patients with HAPE (acute stage), but
was expressed at lower levels compared with those of the highland
controls, suggesting the Apo A-I’s anti-inflammatory and vessel
endothelia-protective properties were not enough in HAPE.
Therefore, it may be concluded that Apo A-I has an important role
in HAPE pathophysiology and may serve as a protective factor for
the lung.
Apo A-IV is a 46-kDa glycoprotein. The synthesis and
secretion of Apo A-IV is stimulated by fat absorption by intestinal
enterocytes, which are incorporated into the surface of nascent
chylomicrons, and are important in intestinal lipid absorption and
chylomicron assembly (36).
Fujimoto demonstrated that Apo A-IV is a satiety signal secreted by
the small intestine following the ingestion of a lipid meal
(37). Apo A-IV is also present in
the hypothalamus, and hypothalamic Apo A-IV levels are reduced by
food deprivation and restored by lipid feeding. Apo A-IV is
involved in the long-term regulation of food intake and body
weight. Chronic ingestion of high fat blunts the hypothalamic Apo
A-IV response to lipid feeding and may explain why chronic intake
of high fat predisposes animals and humans to obesity (38). Recently, low plasma Apo A-IV levels
have been associated with acute coronary syndrome and plasma Apo
A-IV levels have been proposed as a potential treatment target for
patients with acute coronary syndrome (39). Guo et al (40) found Apo A-IV was correlated with
the severity of obstructive sleep apnea-hypopnea syndrome.
Considering that the expression of Apo A-I and Apo A-IV show
variances in HAPE, we hypothesize that these two proteins may
become biomarkers for the diagnosis and prognosis of HAPE.
Our future studies will collect more samples, set
more than two stages, focus on not only 8 selected proteins, but
also the differences of the protein in 2D gel, to illustrate those
differential proteins in dynamic change. Due to the importance of
correlation study between SNPs in Apo A-I & IV and HAPE, we
will select and genotype SNPs, and even whole genes re-sequencing,
aiming to illustrate this disease on gene level.
One important limitation of the present study is
that it was based on only three patients. In addition, all protein
differences in the 2D gel were not estimated; only those spots with
significant differences (>1.5-fold) in expression were analyzed
and this may omit important information.
Acknowledgements
The research was supported by research grants
including National Science Foundation of China (31160232 &
31160219), National Basic Research Program of China (2012CB518200)
and Program of International S&T Cooperation of China
(2011DFA32720).
References
|
1
|
Hackett PH and Roach RC: High-altitude
illness. N Engl J Med. 345:107–114. 2001. View Article : Google Scholar : PubMed/NCBI
|
|
2
|
Basnyat B and Murdoch DR: High-altitude
illness. Lancet. 361:1967–1974. 2003. View Article : Google Scholar
|
|
3
|
Mortimer H, Patel S and Peacock AJ: The
genetic basis of high-altitude pulmonary oedema. Pharmacol Ther.
101:183–192. 2004. View Article : Google Scholar : PubMed/NCBI
|
|
4
|
Bärtsch P, Mairbäurl H, Maggiorini M and
Swenson ER: Physiological aspects of high-altitude pulmonary edema.
J Appl Physiol. 98:1101–1110. 2005.
|
|
5
|
Maggiorini M, Mélot C, Pierre S, et al:
High altitude pulmonary edema is initially caused by an increase in
capillary pressure. Circulation. 103:2078–2083. 2001. View Article : Google Scholar : PubMed/NCBI
|
|
6
|
Schoene RB, Hackett PH, Henderson WR, et
al: High-altitude pulmonary edema. Characteristics of lung lavage
fluid. JAMA. 256:63–69. 1986. View Article : Google Scholar : PubMed/NCBI
|
|
7
|
Schoene RB, Swenson ER, Pizzo CJ, et al:
The lung at high altitude: bronchoalveolar lavage in acute mountain
sickness and pulmonary edema. J Appl Physiol. 64:2605–2613.
1988.PubMed/NCBI
|
|
8
|
Kubo K, Hanaoka M, Yamaguchi S, et al:
Cytokines in bronchoalveolar lavage fluid in patients with high
altitude pulmonary edema at moderate altitude in Japan. Thorax.
51:739–742. 1996. View Article : Google Scholar : PubMed/NCBI
|
|
9
|
Kubo K, Hanaoka M, Hayano T, et al:
Inflammatory cytokines in BAL fluid and pulmonary hemodynamics in
high-altitude pulmonary edema. Respir Physiol. 111:301–310. 1998.
View Article : Google Scholar : PubMed/NCBI
|
|
10
|
Ran YH, Zhang DX, Xiao ZH, et al: Changes
of VEGF, TNF-alpha, IL-6 and NO in serum of patients with HAPE.
Zhongguo Ying Yong Sheng Li Xue Za Zhi. 27:201–203. 2011.(In
Chinese).
|
|
11
|
Pavlicek V, Marti HH, Grad S, et al:
Effects of hypobaric hypoxia on vascular endothelial growth factor
and the acute phase response in subjects who are susceptible to
high-altitude pulmonary oedema. Eur J Appl Physiol. 81:497–503.
2000. View Article : Google Scholar : PubMed/NCBI
|
|
12
|
Yang X, Xie Y and Zhang D: Research on the
relationship between expression of VEGF and high altitude pulmonary
edema. Zhonghua Yi Xue Za Zhi. 80:931–935. 2000.(In Chinese).
|
|
13
|
Droma Y, Hayano T, Takabayashi Y, et al:
Endothelin-1 and interleukin-8 in high altitude pulmonary oedema.
Eur Respir J. 9:1947–1949. 1996. View Article : Google Scholar : PubMed/NCBI
|
|
14
|
Honda K, Ono M, Shitashige M, et al:
Proteomic approaches to the discovery of cancer biomarkers for
early detection and personalized medicine. Jpn J Clin Oncol.
43:103–109. 2013. View Article : Google Scholar : PubMed/NCBI
|
|
15
|
Penque D: Two-dimensional gel
electrophoresis and mass spectrometry for biomarker discovery.
Proteomics Clin Appl. 3:155–172. 2009. View Article : Google Scholar
|
|
16
|
Zhang YY, Duan RF and Wang H: The study of
plasma proteomic changes in a patient with high-altitude cerebral
edema. Zhongguo Ying Yong Sheng Li Xue Za Zhi. 27:180–184. 2011.(In
Chinese).
|
|
17
|
Luo Y, Zhu J and Gao Y: Metabolomic
analysis of the plasma of patients with high-altitude pulmonary
edema (HAPE) using 1H NMR. Mol Biosyst. 8:1783–1788. 2012.
View Article : Google Scholar : PubMed/NCBI
|
|
18
|
Roach RC, Bartsch P, Hackett PH and Oelz
O: The Lake Louise acute mountain sickness scoring system. Hypoxia
and Molecular Medicine. Sutton JR, Houston CS and Coates G:
Burlington, VT: Queens City Printers; pp. 272–274. 1993
|
|
19
|
Hulmes JD, Bethea D, Ho K, et al: An
investigation of plasma collection, stabilization, and storage
procedures for proteomic analysis of clinical samples. Clin
Proteomics J. 1:17–31. 2004. View Article : Google Scholar
|
|
20
|
Candiano G, Bruschi M, Musante L, et al:
Blue silver: a very sensitive colloidal Coomassie G-250 staining
for proteome analysis. Electrophoresis. 25:1327–1333. 2004.
View Article : Google Scholar : PubMed/NCBI
|
|
21
|
Görg A, Obermaier C, Boguth G, et al: The
current state of two-dimensional electrophoresis with immobilized
pH gradients. Electrophoresis. 21:1037–1053. 2000.
|
|
22
|
Yang X, Clifton J, Huang F, et al:
Proteomic analysis for process development and control of
therapeutic protein separation from human plasma. Electrophoresis.
30:1185–1193. 2009. View Article : Google Scholar : PubMed/NCBI
|
|
23
|
Anderson NL and Anderson NG: The human
plasma proteome: history, character, and diagnostic prospects. Mol
Cell Proteomics. 1:845–867. 2002. View Article : Google Scholar : PubMed/NCBI
|
|
24
|
Ren Y, Cui F, Lei Y, et al: High-altitude
pulmonary edema is associated with coagulation and fibrinolytic
abnormalities. Am J Med Sci. 344:186–189. 2012. View Article : Google Scholar : PubMed/NCBI
|
|
25
|
Ahmad Y, Shukla D, Garg I, et al:
Identification of haptoglobin and apolipoprotein A-I as biomarkers
for high altitude pulmonary edema. Funct Integr Genomics.
11:407–417. 2011. View Article : Google Scholar : PubMed/NCBI
|
|
26
|
Garber DW, Handattu SP, Datta G, et al:
Atherosclerosis and vascular disease: effects of peptide mimetics
of apolipoproteins. Curr Pharm Biotechnol. 7:235–240. 2006.
View Article : Google Scholar : PubMed/NCBI
|
|
27
|
Ma J, Liao XL, Lou B and Wu MP: Role of
apolipoprotein A-I in protecting against endotoxin toxicity. Acta
Biochim Biophys Sin (Shanghai). 36:419–424. 2004. View Article : Google Scholar : PubMed/NCBI
|
|
28
|
Yan YJ, Li Y, Lou B and Wu MP: Beneficial
effects of ApoA-I on LPS-induced acute lung injury and endotoxemia
in mice. Life Sci. 79:210–215. 2006. View Article : Google Scholar : PubMed/NCBI
|
|
29
|
Liao XL, Lou B, Ma J and Wu MP:
Neutrophils activation can be diminished by apolipoprotein A-I.
Life Sci. 77:325–335. 2005. View Article : Google Scholar : PubMed/NCBI
|
|
30
|
Li Y, Dong JB and Wu MP: Human ApoA-I
overexpression diminishes LPS-induced systemic inflammation and
multiple organ damage in mice. Eur J Pharm. 590:417–422. 2008.
View Article : Google Scholar : PubMed/NCBI
|
|
31
|
Bates SR, Tao JQ, Collins HL, Francone OL
and Rothblat GH: Pulmonary abnormalities due to ABCA1 deficiency in
mice. Am J Physiol Lung Cell Mol Physiol. 289:L980–L989. 2005.
View Article : Google Scholar : PubMed/NCBI
|
|
32
|
Yuditskaya S, Tumblin A, Hoehn GT, et al:
Proteomic identification of altered apolipoprotein patterns in
pulmonary hypertension and vasculopathy of sickle cell disease.
Blood. 113:1122–1128. 2009. View Article : Google Scholar : PubMed/NCBI
|
|
33
|
Wang W, Xu H, Shi Y, et al: Genetic
deletion of apolipoprotein A-I increases airway
hyperresponsiveness, inflammation, and collagen deposition in the
lung. J Lipid Res. 51:2560–2570. 2010. View Article : Google Scholar : PubMed/NCBI
|
|
34
|
Kim TH, Lee YH, Kim KH, et al: Role of
lung apolipoprotein A-I in idiopathic pulmonary fibrosis:
antiinflammatory and antifibrotic effect on experimental lung
injury and fibrosis. Am J Respir Crit Care Med. 182:633–642. 2010.
View Article : Google Scholar : PubMed/NCBI
|
|
35
|
Weng XQ, Huang LY, Lin WT, et al: Effect
of intermittent hypoxic exercise on blood-lipid and Apo of rat.
China Sport Science. 25(9): 46–48. 2005.(In Chinese).
|
|
36
|
Weinberg RB: Apolipoprotein A-IV
polymorphisms and diet-gene interactions. Curr Opin Lipidol.
13:125–134. 2002. View Article : Google Scholar : PubMed/NCBI
|
|
37
|
Fujimoto K, Cardelli JA and Tso P:
Increased apolipoprotein A-IV in rat mesenteric lymph after lipid
meal acts as a physiological signal for satiation. Am J Physiol.
262(6 Pt 1): G1002–1006. 1992.PubMed/NCBI
|
|
38
|
Tso P and Liu M: Apolipoprotein A-IV, food
intake, and obesity. Physiol Behav. 83:631–643. 2004. View Article : Google Scholar : PubMed/NCBI
|
|
39
|
Li J, Song M, Qian D, et al: Decreased
plasma apolipoprotein A-IV levels in patients with acute coronary
syndrome. Clin Invest Med. 36:E207–E215. 2013.PubMed/NCBI
|
|
40
|
Guo Q, Li QY, Wang Y, et al: Research on
apo A-IV of obstructive sleep apnea-hypopnea syndrome. Int J
Respir. 31:1149–1152. 2011.(In Chinese).
|