Introduction
Polycystic ovary syndrome (PCOS) is a common
reproductive endocrinology disease affecting 5–10% of females of
reproductive age (1). Endocrine,
reproductive and metabolic abnormalities are involved in PCOS with
symptoms such as infertility, irregular menstrual cyclicity,
hirsutism, acne, obesity, impaired glucose tolerance, type 2
diabetes mellitus and dyslipidemia.
Previous investigations have addressed the
possibility that insulin resistance (IR) and hyperinsulinemia may
be central to the pathogenesis of PCOS (2). Moreover, PCOS is considered to be a
low-grade chronic inflammatory state, as evidenced by the elevated
plasma concentrations of numerous inflammatory factors, including
tumor necrosis factor-α, C-reactive protein and interleukin-6
(3–5). IR may be induced by inflammatory
cytokines through the direct or indirect action on insulin
signaling postreceptor molecules in PCOS (6,7).
Therefore, inflammation may play a key role in the pathogenesis of
IR in PCOS.
Visfatin, a proinflammatory cytokine, is located in
the visceral adipose tissue and is predominantly produced by
macrophages. Injection of visfatin into mice was shown to induce a
reduction in the levels of blood glucose (8). Furthermore, visfatin may mimic the
function of insulin and interfere with the signal transduction of
insulin (9). However, the binding
point of visfatin on the insulin receptors differs from that of
insulin. Visfatin reacts slowly to glucose stimulation, while
insulin reacts quickly. The precise function of visfatin in humans
remains unclear and the plasma visfatin levels in IR-related
diseases, including obesity and type 2 diabetes mellitus, are
controversial. In previous studies, increased levels of plasma
visfatin were observed when PCOS patients were compared with
control subjects (10–18). However, additional studies
indicated that there was no difference in plasma visfatin levels
between PCOS patients and control subjects, specifically between
normal weight PCOS patients and control subjects (19,20).
Furthermore, the association between plasma visfatin and IR in PCOS
is controversial, with a positive correlation being demonstrated in
a number of studies (11,17,21,22),
but not in others (20,23). Obesity may have been the
confounding factor that influenced those results.
Previous studies have reported an increase in mRNA
expression levels of visfatin from peripheral blood mononuclear
cells (PBMCs) of type 2 diabetes mellitus patients (24) and in omental adipose tissue and
PBMCs of PCOS patients (17,25).
However, only the visfatin mRNA concentration in the omental
adipose tissue, but not the mRNA concentration in PBMCs, was
closely correlated with body mass index (BMI) and the homeostasis
model assessment of IR (HOMA-IR) (25). Visfatin is predominantly expressed
in the macrophages of adipose tissue; however, the aforementioned
study examined adipose tissue and PBMCs, rather than macrophages.
Visfatin gene expression levels in the macrophages of PCOS patients
have not previously been investigated to the best of our knowledge.
Therefore, the correlation between gene expression of visfatin and
IR in PCOS patients remains unclear.
The aim of the present study was to evaluate plasma
visfatin and visfatin gene expression levels in PBMCs and
peripheral blood monocyte-derived macrophages (PBMMs) of PCOS
patients. The association between PCOS per se and IR in PCOS
was also investigated.
Patients and methods
Patient selection
Sample size was calculated based on the results of a
previous study, in which the participants were stratified into four
subgroups based on their insulin sensitivity and the levels of
visfatin mRNA, which were observed in the omental adipose tissue
(26). A minimum of eight
participants were required for each subgroup (I type error=0.05, II
type error=0.1). In total, 21 PCOS patients from the reproductive
endocrinology clinic in West China Second University Hospital,
Chengdu, China were enrolled in the experimental group. The
Rotterdam criteria of PCOS were applied (27) and patients exhibiting congenital
adrenal hyperplasia, Cushing’s syndrome, androgen-secreting tumors,
thyroid disease and prolactinoma were excluded. In the 21 PCOS
patients, 11 were diagnosed as IR and 10 patients exhibited normal
insulin levels; IR was defined as a HOMA-IR score of >2.14
(28,29).
A total of 21 patients exhibiting fallopian tube
infertility, identified by a hysterosalpingogram, were recruited as
control subjects and cases of polycystic ovaries and
hyperandrogenism were excluded. Of the 21 controls, 9 were
diagnosed as IR. Regular ovulation, identified by a normal serum
progesterone level and a regular menstrual cycle, was assessed in
the 12 control subjects without IR.
Participants exhibiting other infectious, organic,
endocrine or systemic abnormalities were excluded from the study.
The study participants did not receive medication or hormones that
may have affected hormone or carbohydrate metabolism for at least
three months prior to participating in the study. The study was
approved by the Human Ethics Committee of West China Second
University Hospital (Chengdu, China) and informed consent was
obtained from all the participants.
The medical history of the participants was
collected via predesigned questionnaires. Body weight, height, BMI,
waist circumference, hip circumference, waist to hip ratio (WHR),
and systolic and diastolic blood pressure (DBP) were measured.
Cases of hirsutism, acne, acanthosis nigricans and baldness were
assessed by professional analysts. The collection of blood samples
was performed during the early follicular phase of the menstrual
cycle (day 3–7) or following a minimum of three months of
amenorrhea.
Measurement of hormone levels
Overnight fasting blood samples were collected from
all the participants. The samples were immediately centrifuged for
plasma separation and stored at −80°C until the assays were
conducted. Estradiol, progesterone, testosterone (T), luteinizing
hormone (LH), follicle stimulating hormone (FSH), cortisol,
prolactin and fasting insulin (FINS) were measured via
chemiluminescence. Fasting glucose (FPG) and dehydroepiandrosterone
sulfate (DHEAS) were measured using the glucose oxidase method and
radioimmunoassay, respectively. Total cholesterol, triglyceride,
high density lipoprotein cholesterol, low density lipoprotein
cholesterol, thyronine and thyroxine were measured by enzyme-linked
immunosorbent assay (ELISA). All the aforementioned tests were
performed by a laboratory professional in the clinical test center
of West China Second University Hospital. The inter- and
intra-assay coefficient of variation were <15 and <6%,
respectively. Plasma visfatin was measured using an ELISA kit (USCN
Life Science Inc., Wuhan, China), with a lower limit of sensitivity
of 0.78 ng/ml (range, 3.12–200 ng/ml). The inter- and intra-assay
coefficients of variation were <14 and <5%, respectively.
Ficoll gradient centrifugation
Ficoll gradient centrifugation was conducted to
obtain PBMCs from the whole blood. Heparinized blood was mixed with
20 ml phosphate-buffered saline (PBS), layered onto Ficoll-Hypaque
(TBD Science, Tianjin, China) and centrifuged for 20 min at 2,500
rpm (TDL-40B low-speed horizontal centrifuge, ANTING Scientific
Instrument Plant, Shanghai, China). The interface containing the
mononuclear cells was collected and washed three times using PBS.
The cells were resuspended at 1×10⁶ cells/ml in RPMI
1640 medium (1% penicillin/streptomycin and 10% new-born calf
serum) and seeded into 6-well plates at 37°C in a 5% CO2
humidified incubator. After 12 h, the non-adherent cells were
removed and a number of the remaining PBMCs were cultured in RPMI
1640 for 96 h to obtain RNA. Additional PBMCs were cultured in RPMI
1640 with 100 nmol/l phorbol-12-myristate-13-acetate
(Sigma-Aldrich, St. Louis, MO, USA) for 48 h to obtain
monocyte-derived macrophages and the RNA was isolated after 96
h.
qPCR
Total RNA was isolated from the cells using TRIzol
reagent (Invitrogen Life Technologies, Carlsbad, CA, USA), with 7
μl total RNA undergoing reverse transcription in a 20-μl volume
oligo dT12–18 Primer, according to the manufacturer’s
instructions for the SuperScript® III First-Strand cDNA
Synthesis system (Invitrogen Life Technologies). A reverse
transcribed reaction (1 μl aliquot) served as the template in a 20
μl PCR, which contained 0.2 μl per primer, 9.6 μl ddH2O
and 9 μl 2.5X RealMaster SYBR Green I mix (Tiangen Biotech,
Beijing, China) for visfatin and 0.4 μl per primer, 9.2 μl
ddH2O and 9 μl 2.5X RealMaster SYBR Green I mix for
β-actin. qPCR analysis was performed in a fluorescent temperature
cycler (Mastercycler® ep realplex; Eppendorf, Hamburg,
Germany). Initial denaturation was conducted at 95°C for 2 min and
the subsequent reactions were cycled 35 times using the following
parameters to enable visfatin detection: Denaturation at 95°C for
15 sec, primer annealing at 62.7°C for 15 sec and primer extension
at 68°C for 20 sec. The human visfatin oligonucleotide primers were
as follows: Sense, 5′-aagagactgctggcatagga-3′ and antisense,
5′-accacagatacaggcactga-3′. mRNA detection of human β-actin was
conducted as follows: Denaturation at 95°C for 2 min, 40 cycles at
95°C for 15 sec, primer annealing at 60°C for 15 sec and extension
at 68°C for 20 sec. The human β-actin oligonucleotide primers were
as follows: Sense, 5′-tgacgtggacatccgcaaag-3′ and antisense,
5′-ctggaaggtggacagcgagg-3′. The lengths of the qPCR products for
visfatin and β-actin were 228 and 205 bp, respectively. Gel
electrophoresis and melting curve analysis were applied to confirm
the amplification specificity of the qPCR products from each primer
pair. Standard curve methods were used to obtain the concentration
of the samples and the relative visfatin mRNA levels were
standardized against those of β-actin.
Statistical analysis
The Shapiro-Wilk test was used to identify whether
the variables were normally distributed and Napierian logarithm
transformation was performed for specific variables, including
plasma visfatin. Numerical variables are presented as the mean ± SD
and differences between the groups were analyzed by one-way
analysis of variance, followed by Scheffé’s method or the
Games-Howell test for multiple comparisons. The paired t-test was
used to analyze the difference between PBMCs and the PBMMs and
Pearson or Spearman correlations were used to determine the
correlation between the variables. The computations were performed
using SPSS 16.0 (SPSS, Inc., Chicago, IL, USA) P<0.05 was
considered to indicate a statistically significant difference.
Results
Participant characteristics
The clinical, hormonal and metabolic parameters for
the PCOS patients and the control subjects are listed in Table I. PCOS patients were younger than
the control subjects (P=0.004), however, exhibited higher DBP
(P=0.03). The control non-IR participants demonstrated lower LH and
LH/FSH values when compared with the other three subgroups
(P≤0.003). PCOS-IR patients exhibited higher T levels than those
participants in the control IR (P=0.006) and control non-IR
(P=0.011) groups. In addition, PCOS-IR patients demonstrated lower
FSH levels (P=0.037), but higher DHEAS (P=0.04) and FINS (P=0.016)
concentrations than participants in the control non-IR group. As
predicted, the IR patients exhibited higher HOMA-IR and quantities
of triglyceride than the non-IR participants (P<0.001). The
levels of the other indexes between the subgroups were comparable
(P>0.05).
 | Table IClinical, endocrine and metabolic
characteristics of the participants. |
Table I
Clinical, endocrine and metabolic
characteristics of the participants.
| Indexes | PCOS IR (n=11) mean
(SD) | PCOS non-IR (n=10)
mean (SD) | Control IR (n=9) mean
(SD) | Control non-IR (n=12)
mean (SD) | P-value |
|---|
| Age (years) | 25.09 (4.78) | 24.7 (3.86) | 29.22 (6.92) | 30.08 (5.25) | 0.043 |
| Menarche age
(years) | 13.73 (1.79) | 13.5 (2.32) | 12.67 (1.23) | 13.58 (1.56) | 0.185a |
| SBP (mmHg) | 110 (6.33) | 107.7 (12.72) | 97.56 (7.04) | 104.58 (3.34) | 0.471a |
| DBP (mmHg) | 77.55 (7.23) | 68.9 (8.36) | 63.89 (4.17) | 68.33 (7.79) | 0.021a |
| Height (m) | 1.55 (0.04) | 1.57 (0.06) | 1.56 (0.05) | 1.55 (0.073) | 0.857 |
| Weight (kg) | 57.55 (10.51) | 49.86 (4.51) | 53.03 (8.65) | 48 (5.87) | 0.206a |
| BMI
(kg/m2) | 23.97 (4.43) | 20.31 (1.05) | 21.71 (3.66) | 20.06 (2.6) | 0.311a |
| Waist (cm) | 77.91 (10.44) | 65.6 (3.86) | 72.44 (11.31) | 69.58 (9.4) | 0.636a |
| Hip (cm) | 90.55 (6.96) | 87 (3.62) | 89.67 (4.66) | 86.17 (3.35) | 0.454a |
| WHR | 0.86 (0.07) | 0.76 (0.05) | 0.8 (0.09) | 0.81 (0.09) | 0.654a |
| E2
(pg/ml) | 69.22 (17.85) | 80.13 (26.55) | 67.68 (35.06) | 78.38 (55.24) | 0.735a |
| P (ng/ml) | 1.03 (0.31) | 1.16 (0.3) | 1.7 (2.85) | 0.78 (0.31) | 0.137a |
| T (ng/ml) | 0.89 (0.29) | 0.77 (0.31) | 0.46 (0.11) | 0.51 (0.23) | 0.001 |
| LH (mIU/ml) | 14.3 (5.11) | 15.36 (8.86) | 8.49 (5.72) | 4.53 (1.83) | <0.001a |
| FSH (mIU/ml) | 4.65 (1.12) | 5.45 (1.22) | 5.57 (1.59) | 6.33 (1.34) | 0.037 |
| LH/FSH | 3.1 (0.99) | 2.78 (1.33) | 1.91 (2.03) | 0.75 (0.44) | <0.001a |
| PRL (ng/ml) | 11.76 (4.31) | 12.54 (3.93) | 16.71 (9.1) | 15.69 (5.64) | 0.191 |
| T3
(nmol/l) | 2.34 (0.47) | 2.06 (0.16) | 2.08 (0.37) | 2.02 (0.44) | 0.236 |
| T4
(nmol/l) | 102.88 (22.02) | 107.09 (19.52) | 112.36 (21.02) | 106.91 (18.46) | 0.781 |
| PTC (nmol/l) | 559.62
(102.74) | 591.55
(123.11) | 577.74
(133.93) | 521.59 (93.85) | 0.501 |
| DHEAS (μg/dl) | 8.51 (2.87) | 6.54 (2.75) | 5.82 (1.83) | 5.45 (2.05) | 0.025 |
| FPG (mmol/l) | 5.45 (0.46) | 4.97 (0.47) | 5.22 (0.43) | 5.15 (0.31) | 0.085 |
| FINS (mIU/l) | 15.12 (4.66) | 6.13 (1.15) | 12.3 (2.69) | 6.41 (1.6) | 0.003a |
| HOMA-IR | 3.66 (1.2) | 1.35 (0.23) | 2.84 (0.62) | 1.48 (0.41) | <0.001 |
| Tch (mmol/l) | 4.14 (0.76) | 4.19 (0.54) | 4.4 (0.67) | 4.72 (0.91) | 0.246 |
| TG (mmol/l) | 1.02 (0.32) | 0.65 (0.21) | 1.12 (0.18) | 0.83 (0.27) | 0.001 |
| LDL (mmol/l) | 2.34 (0.71) | 2.23 (0.51) | 2.22 (0.86) | 2.69 (0.82) | 0.405 |
| HDL (mmol/l) | 1.45 (0.32) | 1.57 (0.21) | 1.54 (0.34) | 1.77 (0.3) | 0.085 |
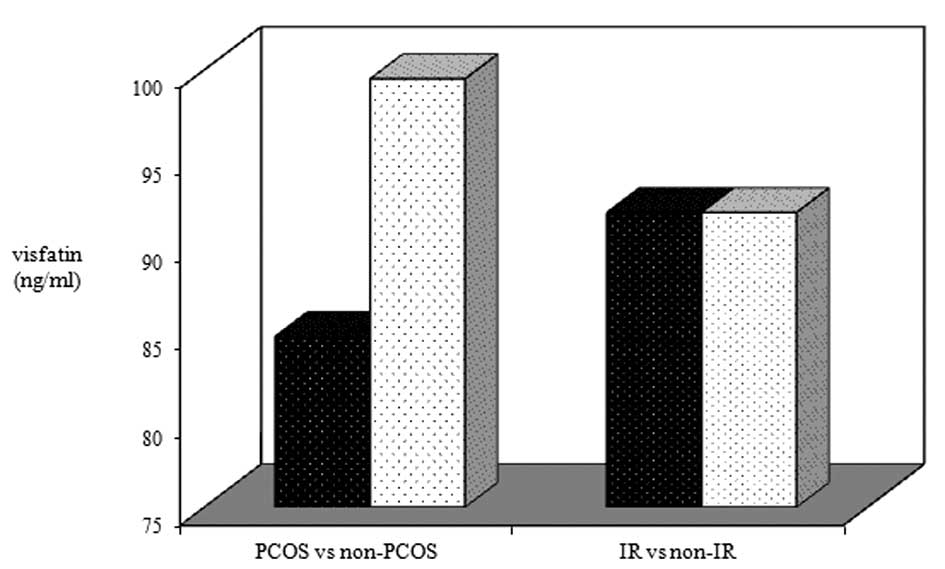
Comparison of plasma visfatin levels
No statistically significant difference was
identified in the plasma visfatin levels of the participants with
and without PCOS (84.77±1.35 vs. 99.48±1.38 ng/ml; P=0.111), either
in participants with or without IR (91.84±1.28 vs. 91.84±1.45
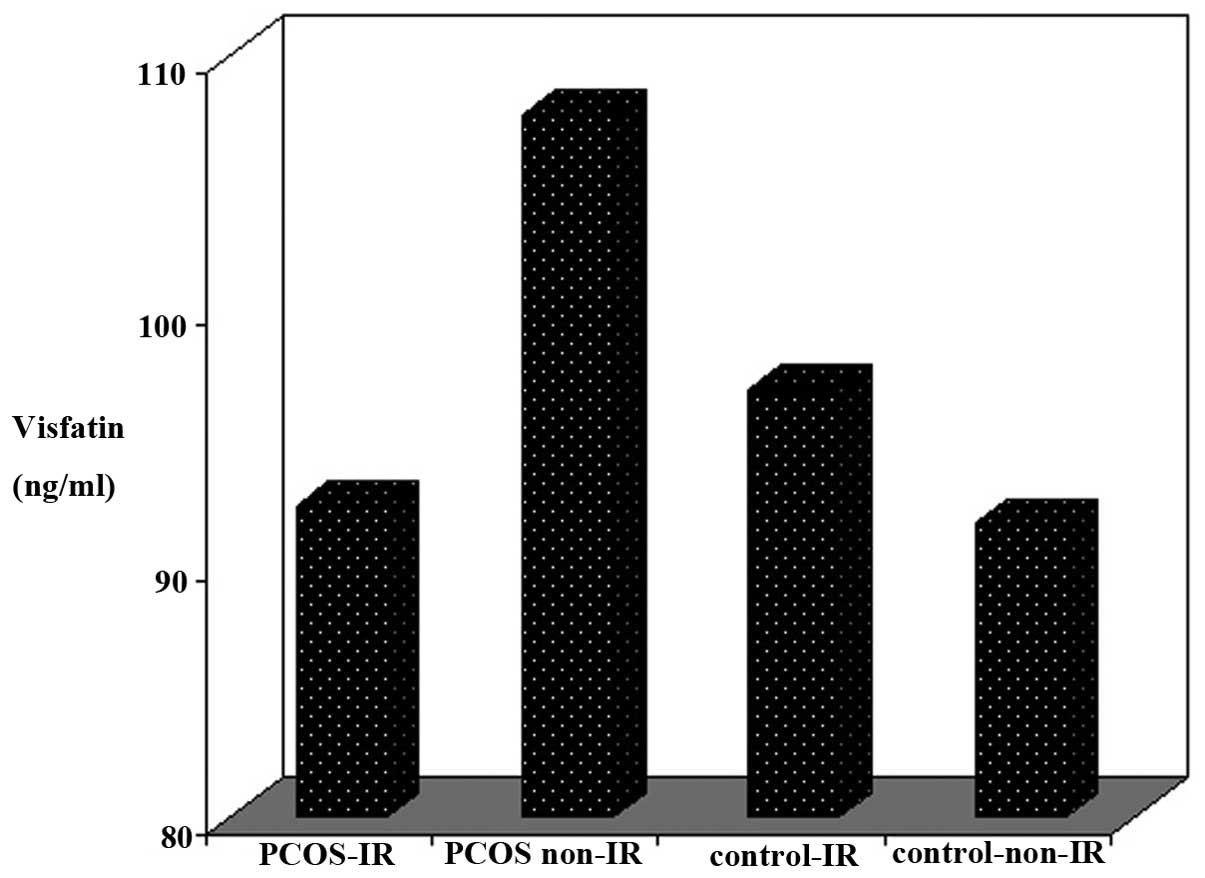
ng/ml; P=0.971; Fig. 1). No
statistically significant difference was demonstrated in plasma
visfatin levels between the PCOS-IR (92.28±20.05 ng/ml), PCOS
non-IR (108±44.28 ng/ml), control IR (96.83±34.06 ng/ml) and
control non-IR (91.58±33.22) subgroups (P=0.467, among four
subgroups; Fig. 2).
The plasma visfatin levels did not correlate with
BMI, WHR, T, LH/FSH, FINS and blood lipid levels, although positive
correlation with HOMA-IR was exhibited in the control IR patients
(r=0.717; P=0.03) and negative correlation was exhibited with FPG
in the PCOS non-IR patients (r=−0.641; P=0.046). However, the
limited sample size did not allow a reliable multivariate analysis
to be performed between the subgroups.
Comparison of visfatin mRNA
expression
Visfatin mRNA expression levels in the PBMCs of the
PCOS patients was analogous to that of the non-PCOS participants
(0.033±0.030 vs. 0.028±0.024; P=0.713). No significant differences
were identified in the mRNA expression levels of visfatin in PBMCs
between the IR and non-IR participants (0.0247±0.0248 vs.
0.036±0.028; P=0.394). Furthermore, no statistically significant
difference in visfatin mRNA expression levels was demonstrated in
PBMMs in the participants with and without PCOS (0.061±0.065 vs.
0.075±0.046; P=0.609), or with and without IR (0.053±0.043 vs.
0.083±0.064; P=0.064).
Comparison of visfatin gene
expression
Visfatin gene expression in PBMMs was greater than
that observed in PBMCs of the non-PCOS participants (P=0.014),
however, was not significantly increased in the PCOS patients
(P=0.21), IR patients (P=0.06) or the non-IR participants
(P=0.064).
Discussion
As expected, the difference in hormone levels
between the subgroups was comparable to the biochemical activity of
PCOS. Although HOMA-IR and FINS were greater in the IR patients,
the FPG levels were in the normal range, indicating that the
function of the pancreas in these patients remained in the
compensatory stage. Fallopian tube infertility patients were
enrolled as control subjects in the present study, thus, the PCOS
patients in the experimental group were younger. The DBP of the
PCOS patients was greater than that of the control subjects, which
may be the result of a disturbance in lipid metabolism and
endothelial dysfunction that frequently occurs in PCOS. The BMI of
the patients in the subgroups was normal, thus, the BMI was not
adjusted in the PCOS and control groups. Triglyceride levels were
markedly higher in the IR patients due to the increased production
of triglycerides in the liver, combined with the reduced activity
of lipoprotein lipase.
No difference in the levels of plasma visfatin was
observed in the normal weight participants with and without PCOS or
in the participants with and without IR, which was consistent with
the results of previous studies (19,20).
Increased levels of plasma visfatin have been demonstrated in other
previous studies, however, this may have been induced by the
confounding interference of obesity (10–14,17,18).
In the present study, plasma visfatin levels negatively correlated
with FPG, however, positively correlated with HOMA-IR in the PCOS
non-IR and control-IR participants, respectively. Consistent with
this, a positive correlation between plasma visfatin levels and
HOMA-IR has been observed in previous studies (11,17,21,22).
Visfatin was reported to bind to the insulin receptor via a
tyrosine kinase and phosphorylate/activate the signaling pathway,
performing insulin-like activities (9). In the present study it was
hypothesized that PCOS and IR may play contrary roles, thus, no
correlation was observed between visfatin and HOMA-IR in the
PCOS-IR patients; however, the detailed mechanism was unclear.
When compared with a control group, increased
visfatin gene expression was identified in omental adipose tissue
and in mononuclear cells of PCOS patients (17,25).
However, no significant difference in visfatin gene expression in
PBMCs and PBMMs were observed between the PCOS and non-PCOS or IR
and non-IR participants in the present study. These negative
results may be due to a number of reasons. Firstly, tubal
infertility patients were enrolled as controls in the present
study. The majority of tubal infertility cases may have been
induced by chronic pelvic inflammation, and visfatin levels may
increase in patients with inflammation. Therefore, the visfatin
levels of tubal infertility patients may also increase in a
comparable manner to that of PCOS patients. Secondly, varying gene
levels of visfatin were observed between cells in the peripheral
blood and tissue (30). Visfatin
mRNA expression levels in the PBMMs and PBMCs did not differ in the
present study. A previous study indicated that the mRNA expression
levels of visfatin in PBMCs did not correlate with the expression
that was observed in the omental adipose tissue. Therefore, it was
hypothesized that the gene expression of macrophages, infiltrated
in adipose tissue, may be different to that of PBMMs in
vitro. The inconsistencies that exist between macrophages and
PBMMs can be explained by in situ stromal elements,
including inflammatory cytokines, contributing significantly to the
production of visfatin. Therefore, future studies are required to
identify the role of visfatin in the pathogenesis of IR and PCOS on
a tissue level, including adipose and ovary tissues. Although the
sample size in the present study was small, a power calculation
based on the data from the present study may be performed for
future studies.
In conclusion, the plasma level of visfatin was not
observed to increase in the normal weight participants with PCOS or
IR and no correlation was observed. Visfatin gene expression levels
observed in the PBMCs and PBMMs were not elevated in the normal
weight PCOS subjects or the normal weight IR patients. Thus,
further investigation regarding the role of visfatin in the
pathogenesis of PCOS or IR should examine macrophages in the
tissues, rather than in the peripheral blood.
Acknowledgements
The authors would like to thank Professor Bin Zhou
for assisting with the study, Xin Pan for assisting with the
writing and Jing Zhuang, Wenjuan Li and Tingting Li for aiding with
sample collection. The present study was approved by the Health
Department of Sichuan Province (no. 100377), but did not receive
funding. The present study was funded by National natural science
fund (81270665) and supported by the Health Department of Sichuan
Province (no. 100377).
References
|
1
|
Ehrmann DA: Polycystic ovary syndrome. N
Engl J Med. 352:1223–1236. 2005. View Article : Google Scholar : PubMed/NCBI
|
|
2
|
Dunaif A and Thomas A: Current concepts in
the polycystic ovary syndrome. Annu Rev Med. 52:401–419. 2001.
View Article : Google Scholar : PubMed/NCBI
|
|
3
|
Boulman N, Levy Y, Leiba R, Shachar S,
Linn R, Zinder O and Blumenfeld Z: Increased C-reactive protein
levels in the polycystic ovary syndrome: a marker of cardiovascular
disease. J Clin Endocrinol Metab. 89:2160–2165. 2004. View Article : Google Scholar : PubMed/NCBI
|
|
4
|
Kelly CC, Lyall H, Petrie JR, Gould GW,
Connell JM and Sattar N: Low grade chronic inflammation in women
with polycystic ovarian syndrome. J Clin Endocrinol Metab.
86:2453–2455. 2001. View Article : Google Scholar : PubMed/NCBI
|
|
5
|
Vgontzas AN, Trakada G, Bixler EO, Lin HM,
Pejovic S, Zoumakis E, Chrousos GP and Legro RS: Plasma interleukin
6 levels are elevated in polycystic ovary syndrome independently of
obesity or sleep apnea. Metabolism. 55:1076–1082. 2006. View Article : Google Scholar : PubMed/NCBI
|
|
6
|
Hotamisligil GS, Peraldi P, Budavari A,
Ellis R, White MF and Spiegelman BM: IRS-1-mediated inhibition of
insulin receptor tyrosine kinase activity in TNF-alpha- and
obesity-induced insulin resistance. Science. 271:665–668. 1996.
View Article : Google Scholar : PubMed/NCBI
|
|
7
|
Yudkin JS, Kumari M, Humphries SE and
Mohamed-Ali V: Inflammation, obesity, stress and coronary heart
disease: is interleukin-6 the link? Atherosclerosis. 148:209–214.
2000. View Article : Google Scholar : PubMed/NCBI
|
|
8
|
Sun Q, Li L, Li R, et al: Overexpression
of visfatin/PBEF/Nampt alters whole-body insulin sensitivity and
lipid profile in rats. Ann Med. 41:311–320. 2009. View Article : Google Scholar : PubMed/NCBI
|
|
9
|
Fukuhara A, Matsuda M, Nishizawa M, et al:
Visfatin: a protein secreted by visceral fat that mimics the
effects of insulin. Science. 307:426–430. 2005. View Article : Google Scholar : PubMed/NCBI
|
|
10
|
Carmina E, Bucchieri S, Mansueto P, Rini
G, Ferin M and Lobo RA: Circulating levels of adipose products and
differences in fat distribution in the ovulatory and anovulatory
phenotypes of polycystic ovary syndrome. Fertil Steril. 91(4
Suppl): 1332–1335. 2009. View Article : Google Scholar : PubMed/NCBI
|
|
11
|
Cekmez F, Cekmez Y, Pirgon O, Canpolat FE,
Aydinöz S, Metin Ipcioglu O and Karademir F: Evaluation of new
adipocytokines and insulin resistance in adolescents with
polycystic ovary syndrome. Eur Cytokine Netw. 22:32–37.
2011.PubMed/NCBI
|
|
12
|
Gen R, Akbay E, Muslu N, Sezer K and Cayan
F: Plasma visfatin level in lean women with PCOS: relation to
proinflammatory markers and insulin resistance. Gynecol Endocrinol.
25:241–245. 2009. View Article : Google Scholar : PubMed/NCBI
|
|
13
|
Jongwutiwes T, Lertvikool S, Leelaphiwat
S, Rattanasiri S, Jultanmas R and Weerakiet S: Serum visfatin in
Asian women with polycystic ovary syndrome. Gynecol Endocrinol.
25:536–542. 2009. View Article : Google Scholar : PubMed/NCBI
|
|
14
|
Kowalska I, Straczkowski M, Nikolajuk A,
et al: Serum visfatin in relation to insulin resistance and markers
of hyperandrogenism in lean and obese women with polycystic ovary
syndrome. Hum Reprod. 22:1824–1829. 2007. View Article : Google Scholar : PubMed/NCBI
|
|
15
|
Ozkaya M, Cakal E, Ustun Y and Engin-Ustun
Y: Effect of metformin on serum visfatin levels in patients with
polycystic ovary syndrome. Fertil Steril. 93:880–884. 2010.
View Article : Google Scholar : PubMed/NCBI
|
|
16
|
Plati E, Kouskouni E, Malamitsi-Puchner A,
Boutsikou M, Kaparos G and Baka S: Visfatin and leptin levels in
women with polycystic ovaries undergoing ovarian stimulation.
Fertil Steril. 94:1451–1456. 2010. View Article : Google Scholar : PubMed/NCBI
|
|
17
|
Tan BK, Chen J, Digby JE, Keay SD, Kennedy
CR and Randeva HS: Increased visfatin messenger ribonucleic acid
and protein levels in adipose tissue and adipocytes in women with
polycystic ovary syndrome: parallel increase in plasma visfatin. J
Clin Endocrinol Metab. 91:5022–5028. 2006. View Article : Google Scholar
|
|
18
|
Yildiz BO, Bozdag G, Otegen U, et al:
Visfatin and retinol-binding protein 4 concentrations in lean,
glucose-tolerant women with PCOS. Reprod Biomed Online. 20:150–155.
2010. View Article : Google Scholar : PubMed/NCBI
|
|
19
|
Dikmen E, Tarkun I, Cantürk Z and
Cetinarslan B: Plasma visfatin level in women with polycystic ovary
syndrome. Gynecol Endocrinol. 27:475–479. 2011. View Article : Google Scholar : PubMed/NCBI
|
|
20
|
Lajunen TK, Purhonen AK, Haapea M, et al:
Full-length visfatin levels are associated with inflammation in
women with polycystic ovary syndrome. Eur J Clin Invest.
42:321–328. 2012. View Article : Google Scholar : PubMed/NCBI
|
|
21
|
Tarkun I, Dikmen E, Cetinarslan B and
Cantürk Z: Impact of treatment with metformin on adipokines in
patients with polycystic ovary syndrome. Eur Cytokine Netw.
21:272–277. 2010.PubMed/NCBI
|
|
22
|
Zwirska-Korczala K, Sodowski K, Konturek
SJ, et al: Postprandial response of ghrelin and PYY and indices of
low-grade chronic inflammation in lean young women with polycystic
ovary syndrome. J Physiol Pharmacol. 59(Suppl 2): 161–178.
2008.PubMed/NCBI
|
|
23
|
Chan TF, Chen YL, Chen HH, Lee CH, Jong SB
and Tsai EM: Increased plasma visfatin concentrations in women with
polycystic ovary syndrome. Fertil Steril. 88:401–405. 2007.
View Article : Google Scholar : PubMed/NCBI
|
|
24
|
Tsiotra PC, Tsigos C, Yfanti E, et al:
Visfatin, TNF-alpha and IL-6 mRNA expression is increased in
mononuclear cells from type 2 diabetic women. Horm Metab Res.
39:758–763. 2007. View Article : Google Scholar : PubMed/NCBI
|
|
25
|
Seow KM, Hwang JL, Wang PH, Ho LT and Juan
CC: Expression of visfatin mRNA in peripheral blood mononuclear
cells is not correlated with visfatin mRNA in omental adipose
tissue in women with polycystic ovary syndrome. Hum Reprod.
26:2869–2873. 2011. View Article : Google Scholar : PubMed/NCBI
|
|
26
|
Peng KH, Xue M and Xiao SS: mRNA
expression of visfatin in omentaladipose tissue in polycystic ovary
syndrome. Xian Dai Sheng Wu Yi Xue Jin Zhan. 13:2514–2516.
25372009.(In Chinese).
|
|
27
|
Rotterdam ESHRE/ASRM-Sponsored PCOS
Consensus Workshop Group. Revised 2003 consensus on diagnostic
criteria and long-term health risks related to polycystic ovary
syndrome. Fertil Steril. 81:19–25. 2004. View Article : Google Scholar
|
|
28
|
Chen X, Yang D, Li L, Feng S and Wang L:
Abnormal glucose tolerance in Chinese women with polycystic ovary
syndrome. Hum Reprod. 21:2027–2032. 2006. View Article : Google Scholar : PubMed/NCBI
|
|
29
|
Matthews DR, Hosker JP, Rudenski AS,
Naylor BA, Treacher DF and Turner RC: Homeostasis model assessment:
insulin resistance and beta-cell function from fasting plasma
glucose and insulin concentrations in man. Diabetologia.
28:412–419. 1985. View Article : Google Scholar : PubMed/NCBI
|
|
30
|
Curat CA, Wegner V, Sengenès C, Miranville
A, Tonus C, Busse R and Bouloumié A: Macrophages in human visceral
adipose tissue: increased accumulation in obesity and a source of
resistin and visfatin. Diabetologia. 49:744–747. 2006.PubMed/NCBI
|