Introduction
Coronary artery disease (CAD) is the most common
type of cardiovascular disease and leading cause of mortality
worldwide (1). The disease is
mainly caused by the build-up of plaque along the inner walls of
heart arteries, which narrows the arteries and restricts blood
flow. Typically, the majority of patients do not exhibit symptoms
for decades in the progression of CAD. For the majority of
individuals, the first onset of symptoms is acute myocardial
infarction (heart attack). Numerous studies have been conducted
with the aim of proposing promising strategies for the prevention
and treatment of CAD. However, the morbidity and mortality rates of
CAD remain high. Currently available high throughput experimental
strategies aid the understanding of the pathogenic mechanism of
CAD, constituting a significant advance for the development or
improvement of novel strategies for the noninvasive diagnosis and
treatment of CAD.
Previous gene expression studies (2–5) have
proposed distinct gene expression patterns in CAD. Dysregulation of
various biological processes, including the inflammatory process
and cell cycle control, have been consistently detected in CAD
patients (6,7). These studies used standard
variance/regression analysis to identify differentially expressed
genes. However, these analyses are unable to remove unaccounted
array specific factors. For example, it is possible that specific
genes are identified to be overexpressed or downregulated due to
specific demographic profiles. A previous study (8) hypothesized that partial least squares
(PLS)-based microarray analysis was robust in detecting disease
specific genes. The PLS-based analysis method uses variable
selection according to the analysis of the regression coefficients
of PLS (9). Compared with
variance/regression analysis, PLS-based analysis has higher
sensitivity, reasonably high specificity and markedly smaller false
discovery (FDR) and false non-discovery rates (8). In multiple regression analysis, the
Monte Carlo cross-validation method is a powerful and widely used
technique which was first reported by Picard and Cook (10). The use of Monte Carlo
cross-validation in multiple regression analysis has been proposed
in previous studies (11,12) and integration of the PLS and Monte
Carlo technique is efficient in variable selection (13). Determining the gene expression
signatures of CAD with the PLS-based method may further improve the
understanding of the molecular mechanism and advance preventative
or therapeutic procedures.
In the present study, using a microarray data set
downloaded from the Gene Expression Omnibus (GEO) database, the
pathological mechanism of CAD was investigated using PLS-based
analysis. Gene Ontology (GO) items with significantly
over-represented dysregulated genes were also acquired and
protein-protein interaction (PPI) network analysis was performed to
identify crucial genes among the dysregulated genes.
Materials and methods
Microarray data
The microarray data set, GSE12288, was downloaded
from the GEO database (http://www.ncbi.nlm.nih.gov/geo/). This gene
expression profile included 110 CAD patients and 112 healthy
controls. The Duke CAD index (CADi) (14,15)
was measured for each subject. The data set was based on the GPL96
platform: [HG-U133A] Affymetrix Human Genome U133A Array.
Gene selection
Entire data sets for all the samples were
downloaded. Robust multiarray analysis (16) was used to normalize the raw
intensity values. Firstly, the effects of background noise and the
processing artifacts were neutralized using model-based background
correction. Secondly, expression values of all the probes were
aligned to a common scale using quantile normalization. Finally, an
expression value for each probe was generated via an iterative
median polishing procedure. The resulting log2-transformed
expression values were then used for subsequent analysis.
A multivariate linear model was used to analyze the
association between gene expression levels and CADi. In the data
set, the number of probes (n=22,283) was much greater than the
sample number (n=221; one sample was deleted due to poor data
quality). PLS, a dimension reduction procedure (17,18),
was then used to estimate the effects for each gene. PLS latent
variables derived from the expression profiles on CADi were
calculated using the non-linear iterative PLS algorithm (19). Next, the variable importance on the
projection (VIP) (20) was
calculated to evaluate the importance of the genes on CADi. In
addition, permutation tests were used to control the FDR. A
permutation procedure (performed 1,000 times) was performed to
obtain the empirical distribution of PLS-based VIP in each
replicate. The FDR for each gene was evaluated based on the
empirical distribution. Candidate genes were selected with a
cut-off FDR value of <0.05.
The best number of latent variables was then
determined using 4-fold cross-validation with root mean square
error of cross-validation (RMSECV). Next, regression coefficient
reliability was introduced using the Monte Carlo method (13). Firstly, 100 Monte Carlo sampling
subsets, each of which included half of the total samples, were
used to calculate the regression coefficient vector for each sub
PLS model. Secondly, the regression coefficient reliability was
calculated for each candidate gene. Regression coefficient
reliability revealed not only a large coefficient, but also the
stability of the genes for the disease. This was useful to
alleviate deviation of the sampling and develop a robust disease
prediction model with the most reliable target tag genes. An
absolute value of regression coefficient reliability cut-off was
selected according to the lowest RMSECV. Finally, genes that had
absolute reliability values larger than the cut-off and FDR of VIP
values <0.05 were selected as the target tag gene set.
Enrichment analysis
Probes on the array were annotated according to the
simple omnibus format in text files. To determine the biologically
relevant signatures of the selected genes, enrichment analysis was
performed. All the genes were annotated based on the GO database
(21). The hypergeometric
distribution test was then implemented to identify pathways that
were significantly enriched with the selected genes.
Network analysis
PPI is crucial for all biological processes
(22). Selected genes that had a
large number of interactions with other genes were considered to
have more important roles in the pathogenesis. To visualize the
interactions among the selected genes and identify the key
molecules, a network was constructed using Cytoscape (V 2.8.3;
http://www.cytoscape.org/) (23) and the National Center for
Biotechnology Information database (http://ftp.ncbi.nlm.nih.gov/gene/GeneRIF/; accessed on
the 25-2-2013). The degree of a gene was equal to the number of
interactions the gene exhibited. Genes with a degree of >10 were
considered as critical hub molecules.
Results
Gene selection
Gene expression profiles of 110 CAD patients and 111
healthy controls (one sample was deleted due to low quality) were
used for subsequent analysis. PLS analysis revealed that 1,246
genes were considered as candidate genes with FDR of VIP values of
<0.05. To avoid model over-fitting, the best number of latent
variables was then determined by 4-fold cross-validation with
RMSECV. The results indicated that RMSECV values exhibited a
descending trend with an increase in latent variable number,
however, the trend decreased in strength with latent variable
numbers of >8. Therefore, the top eight latent variables were
selected for further analysis. Regression coefficient reliability
of each candidate gene was calculated and the cut-off value (1.434)
was determined according to the lowest RMSECV value. In total, 390
genes were selected.
Enrichment analysis
Table I represents
the top five GO items enriched with the selected genes. Of all the
genes in the array, 12,291 genes were annotated based on the GO
database, including 358 selected genes. Items with significantly
increased representations of the selected genes included
transforming growth factor β-activated receptor (TGFBR) activity,
acyl-CoA oxidase activity, transcription regulatory region
sequence-specific DNA binding, erythrocyte differentiation and
negative regulation of the mitogen-activated protein kinase
cascade.
 | Table ITop five GO items enriched with the
selected genes. |
Table I
Top five GO items enriched with the
selected genes.
| GO
identification | Description | P-value |
|---|
| 0005024 | TGFBR activity | 8.08E-06 |
| 0003997 | Acyl-CoA oxidase
activity | 1.01E-05 |
| 0000976 | Transcription
regulatory region sequence-specific DNA binding | 1.63E-05 |
| 0030218 | Erythrocyte
differentiation | 3.01E-05 |
| 0043409 | Negative regulation
of the MAPK cascade | 4.11E-04 |
Network analysis
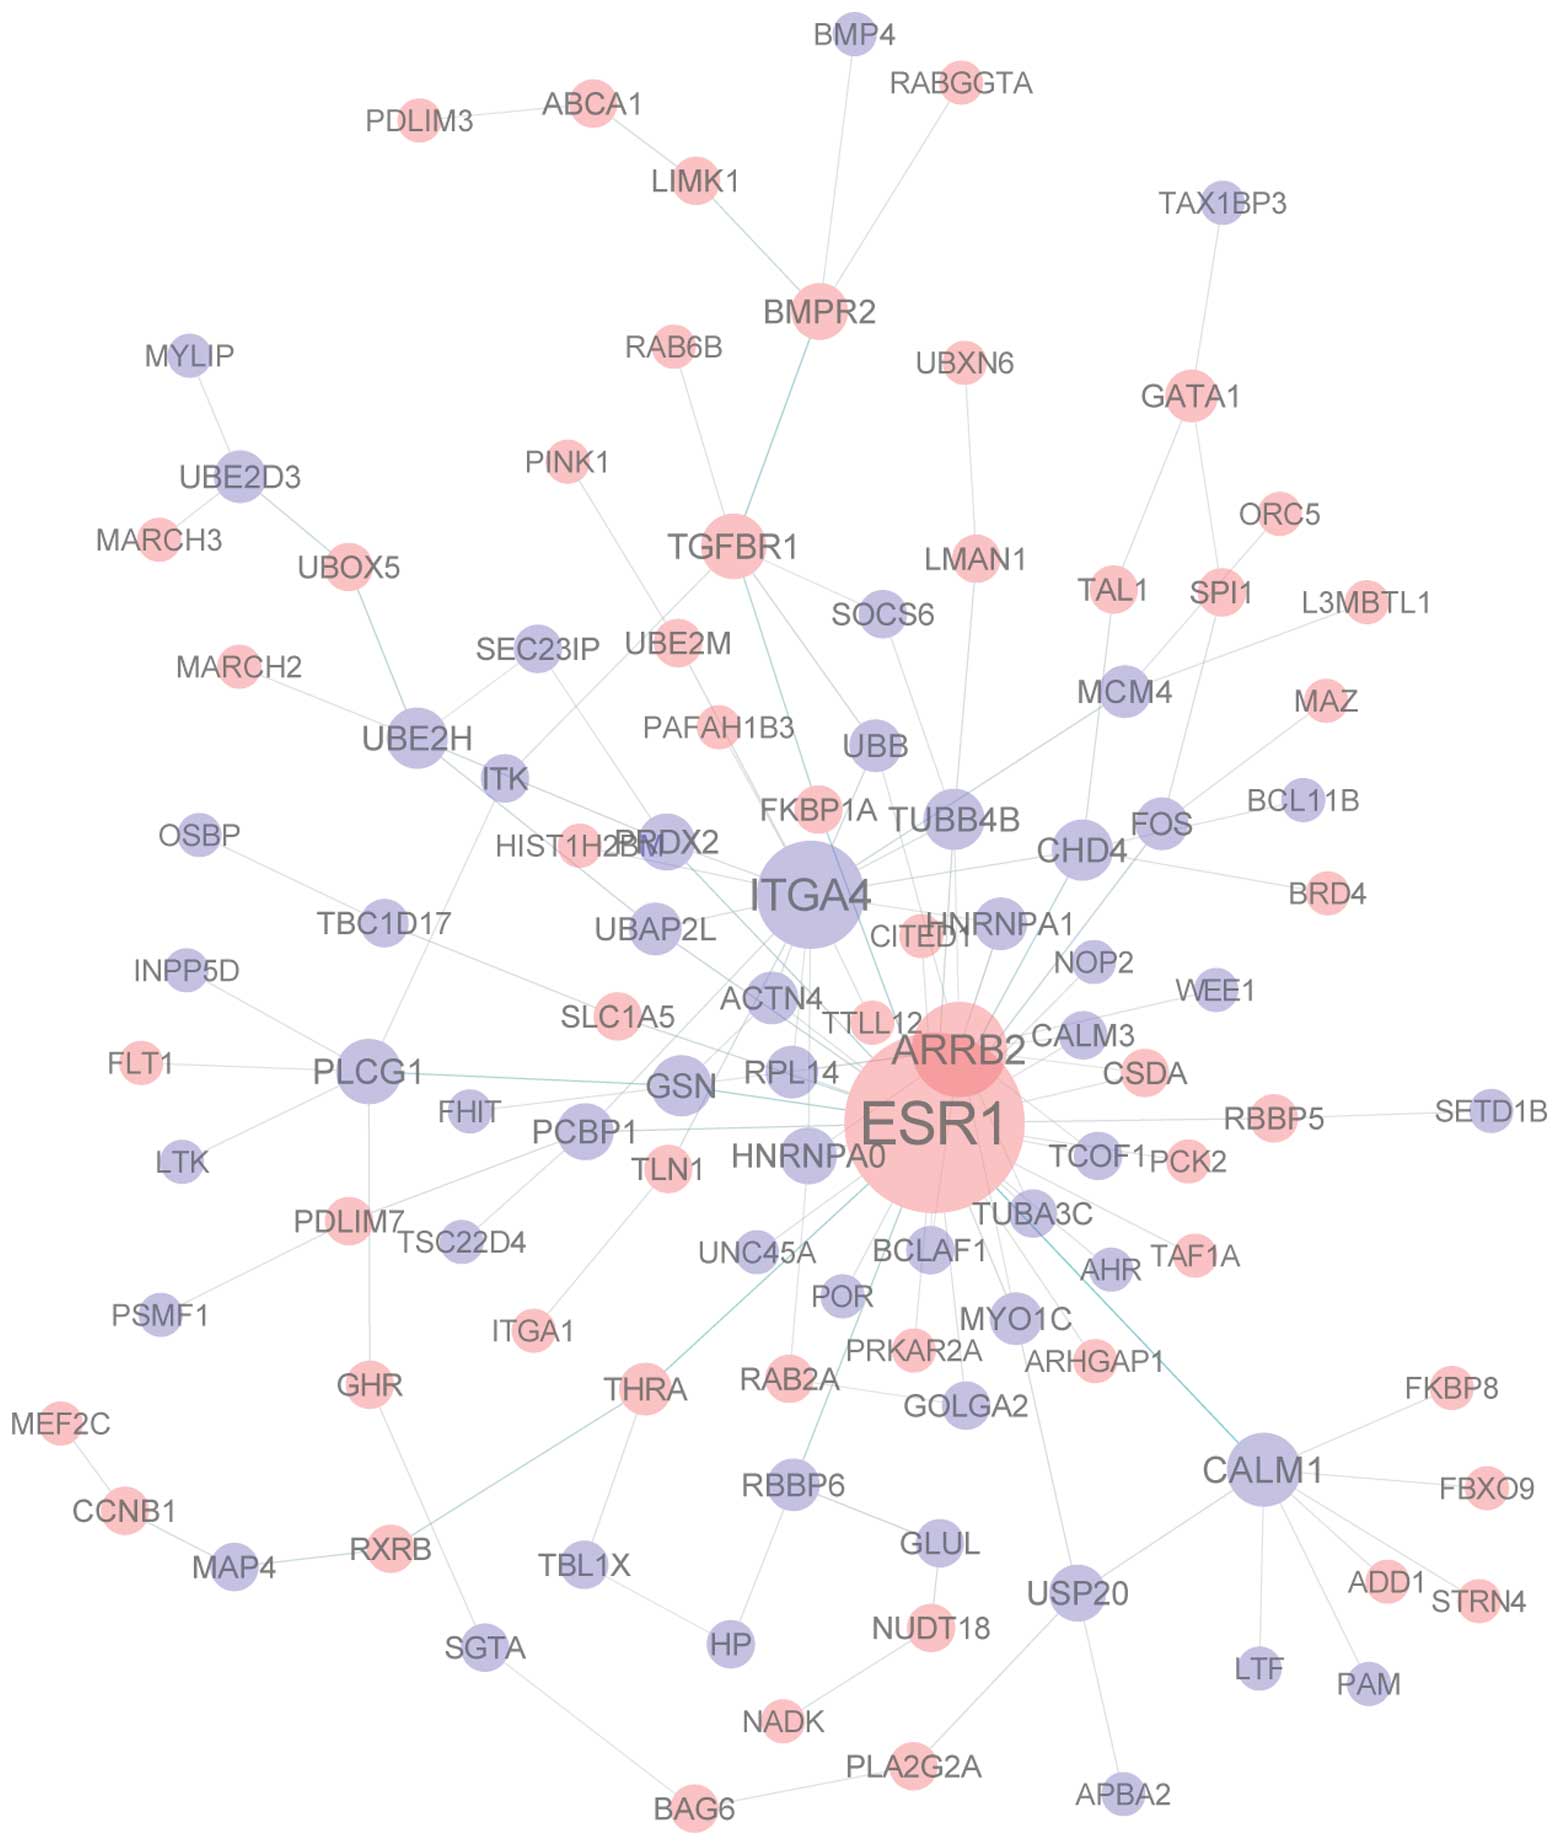
Fig. 1 illustrates
the interaction network of the proteins encoded by the selected
genes. Hub molecules that had a degree of >10 included ESR1,
ITGA4 and ARRB2, with degrees of 33, 16 and 13, respectively.
Discussion
CAD is a highly complex disease. Gene expression
profiling is important for investigating the underlying
pathophysiological cascades in CAD. For data analysis, a suitable
model is required to manage the large number of genes and the
relatively small sample size. Previous gene expression studies on
CAD primarily used variance/regression analysis, without
considering the hidden biological effects. In the present study, an
integration of the PLS and Monte Carlo technique (13) was used to identify differentially
expressed genes in CAD. Biological process and interaction network
analysis were also used to explore the underlying mechanism.
GO item enrichment analysis revealed that TGFBR
activity (GO:0005024) was the most significant GO item with
over-represented dysregulated genes (Table I). All the dysregulated genes in
this item were upregulated in CAD patients, including TGFBR1. A
previous study revealed that the inhibition of TGFBR1 results in
significant amelioration of deleterious cardiac remodeling
following myocardial infarction (24). The results of the present study
indicated that TGFBR1 and other TGFBRs may function as potential
targets for further treatment investigation studies. Significantly
increased numbers of dysregulated genes were also identified in the
acyl-CoA oxidase activity item. A previous study (25) hypothesized that supplementation
with polyphenolic-rich extract of Angelica acutiloba root
for high-fat diet-induced obese rats significantly decreased the
CAD risk index by enhancing the expression of acyl-CoA oxidase. The
results of the present study confirmed the involvement of acyl-CoA
oxidase in the pathogenesis of CAD.
Interaction network analysis revealed that ESR1 was
the hub gene with the highest degree (Fig. 1). The protein encoded by this gene
is the estrogen receptor. Genetic polymorphisms of ESR1 have been
shown to be associated with CAD in various populations (26–28)
and the results of the present study confirmed the involvement of
ESR1 in CAD. ITGA4 was also identified as a hub gene with the
second highest degree (Fig. 1).
The protein encoded by this gene belongs to the integrin α chain
family of proteins. No previous studies have proposed an
association between CAD and ITGA4, however, gene targeting
experiments in mice have demonstrated an essential role of ITGA4 in
normal epicardial development (29). Therefore, the association between
ITGA4 and CAD requires further investigation. ARRB2 was also
identified as a hub gene with a degree of 13. The protein encoded
by this gene belongs to the arrestin/β-arrestin protein family.
Similarly, no previous studies have proposed an association between
CAD and ARRB2, thus, further study is required to investigate the
involvement of this gene in the pathogenesis of CAD.
In conclusion, using a gene expression microarray
data set downloaded from the GEO database, PLS-based analysis
integrated with the Monte Carlo technique was performed to identify
genes which may contribute to the pathology of CAD. Further
analysis was also conducted to identify biological processes and
hub genes associated with the disease. Therefore, the results of
the present study facilitate the disclosure of the molecular
mechanism underlying CAD.
References
|
1
|
Thomas AC, Knapman PA, Krikler DM and
Davies MJ: Community study of the causes of ‘natural’ sudden death.
BMJ. 297:1453–1456. 1988.
|
|
2
|
Hiltunen MO, Tuomisto TT, Niemi M, et al:
Changes in gene expression in atherosclerotic plaques analyzed
using DNA array. Atherosclerosis. 165:23–32. 2002. View Article : Google Scholar : PubMed/NCBI
|
|
3
|
Nanni L, Romualdi C, Maseri A and
Lanfranchi G: Differential gene expression profiling in genetic and
multifactorial cardiovascular diseases. J Mol Cell Cardiol.
41:934–948. 2006. View Article : Google Scholar : PubMed/NCBI
|
|
4
|
Randi AM, Biguzzi E, Falciani F, et al:
Identification of differentially expressed genes in coronary
atherosclerotic plaques from patients with stable or unstable
angina by cDNA array analysis. J Thromb Haemost. 1:829–835. 2003.
View Article : Google Scholar
|
|
5
|
Seo D, Wang T, Dressman H, et al: Gene
expression phenotypes of atherosclerosis. Arterioscler Thromb Vasc
Biol. 24:1922–1927. 2004. View Article : Google Scholar
|
|
6
|
Cagnin S, Biscuola M, Patuzzo C, et al:
Reconstruction and functional analysis of altered molecular
pathways in human atherosclerotic arteries. BMC Genomics.
10:132009. View Article : Google Scholar : PubMed/NCBI
|
|
7
|
Sluimer JC, Kisters N, Cleutjens KB, et
al: Dead or alive: gene expression profiles of advanced
atherosclerotic plaques from autopsy and surgery. Physiol Genomics.
30:335–341. 2007. View Article : Google Scholar : PubMed/NCBI
|
|
8
|
Chakraborty S and Datta S and Datta S:
Surrogate variable analysis using partial least squares (SVA-PLS)
in gene expression studies. Bioinformatics. 28:799–806. 2012.
View Article : Google Scholar : PubMed/NCBI
|
|
9
|
Centner V, Massart DL, de Noord OE, de
Jong S, Vandeginste BM and Sterna C: Elimination of uninformative
variables for multivariate calibration. Anal Chem. 68:3851–3858.
1996. View Article : Google Scholar : PubMed/NCBI
|
|
10
|
Picard RR and Cook RD: Cross-validation of
regression models. J Am Stat Assoc. 79:575–583. 1984. View Article : Google Scholar
|
|
11
|
Xu QS, Liang YZ and Du YP: Monte Carlo
cross-validation for selecting a model and estimating the
prediction error in multivariate calibration. J Chemom. 18:112–120.
2004. View
Article : Google Scholar
|
|
12
|
Gourvénec S, Fernández Pierna JA, Massart
DL and Rutledge DN: An evaluation of the PoLiSh smoothed regression
and the Monte Carlo cross-validation for the determination of the
complexity of a PLS model. Chemometr Intell Lab Syst. 68:41–51.
2003.
|
|
13
|
Cai WS, Li YK and Shao XG: A variable
selection method based on uninformative variable elimination for
multivariate calibration of near-infrared spectra. Chemometr Intell
Lab. 90:188–194. 2008. View Article : Google Scholar
|
|
14
|
Felker GM, Shaw LK and O’Connor CM: A
standardized definition of ischemic cardiomyopathy for use in
clinical research. J Am Coll Cardiol. 39:210–218. 2002. View Article : Google Scholar : PubMed/NCBI
|
|
15
|
Mark DB, Nelson CL, Califf RM, et al:
Continuing evolution of therapy for coronary artery disease.
Initial results from the era of coronary angioplasty. Circulation.
89:2015–2025. 1994. View Article : Google Scholar : PubMed/NCBI
|
|
16
|
Irizarry RA, Hobbs B, Collin F, et al:
Exploration, normalization, and summaries of high density
oligonucleotide array probe level data. Biostatistics. 4:249–264.
2003. View Article : Google Scholar
|
|
17
|
Helland IS: On the structure of partial
least squares regression. Commun Stat-Simulation Comput.
17:581–607. 1988. View Article : Google Scholar
|
|
18
|
Helland IS: Partial least squares
regression and statistical model. Scand J Stat. 17:97–144.
1990.
|
|
19
|
Martins JPA, Teófilo RF and Ferreira MMC:
Computational performance and cross-validation error precision of
five PLS algorithms using designed and real data sets. J Chemom.
24:320–332. 2010.
|
|
20
|
Gosselin R, Rodrigue D and Duchesne C: A
bootstrap-VIP approach for selecting wavelength intervals in
spectral imaging applications. Chemometr Intell Lab Syst.
100:12–21. 2010. View Article : Google Scholar
|
|
21
|
Ashburner M, Ball CA, Blake JA, et al:
Gene ontology: tool for the unification of biology. The Gene
Ontology Consortium. Nat Genet. 25:25–29. 2000. View Article : Google Scholar : PubMed/NCBI
|
|
22
|
Stelzl U, Worm U, Lalowski M, et al: A
human protein-protein interaction network: a resource for
annotating the proteome. Cell. 122:957–968. 2005.PubMed/NCBI
|
|
23
|
Shannon P, Markiel A, Ozier O, et al:
Cytoscape: a software environment for integrated models of
biomolecular interaction networks. Genome Res. 13:2498–2504. 2003.
View Article : Google Scholar : PubMed/NCBI
|
|
24
|
Ellmers LJ, Scott NJ, Medicherla S, et al:
Transforming growth factor-beta blockade down-regulates the
renin-angiotensin system and modifies cardiac remodeling after
myocardial infarction. Endocrinology. 149:5828–5834. 2008.
View Article : Google Scholar : PubMed/NCBI
|
|
25
|
Liu IM, Tzeng TF, Liou SS and Chang CJ:
Regulation of obesity and lipid disorders by extracts from
Angelica acutiloba root in high-fat diet-induced obese rats.
Phytother Res. 26:223–230. 2012.PubMed/NCBI
|
|
26
|
Almeida S and Hutz MH: Estrogen receptor 1
gene polymorphisms and coronary artery disease in the Brazilian
population. Braz J Med Biol Res. 39:447–454. 2006. View Article : Google Scholar : PubMed/NCBI
|
|
27
|
Lawlor DA, Timpson N, Ebrahim S, Day IN
and Smith GD: The association of oestrogen receptor
alpha-haplotypes with cardiovascular risk factors in the British
Women’s Heart and Health Study. Eur Heart J. 27:1597–1604.
2006.PubMed/NCBI
|
|
28
|
Wei CD, Zheng HY, Wu W, et al:
Meta-analysis of the association of the rs2234693 and rs9340799
polymorphisms of estrogen receptor alpha gene with coronary heart
disease risk in Chinese Han population. Int J Med Sci. 10:457–466.
2013. View Article : Google Scholar : PubMed/NCBI
|
|
29
|
Dettman RW, Pae SH, Morabito C and Bristow
J: Inhibition of alpha4-integrin stimulates epicardial-mesenchymal
transformation and alters migration and cell fate of epicardially
derived mesenchyme. Dev Biol. 257:315–328. 2003. View Article : Google Scholar
|