Introduction
Fungal infections affect superficial keratinized
tissues, including the skin, hair and nails, in humans and animals
resulting in difficult-to-treat dermatosis. Fungi derived from pet
dogs and cats, including dermatophytes (Deuteromycotina,
Hyphomycetes, Hyphomycetales, Moniliaceae, Trichophyton,
Microsporum and Epidermophyton), Malassezia,
Saccharomycetes (mainly Candida) and non-dermatophyte molds
(Scopulariopsis, Aspergillus and Fusarium),
are also able to infect human skin (1). The routine identification and
classification of these skin-infecting fungi is mainly based on
clinical symptoms and the morphological and/or biochemical
characteristics of the fungi. In recent years, molecular
approaches, including pulsed-field gel electrophoresis, random
amplified polymorphic DNA analysis, polymerase chain reaction (PCR)
amplification using NTS and internal transcribed spacer (ITS)
primers (2), nested-PCR,
PCR-restriction fragment length polymorphism (RFLP) analysis,
arbitrary primer PCR and ITS region sequencing (3), have been used for the identification
of dermatophyte species and strains.
The simple repetitive oligonucleotide,
(GACA)4, is a highly variable microsatellite that has
been used as a PCR primer for the efficient identification of skin
tinea infections and pathogenic Candida species (4). PCR using (GACA)4 has also
been used for the classification and identification of human
pathogenic fungi (5). In the
present study, microsatellite (GACA)4 and
non-transcribed spacer (NTS) primers were used to perform PCR
amplification with the aim of identifying and characterizing
dermatophyte isolates from dogs and cats to a species and strain
level.
Materials and methods
Fungal strains
Pathogenic fungal strains were isolated from pet
dogs and cats. In total, 45 strains were analyzed for species
identification and characterization, including five strains from
each of the following species: Trichophyton rubrum (T.
rubrum), Trichophyton mentagrophytes (T.
mentagrophytes), Epidermophyton floccosum (E.
floccosum), Microsporum canis (M. canis),
Microsporum gypseum (M. gypseum), Candida
albicans (C. albicans), Candida tropicalis (C.
tropicalis), Candida glabrata (C. glabrata) and
Candida parapsilosis (C. parapsilosis).
For strain comparison, 54 strains of T.
rubrum, 26 strains of T. mentagrophytes and 32 strains
of M. canis were collected from four cities, namely Nanjing,
Wuxi, Shanghai and Hangzhou in China.
The strains were cultured in Sabouraud dextrose agar
medium at 27°C with a humidity of 95% in a mold incubator.
Filamentous fungi were usually cultured for 2 weeks, whereas yeasts
were cultured for 2–3 days.
DNA extraction and purification
Fungal genomic DNA was extracted using the benzyl
chloride extraction method and purified with phenol-chloroform as
previously described (6,7). Growing fungi were harvested through
filtration and washed three times with sterile saline. The samples
were transferred to 1.5-ml microcentrifuge tubes and subjected to
centrifugation at 5,700 × g at room temperature for 1 min. Next,
500 μl extraction buffer [100 mM Tris-HCl (pH 9.0) and 40 mM EDTA],
100 μl sodium dodecyl sulfate (10%) and 300 μl benzyl chloride
(Sinochem Ningbo Chemicals Co., Ltd., Ningbo, China) were added.
The mixture was vortexed and incubated at 50°C for 3 min with mild
shaking. Following centrifugation at 6,000 × g at a temperature of
4°C for 10 min, the supernatant was collected in a new tube. Next,
300 μl sodium acetate (3 M) was added and the samples were mixed
and centrifuged again at 6,000 × g at 4°C for 10 min. Following
aspiration, the supernatant was transferred into a tube containing
500 μl isopropanol. The sample was stored at −70°C for 1 h and DNA
was precipitated following centrifugation at 6,000 × g at 4°C for
10 min. Extracted DNA was treated with RNase A and then with
phenol/chloroform/isoamyl alcohol (v:v:v, 25:24:1; all purchased
from Sinochem Ningbo Chemicals Co., Ltd.). Following 2 or 3
centrifugations, DNA was precipitated with ice-cold pure ethanol,
washed with 70% ethanol, air-dried and then resuspended in
Tris-EDTA buffer for additional study. Yeast genomic DNA was
prepared using a quick DNA extraction kit (Shanghai Huashun
Bioengineering Co., Ltd., Shanghai, China), according to the
manufacturer’s instructions.
PCR amplification
PCR amplification was conducted in volumes of 100 μl
containing 10 mM Tris-HCl (pH 9.0), 0.1% Triton X-100, 50 mM KCl,
1.5 mM MgCl2, 200 μM dATP, dCTP, dGTP and dTTP, 5 units
Taq DNA polymerase (Takara Bio, Inc., Dalian, China), 2.5 μM
primer and 20 ng template DNA. Primer sequences are shown in
Table I (synthesized by Shanghai
Yingweijie Co., Shanghai, China). PCR amplification was performed
in a GeneAmp PCR System 9600 (Perkin-Elmer, Norwalk, CT, USA).
Samples were first heated at 94°C for 4 min, followed by 35 cycles
of 92°C for 1 min, 55°C for 1 min (NTS-1 primers) or 58°C for 1 min
(NTS-2 primers) and 72°C for 2 min, prior to an extension step at
72°C for 10 min. For amplification using (GACA)4, PCR
was carried out for 39 cycles of denaturation at 93°C for 1 min,
annealing at 50°C for 1 min, and extension at 72°C for 1 min,
followed by a final extension step at 72°C for 7 min. The products
were electrophoresed in 2% agarose gels and detected using a gel
imaging analysis system (Bio-Rad, Hercules, CA, USA).
 | Table IPCR primer sets. |
Table I
PCR primer sets.
| Regions | Primers | Sequences |
|---|
| NTS-1 | TrNTSF-2 | 5′-ACC GTA TTA AGC
TAG CGC TGC-3′ |
| TrNTSR-4 | 5′-TGC CAC TTC GAT
TAG GAG GC-3′ |
| NTS-2 | TrNTSR-1 | 5′-CTC AGT CGA ACC
GTG AGG C-3′ |
| TrNTSC-1 | 5′-CGA GAC CAC GTG
ATA CAT GCG-3′ |
Statistical analysis
Data were analyzed using SPSS software, version 10.0
(SPSS, Inc., Chicago, IL, USA). Differences were compared with the
χ2 test and P<0.05 was considered to indicate a
statistically significant difference.
Results
Identification of dermatophyte species
using (GACA)4 primer-based PCR
PCR, with the short oligonucleotide
(GACA)4 as a primer, was performed to identify and
characterize dermatophytes. DNA products were determined by gel
electrophoresis and image analysis. The results showed that the PCR
product bands ranged between 300 and 3,000 bp (Fig. 1). Based on clinical phenotypic
analysis, strains from the same species produced similar patterns,
but these patterns changed from species to species (Fig. 1). These results indicate that
(GACA)4 primer-based PCR is able to distinguish between
various dermatophyte species, which may be useful for species
identification.
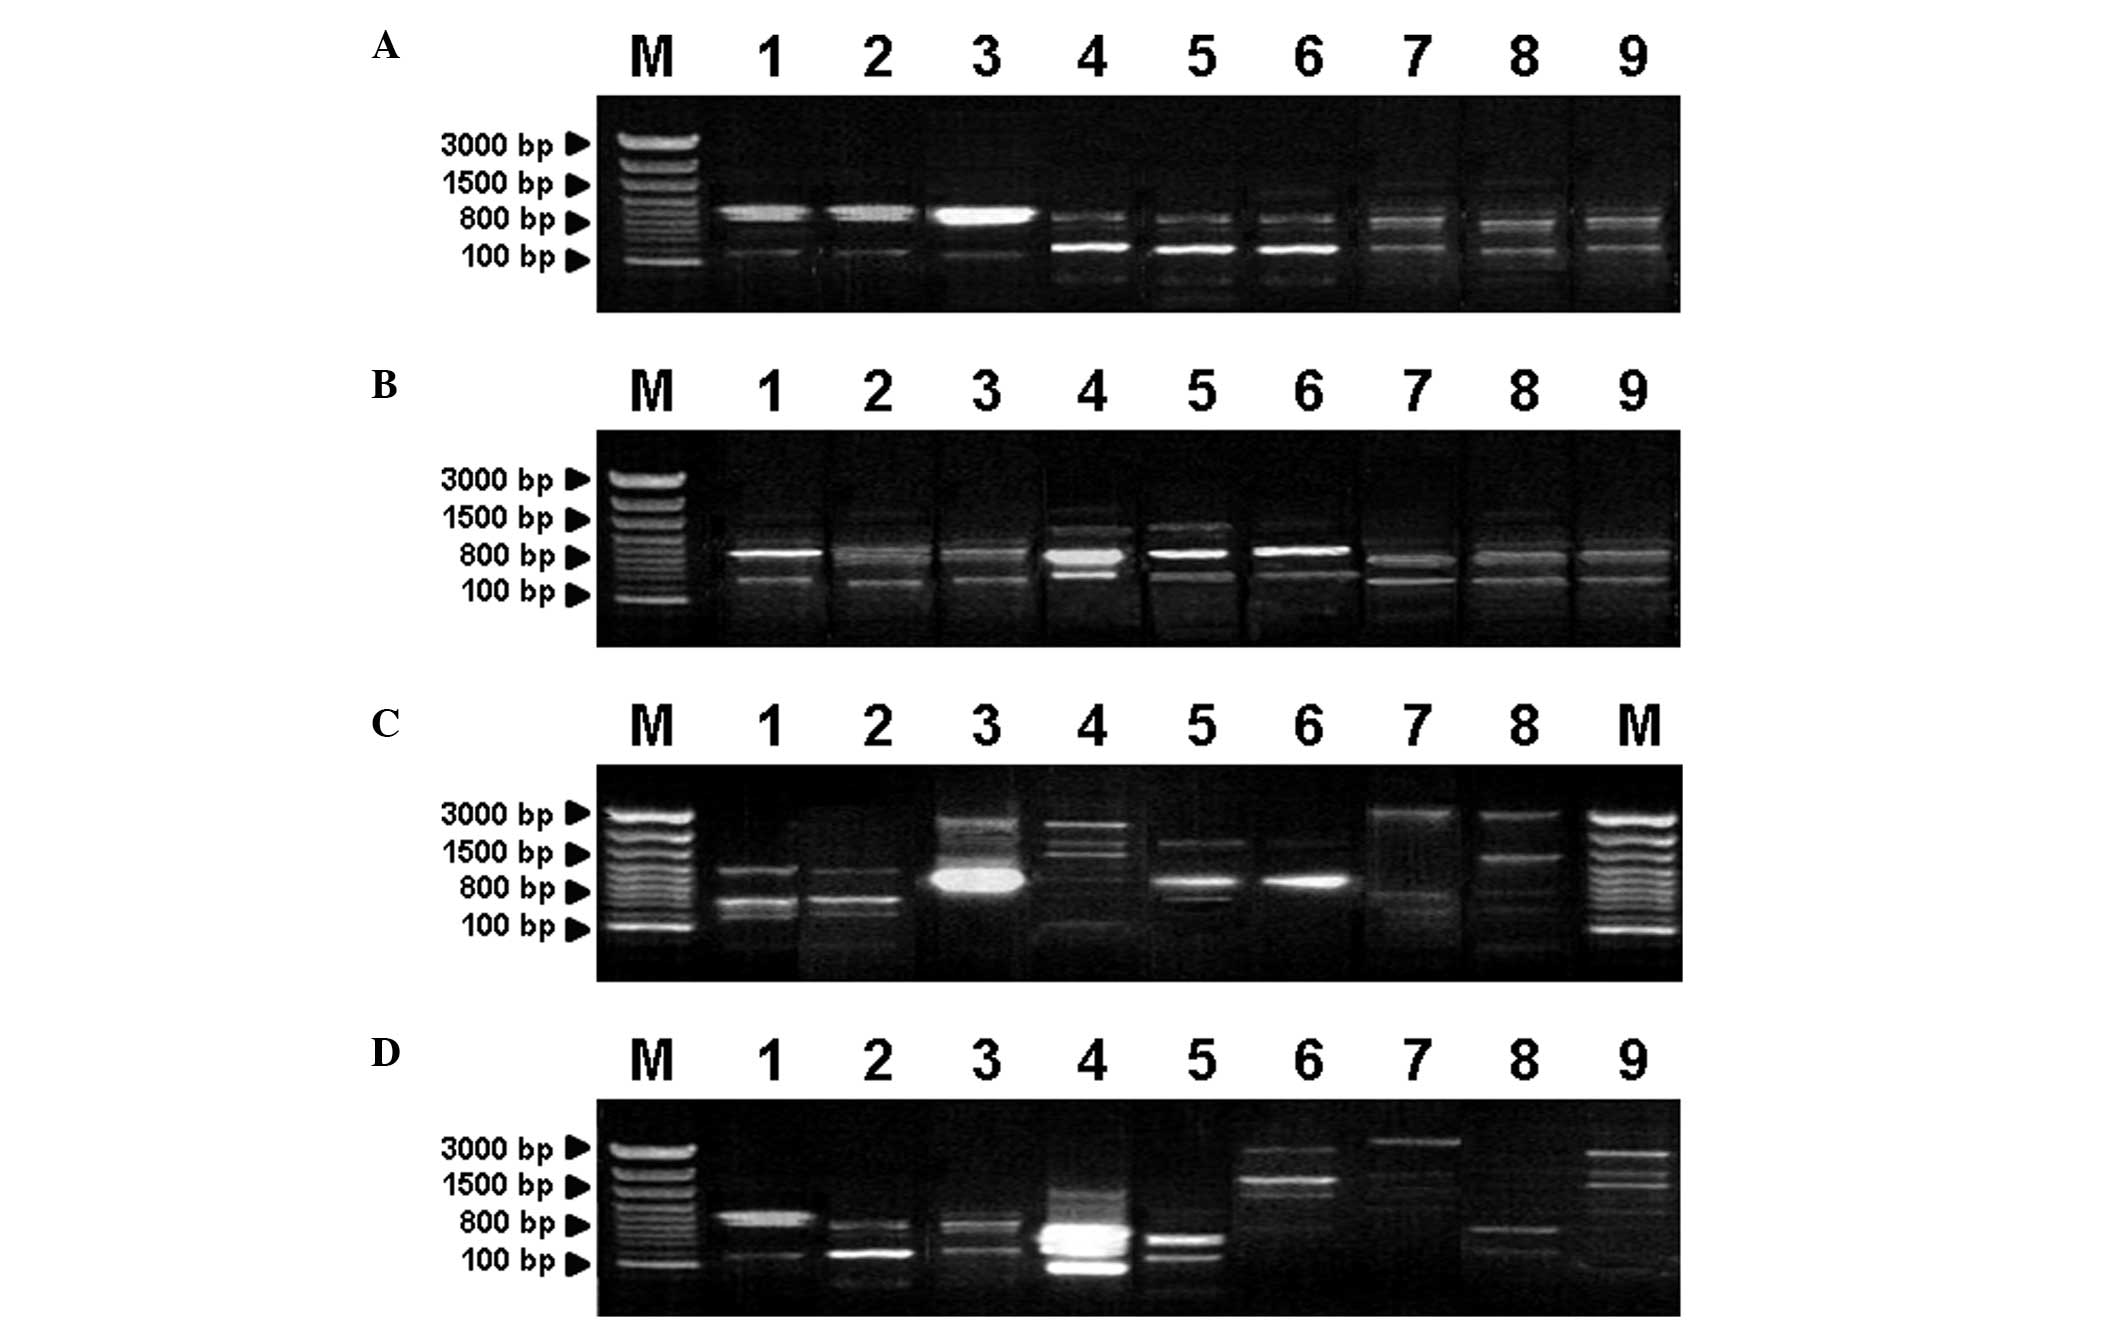 | Figure 1Identification of dermatophyte species
using (GACA)4 primer-based PCR. PCR products of various
dermatophyte isolates are shown. Lanes: M, molecular weight marker;
(A) 1–3, T. rubrum; 4–6, T. mentagrophytes; 7–9,
M. canis; (B) 1–3, M. canis; 4–6, M. gypseum;
7–9, E. floccosum; (C) 1 and 2, C. albicans; 3 and 4,
C. glabrata; 5 and 6, C. tropicalis; 7 and 8, C.
parapsilosis; (D) 1, T. rubrum; 2, T.
mentagrophytes; 3, M. canis; 4, M. gypseum; 5,
E. floccosum; 6, C. albicans; 7, C.
parapsilosis; 8, C. tropicalis; 9, C. glabrata.
PCR, polymerase chain reaction; T. rubrum, Trichophyton
rubrum; T. mentagrophytes, Trichophyton mentagrophytes; M. canis,
Microsporum canis; M. gypseum, Microsporum gypseum; E. floccosum,
Epidermophyton floccosum; C. albicans, Candida albicans; C.
glabrata, Candida glabrata; C. tropicalis; Candida tropicalis; C.
parapsilosis; Candida parapsilosis. |
Characterization of dermatophyte strains
using NTS-based PCR
To determine intraspecies variation and identify
dermatophyte isolates to the strain level, PCR amplification was
performed with NTS-1 and NTS-2 primer sets. The dermatophyte
isolates were collected from four cities in China. As shown in
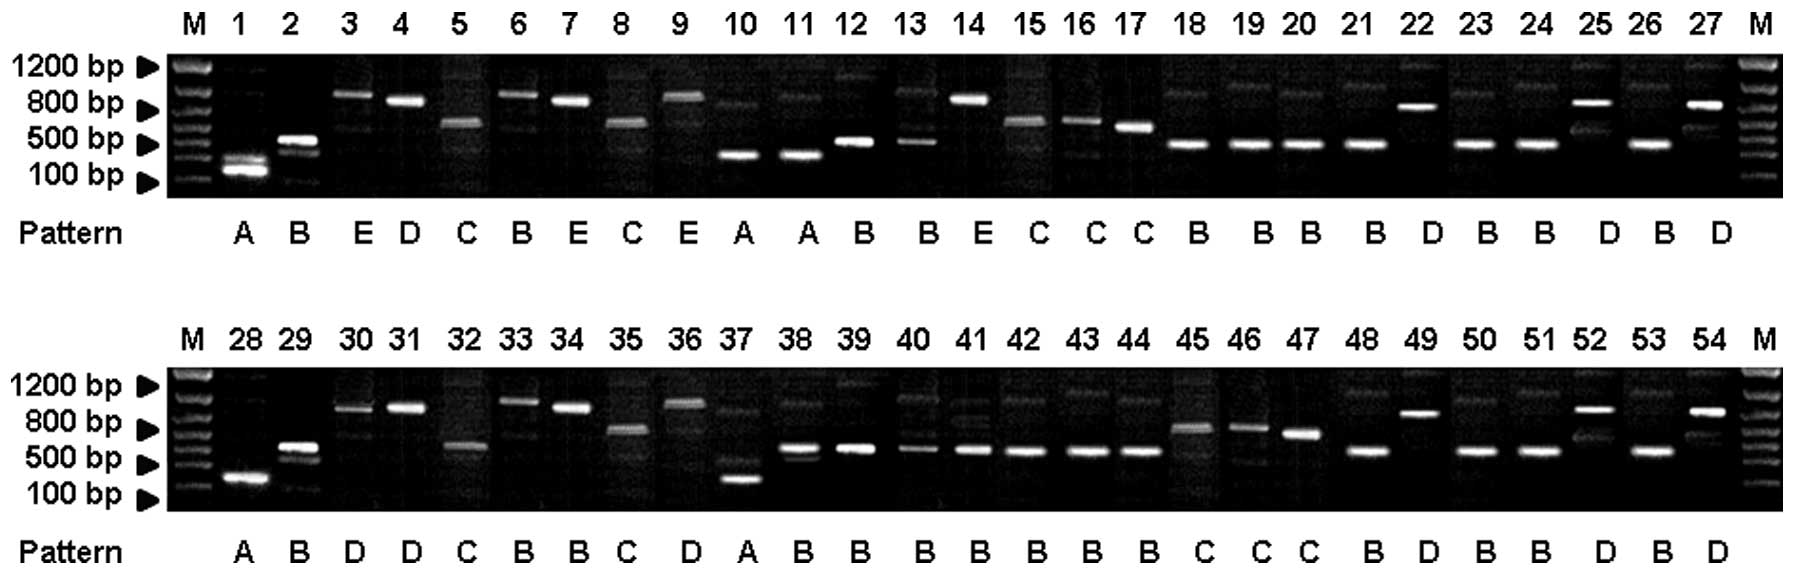
Fig. 2, the NTS-1 amplification
products from 54 T. rubrum strains were divided into five
patterns (A, B, C, D and E) with typical fragment sizes of 250,
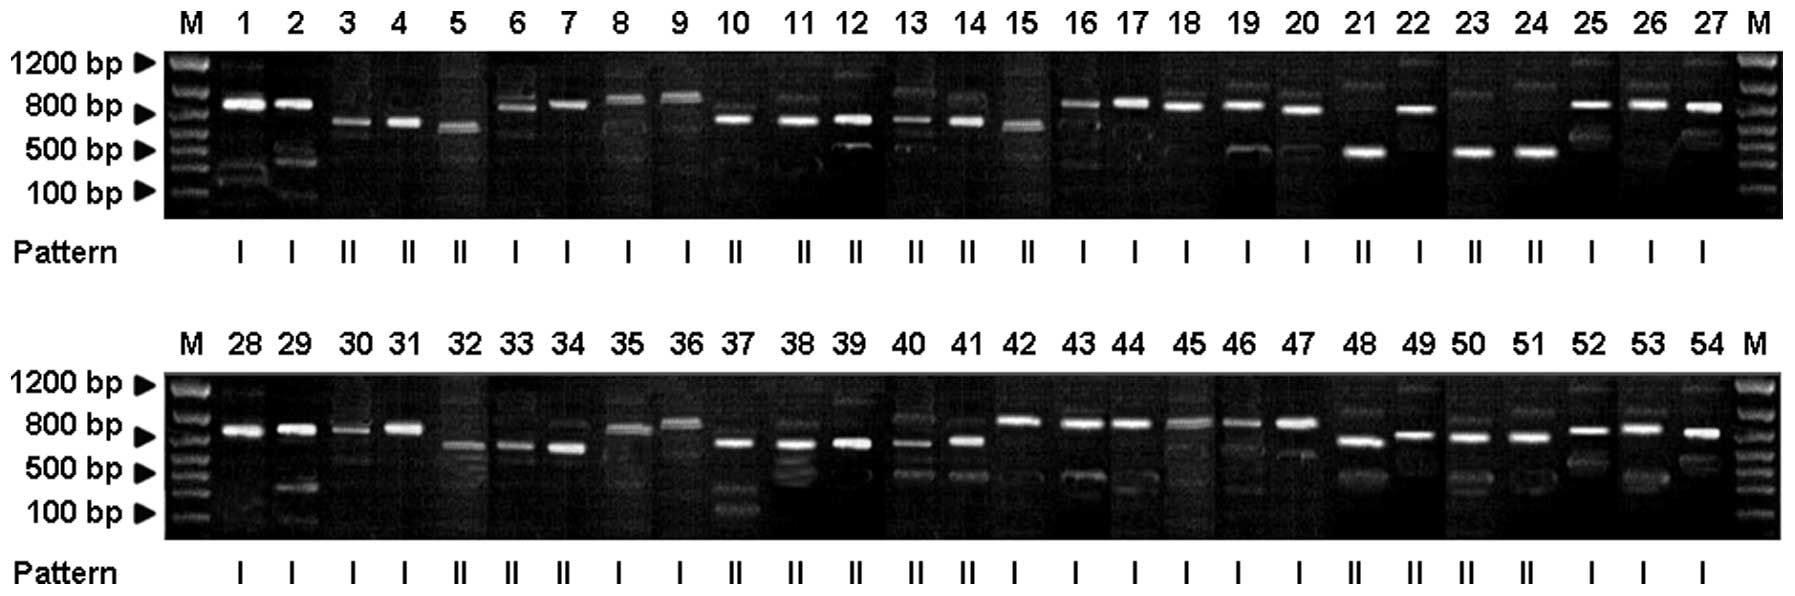
550, 750, 900 and 1,000 bp, respectively (Fig. 2). By contrast, the NTS-2
amplification products exhibited two band patterns (I and II) with
typical fragment sizes of 500 and 450 bp, respectively (Fig. 3).
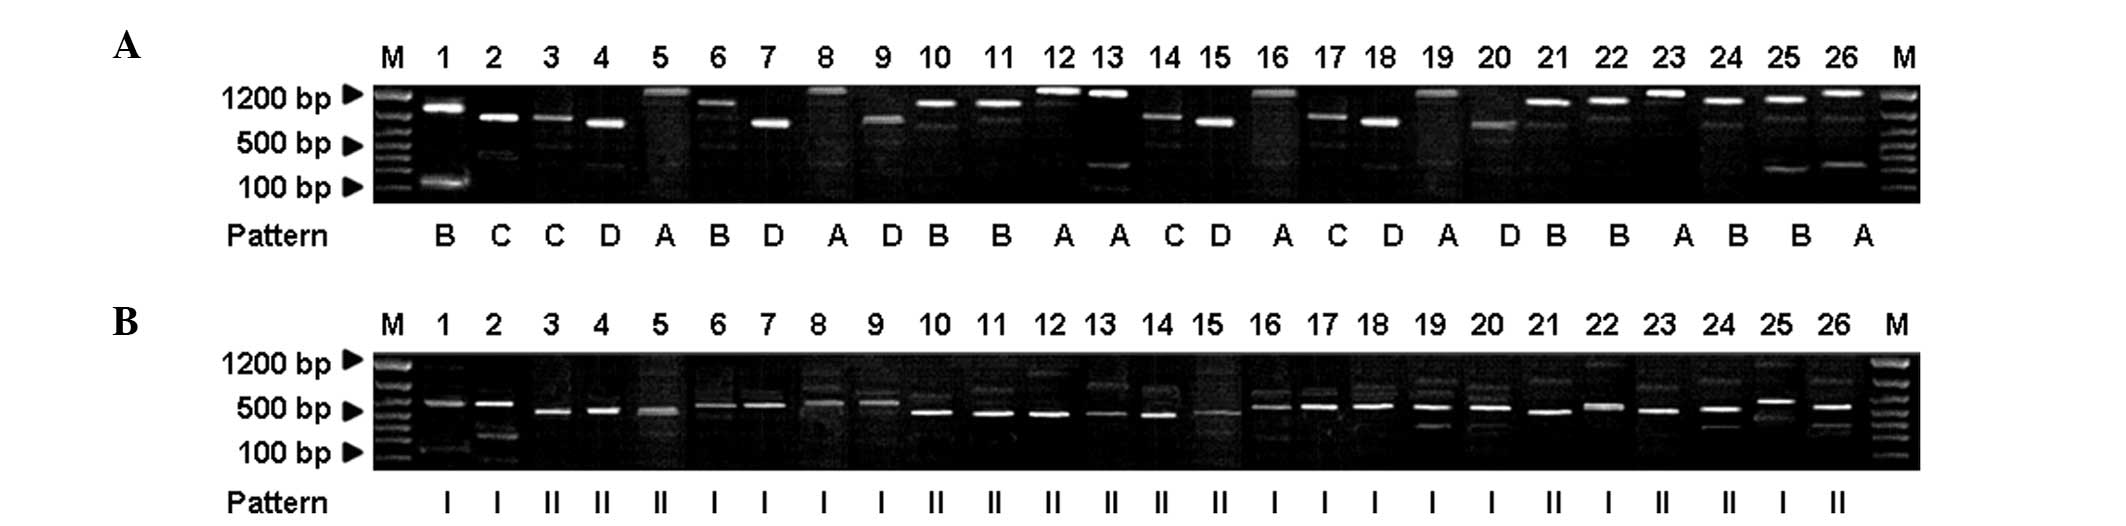
The NTS-1-based PCR amplification products from the
strains of T. mentagrophytes were divided into four patterns
(A, B, C and D) with typical fragment sizes of 850, 900, 1,100 and
1,200 bp, respectively (Fig. 4A).
In addition, the NTS-2-based PCR amplification products were
divided into two patterns (I and II) with typical fragment sizes of
800 and 650 bp, respectively (Fig.
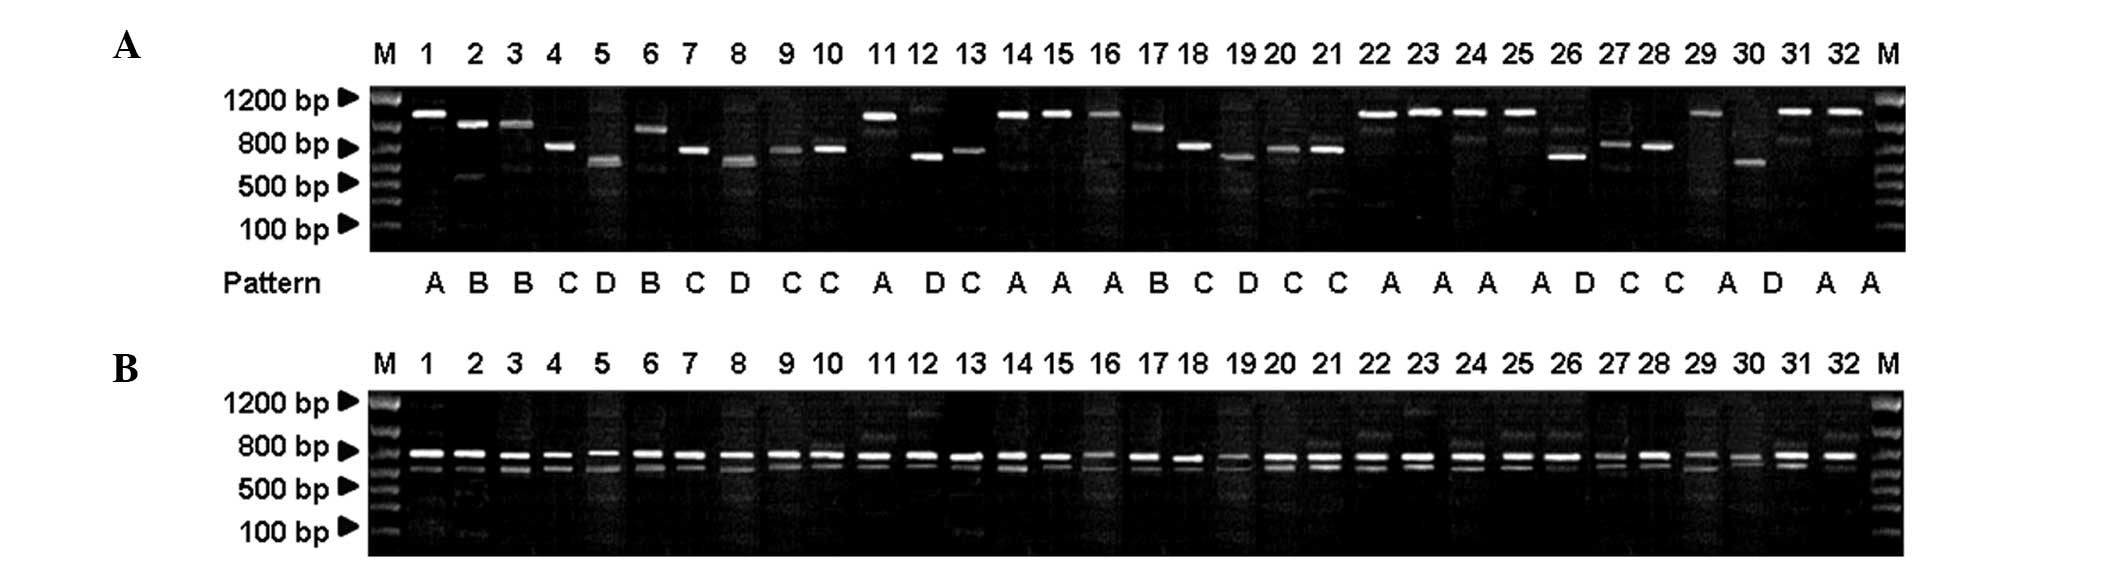
4B). For M. canis, the NTS-1 amplification products were
divided into four patterns (A, B, C and D) with typical fragment
sizes of 1,100, 1,000, 800 and 750 bp, respectively (Fig. 5A). However, the NTS-2 amplification
products for the various strains exhibited the same profile,
consisting of two clearly distinguishable bands of 800 and 650 bp
(Fig. 5B). These results indicate
that dermatophyte isolates and/or strains within the same species
exhibit various band patterns with NTS-based PCR, indicating that
this method may be a useful tool to identify dermatophytes to the
strain level.
Regional differences in the NTS-based PCR
product band patterns from the same dermatophyte species
To investigate the regional differences among
dermatophyte strains, NTS-based PCR band pattern percentages were
analyzed. Intraspecies classification of the NTS-1-based PCR
amplification band patterns of 54 T. rubrum strains is shown
in Table II. In Nanjing and Wuxi,
pattern B accounted for a relatively large proportion when compared
with the other four band patterns. By contrast, patterns D and C
were predominant in Hangzhou and Shanghai, respectively. For
NTS-2-based PCR amplification, 30 of the 54 T. rubrum
strains were classified as pattern I, accounting for 55.56%. The
remaining 24 strains were classified as pattern II, accounting for
44.44% (Fig. 3). The majority of
strains from Nanjing and Wuxi were classified as pattern I, while
strains from Hangzhou and Shanghai were primarily classified as
pattern II.
| Table IIClassification of NTS-1-based PCR
amplification band patterns for T. rubrum. |
Table II
Classification of NTS-1-based PCR
amplification band patterns for T. rubrum.
| Location | Pattern A, n (%) | Pattern B, n (%) | Pattern C, n (%) | Pattern D, n (%) | Pattern E, n (%) |
|---|
| Nanjing | 1 (5.26) | 12 (63.16) | 2 (10.53) | 2 (10.53) | 2 (10.53) |
| Wuxi | 3 (20.00) | 8 (53.33) | 1 (6.67) | 1 (6.67) | 2 (13.33) |
| Hangzhou | 1 (8.33) | 3 (25.00) | 2 (16.67) | 6 (50.00) | 0 (0.00) |
| Shanghai | 0 (0.00) | 1 (12.5) | 5 (62.50) | 1 (12.50) | 1 (12.5) |
| Total | 5 (9.26) | 24 (44.44) | 10 (18.52) | 10 (18.52) | 5 (9.26) |
For M. canis, patterns A and C of the
NTS-1-based PCR amplification product bands accounted for 37.50 and
31.25% of strains, respectively. There were no regional differences
for M. canis in patterns A and C of the NTS-1-based PCR
amplification product bands. The NTS-1 and NTS-2-based PCR
amplification band patterns of T. mentagrophytes exhibited
no statistically significant differences among the various regions,
although the incidence of pattern I strains in Wuxi and Nanjing was
slightly higher than that in the other locations. Therefore, these
results indicate that regional differences contribute to variations
in PCR product band patterns, indicating that NTS-based PCR may be
efficient in distinguishing dermatophytes to the strain level.
Discussion
At present, skin fungal classification and
identification is primarily based on the clinical symptoms and
characteristics of in vitro culture. However, this is a
time-consuming process that is not able to identify dermatophyte
strains. In addition, accuracy and precision is easily affected by
culture conditions and environmental factors. In the present study,
(GACA)4 and NTS primer-based PCR methods were applied to
identify dermatophyte isolates to a species and strain level. The
results revealed significant differences in the (GACA)4
primer-based PCR amplification band patterns among the tested 45
clinical dermatophyte isolates. Band patterns were clear with
specific distributions, rendering them distinguishable. The PCR
product band patterns of the nine species were similar to those
described by Zhu et al (5),
with an extra 1,500 bp fragment produced in amplification. However,
further experiments are required to confirm whether this difference
is attributed to the various origins of these dermatophyte
strains.
The characteristics of ITS- and NTS-based PCR
amplification patterns have been applied to study fungal species
specificities (4,8). An ITS is a relatively conserved gene
sequence involved in species specificity of dermatophytes (9). The 18, 5.8 and 25 S gene fragments of
ITS1 and ITS2 from dermatophytes can be PCR-amplified using NTS 9
and ITS 6 as primers (10). The
ITS regions of 37 T. mentagrophytes strains have been
sequenced and divided into three homology groups and intraspecies
specificity has also been analyzed. Jackson et al classified
T. rubrum into 14 types using probes designed by the
sequences of 18 S rDNA and ITS regions (11). The majority of strains fell into
four types with evident polymorphisms. However, the methods used by
Jackson et al were rather complex.
An NTS is a highly variable region; thus, its
sequence is ideal for distinguishing between species and/or
strains. Mochizuki et al divided T. rubrum into five
types, according to the RFLP analysis of NTS (12). Jackson et al also confirmed
the specificity, reproducibility and stability of NTS (11). A common method to distinguish
between the species of T. mentagrophytes and M. canis
uses ITS regions and random primers (13–16).
Jackson et al amplified the ITS regions of 17 dermatophyte
strains and digested the samples with MvaI. A total of 13
fragments were produced. One band was specifically produced in each
of the nine fungi, including M. canis, M. gypseum and
T. mentagrophytes, indicating that the MvaI digestion
reaction only partly reflects the inter- and intraspecific
specificities. Although NTS-2 has no specificity within the M.
canis species, the specificities of ITS and NTS may be used to
classify T. mentagrophytes, M. canis and T.
rubrum derived from dogs and cats. ITS and NTS have been
further demonstrated to be specific in the classification of
pathogenic fungi (17). Despite
the efficiency of DNA sequencing in fungal species classification,
the complexity and high cost limits its application. RFLP analysis
of ITS and NTS in rDNA is simple and the results are stable
(18). This procedure is easily
and widely applicable to the identification of fungal species and
is important for the study of fungal epidemiology.
The results of the present study indicate that
regional differences contribute to variations in PCR product bands
of dermatophyte strains, and possess the potential to distinguish
dermatophytes to the strain level. However, for T. rubrum,
the pattern distribution in the current study was not consistent
with the six-type classification by Fan et al (19) and the 14-type classification by
Jackson et al (21). This
discrepancy may be associated with sample insufficiency and the
limited sampling regions. Furthermore, the NTS-based PCR
amplification product band patterns of T. mentagrophytes and
M. canis did not exhibit differences among regions as
clearly as those in T. rubrum. Therefore, more samples are
required to verify whether significant regional differences exist
in the NTS-based PCR amplification product band patterns of these
dermatophyte species.
In conclusion, using (GACA)4 and NTS as
primers, PCR was accurately, conveniently and efficiently performed
to clarify dermatophyte isolates to a species and strain level. The
present study provides information concerning the identification of
pathogenic fungi and the epidemiological characteristics of fungal
skin diseases.
References
|
1
|
Moretti A, Agnetti F, Mancianti F, et al:
Dermatophytosis in animals: epidemiological, clinical and zoonotic
aspects. G Ital Dermatol Venereol. 148:563–572. 2013.PubMed/NCBI
|
|
2
|
Gaedigk A, Gaedigk R and Abdel-Rahman SM:
Genetic heterogeneity in the rRNA gene locus of Trichophyton
tonsurans. J Clin Microbiol. 41:5478–5487. 2003. View Article : Google Scholar : PubMed/NCBI
|
|
3
|
Kac G: Molecular approaches to the study
of dermatophytes. Med Mycol. 38:329–336. 2000. View Article : Google Scholar : PubMed/NCBI
|
|
4
|
Shehata AS, Mukherjee PK, Aboulatta HN, et
al: Single-step PCR using (GACA)4 primer: utility for
rapid identification of dermatophyte species and strains. J Clin
Microbiol. 46:2641–2645. 2008.PubMed/NCBI
|
|
5
|
Zhu H, Wen H and Liao W: Identification of
Trichophyton rubrum by PCR fingerprinting. Chin Med J
(Engl). 115:1218–1220. 2002.
|
|
6
|
Orsini M and Romano-Spica V: A
microwave-based method for nucleic acid isolation from
environmental samples. Lett Appl Microbiol. 33:17–20. 2001.
View Article : Google Scholar : PubMed/NCBI
|
|
7
|
Cassago A, Panepucci R, Baião A and
Henrique-Silva F: Cellophane based mini-prep method for DNA
extraction from the filamentous fungus Trichoderma reesei.
BMC Microbiol. 2:142002. View Article : Google Scholar : PubMed/NCBI
|
|
8
|
Kac G, Bougnoux ME, Feuilhade De Chauvin
M, Sene S and Derouin F: Genetic diversity among Trichophyton
mentagrophytes isolates using random amplified polymorphic DNA
method. Br J Dermatol. 140:839–844. 1999.
|
|
9
|
Summerbell RC, Haugland RA, Li A and Gupta
AK: rRNA gene internal transcribed spacer 1 and 2 sequences of
asexual, anthropophilic dermatophytes related to Trichophyton
rubrum. J Clin Microbiol. 37:4005–4011. 1999.PubMed/NCBI
|
|
10
|
Makimura K, Mochizuki T, Hasegawa A, et
al: Phylogenetic classification of Trichophyton
mentagrophytes complex strains based on DNA sequences of
nuclear ribosomal internal transcribed spacer 1 regions. J Clin
Microbiol. 36:2629–2633. 1998.
|
|
11
|
Apodaca G and McKerrow JH: Regulation of
Trichophyton rubrum proteolytic activity. Infect Immun.
57:3081–3090. 1989.PubMed/NCBI
|
|
12
|
Jackson CJ, Barton RC, Kelly SL and Evans
EG: Strain identification of Trichophyton rubrum by specific
amplification of subrepeat elements in the ribosomal DNA
nontranscribed spacer. J Clin Microbiol. 38:4527–4534. 2000.
|
|
13
|
Mochizuki T, Kawasaki M, Ishizaki H, et
al: Molecular epidemiology of Arthroderma benhamiae, an
emerging pathogen of dermatophytoses in Japan, by polymorphisms of
the non-transcribed spacer region of the ribosomal DNA. J Dermatol
Sci. 27:14–20. 2001.
|
|
14
|
Zhu HM, Liao WQ and Dai JX: PCR
fingerprint analysis of Trichophyton rubrum and
Trichophyton mentagrophytes. Chin J Dermatol. 33:3492000.(In
Chinese).
|
|
15
|
Shin JH, Sung JH, Park SJ, et al: Species
identification and strain differentiation of dermatophyte fungi
using polymerase chain reaction amplification and restriction
enzyme analysis. J Am Acad Dermatol. 48:857–865. 2003. View Article : Google Scholar
|
|
16
|
Li Q, Liu WD, Yang GL and Li CJ: DNA
typing of Trichophyton rubrum. Chin J Dermatol. 35:352–354.
2002.(In Chinese).
|
|
17
|
Jackson CJ, Mochizuki T and Barton RC: PCR
fingerprinting of Trichophyton mentagrophytes var.
interdigitale using polymorphic subrepeat loci in the rDNA
nontranscribed spacer. J Med Microbiol. 55:1349–1355. 2006.
|
|
18
|
Takeda K, Nishibu A, Anzawa K and
Mochizuki T: Molecular epidemiology of a major subgroup of
Arthroderma benhamiae isolated in Japan by restriction
fragment length polymorphism analysis of the non-transcribed spacer
region of ribosomal RNA gene. Jpn J Infect Dis. 65:233–239.
2012.PubMed/NCBI
|
|
19
|
Fan JF, Li HJ, Suo JJ, Li RY and Wan Z:
Strain typing in Trichophyton rubrum. Academic Journal of Chinese
Pla Medical School. 25:225–226. 2004.(In Chinese).
|
|
20
|
Nishio K, Kawasaki M and Ishizaki H:
Phylogeny of the genera Trichophyton using mitochondrial DNA
analysis. Mycopathologia. 117:127–132. 1992.
|
|
21
|
Jackson CJ, Barton RC and Evans EG:
Species identification and strain differentiation of dermatophyte
fungi by analysis of ribosomal-DNA intergenic spacer regions. J
Clin Microbiol. 37:931–936. 1999.PubMed/NCBI
|