Introduction
Patients with thalassemia require long-term blood
transfusions, thus, are often subject to iron accumulation and
subsequent organ fibrosis (1). The
effect of iron accumulation varies with the specific organ affected
(2), and accumulation in the heart
and liver is associated with significant clinical consequences
(1,3). Knowledge of the degree of iron
accumulation at an early stage allows for treatment planning, which
may delay the progression of the condition (4). Typically, a definitive diagnosis of
iron accumulation requires a biopsy, which is associated with the
risks of an invasive procedure, including bleeding and infection.
Thus, noninvasive diagnostic methods for determining the degree of
iron accumulation have become a key area of research.
Magnetic resonance imaging (MRI) has been
demonstrated to be useful for the evaluation of cardiac and hepatic
iron accumulation (5).
Cardiovascular MRI can provide data on cardiac muscle function,
while the T2* value obtained from multi-echo gradient
recalled echo techniques indicates the degree of iron accumulation
(6–8). However, despite MRI being a
noninvasive test, it also has limitations. Cardiovascular and liver
imaging examinations require the examinee to hold their breath to
ensure a better image quality and a more accurate T2*
value. As a result, high quality images and results are difficult
to obtain for certain patients, including young children and others
who have difficulty holding their breath.
Research into dual-energy computed tomography (DECT)
began as early as 1977, and the technology has been applied to
liver hemochromatosis since the 1980s (9). Beginning in 1991, DECT has been used
for the diagnosis of hepatic diseases (10). With continued advances in the
technology, DECT has been applied for imaging of abdominal organs,
the musculoskeletal and vascular systems, as well as for specific
conditions, such as lithiasis and calcifications (11–14).
The use of DECT in the assessment of iron accumulation in
thalassemia patients was initially investigated in 1988 (15). Previous studies have indicated a
correlation between DECT and MRI data used to detect iron
accumulation in various organs (8,9).
In the present study, phantoms containing minced pig
heart or liver and varying iron concentrations were examined with
DECT and MRI. The aim of the study was to determine the correlation
between CT Hounsfield units (HU) and iron concentration, as well as
the correlation between HU and MRI-derived R2*
values.
Materials and methods
General information
The primary aim of the study was to mimic the heart
and liver, the organs most often subject to transfusion-induced
iron accumulation in thalassemia patients, and to use DECT to
accurately access the quantity of accumulated iron. Therefore,
fresh pig heart and liver specimens were obtained from a local
slaughterhouse and specimens similar in size were selected for the
study to emulate the internal environment of the human body. The
models and methods used in the study have been validated in a
number of previous studies (6–8). The
study was approved by the Instititional Review Board of the
National Cheng Kung University Hospital.
Phantoms
Prior to preparing the phantoms, iron solution [50
mg/ml iron (III)-hydroxide polymaltose complex; Vifor
(International), Ltd., St Gallen, Switzerland] was mixed with 0.9%
NaCl solution (Sigma-Aldrich, St. Louis, MO, USA) to further
prepare the solutions of the desired concentrations (0.1, 5, 10,
15, 20 and 25 mg/ml).
Iron solutions of various concentrations were added
to test tubes that had been prefilled with minced pig heart or
minced pig liver to prepare mud-like phantoms. One part iron
solution was mixed with nine parts minced liver tissues or minced
heart tissue (volume/volume) to achieve the final phantoms. In
total, 34 four iron diluted solutions with minced heart or minced
liver, plus one background tube with only normal saline, were
prepared as sub-groups of the phantoms, and all were sealed to
prevent oxidation. Next, four trays were prepared; two with normal
saline, one with minced pig liver and one with minced pig heart.
The test tubes containing minced pig liver and heart with varying
concentrations of iron were then placed in the trays. Tubes with
varying concentrations of iron and minced pig liver were placed in
a normal saline tray and the tray containing minced pig liver, and
tubes with varying concentrations of iron and minced pig heart were
placed in a normal saline tray and the tray containing minced pig
heart. Each corresponding tray had 35 test tubes as aforementioned.
Every four trays were assigned as a set.
Each of the phantoms, including 10 sets (40 trays),
were then examined with MRI and DECT. Three radiologists (A, B and
C) separately performed the scanning of 10 sets of phantoms each
for 10 times. The intra- and inter-observer reliability
coefficients were determined. Generally, CT or MR values are
determined by one time measurement. However, due to the
signal-to-noise association, greater variation of the measurements
is likely to occur at different signal intensities. For example, in
CT imaging the signal-to-noise ratio is higher at 80 kVp than at
140 kVp; thus, greater variation in measurements occurs at 80 kVp.
Determination of intra-class reliability was required for this
reason, while the determination of inter-class reliability was
necessary to examine the variation caused by different
operators.
MRI and DECT
Grade-echo MRI was performed on the phantoms with a
Philips Achieva 1.5T A series MRI system (Philips Medical Systems,
Andover, MA, USA) with the following settings: Coil, XL Torso (8
channels); parameters, fast field echo; repetition time, shortest;
echo time, 2.3 (echospacing 2.3) with a total of eight echos; and
flip angle, 20. The T2* value was obtained, from which
the R2* value was calculated (R2* =
1,000/T2*).
Single-energy computed tomography (SECT) imaging was
performed with a Siemens SOMATOM Definition Flash system (Siemens
Healthcare, Malvern, PA, USA) using the following settings:
Voltage, 120 kVp; and tube current time, 200 mAseff. DECT with a
tin filter was performed with the following settings: Pair voltage,
80/140 kVp; tube current time, 333×142 mAseff; computed tomography
dose index (CTDI)vol, 13.2 mGy; pair two voltage,
100/140 kVp; tube current time, 333×283 mAseff; and
CTDIvol, 27.1 mGy. Data were obtained at 80 and 140 kVp
and the ΔH80–140 was calculated as the difference
between the values at 80 and 140 kVp. Similarly, data were obtained
at 100 and 140 kVp and the ΔH100–140 was calculated as
the difference between the values at 100 and 140 kVp.
Statistical analysis
Intra- and inter-class reliability were presented as
the intra-class correlation coefficient (ICC) and κ values for the
R2* MRI measurement, respectively. The ICC value was
defined as follows: >0.75, excellent; 0.59–0.75, good;
0.40–0.58, fair; and ≤40, poor (16), while the κ value was defined as
follows: ≤0, poor; 0.01–0.20, slight; 0.21–0.40, fair; 0.41–0.60,
moderate; 0.61–0.80, substantial; and 0.81–1, almost perfect
(17). Higher ICC and κ values
indicated greater reliability and less variation between the
measurements. DECT and MRI R2* data are represented as
the mean ± standard deviation. Differences between conditions
(normal saline and liver or heart) were compared using the
two-sample t-test. A simple linear regression line was applied to
identify the associations between DECT and MRI measurements with
iron concentrations. Scatter plots with a predicted regression line
were constructed comparing the HU measurements and iron
concentration. Predicted regression lines were represented as y =
b1x + b0, and corresponding R2
values were calculated. All the statistical assessments were
two-tailed, and a value of P<0.05 was considered to indicate a
statistically significant difference. Statistical analyses were
performed using SPSS 18.0 statistical software (SPSS, Inc.,
Chicago, IL, USA).
Results
Intra- and inter-observer reliability of
MRI
MRI R2* data were used for determining
the intra- and inter-observer reliability. For the heart phantom,
the intra-observer reliability (ICC) was 0.986 for physician A,
0.981 for physician B and 0.98 for physician C. The inter-observer
reliability coefficient (κ) was 0.918 between physician A and B,
0.928 between physician A and C and 0.923 between physician B and
C. For the liver phantom, the intra-observer reliability (ICC) was
0.982 for physician A, 0.985 for physician B and 0.984 for
physician C. The inter-observer reliability coefficient (κ) was
0.886 between physician A and B, 0.882 between physician A and C
and 0.889 between physician B and C (data not shown). These results
indicate that the intra- and inter-class reliability values were
high.
DECT and MRI R2*
measurements
Table I summarizes
an representation of the DECT and MRI R2* measurements
for each of the four groups (liver and heart phantoms in normal
saline and liver and heart phantoms in liver and heart,
respectively), which were the average values from pooling the
readings of the 34 tubes of each corresponding phantom group. The
DECT and MRI measurements were consistent between the normal saline
and minced heart and liver trays.
 | Table IA representation of DECT and MRI
R2* measurements. |
Table I
A representation of DECT and MRI
R2* measurements.
| Heart | Liver |
|---|
|
|
|
|---|
| Group | Normal saline | Minced heart | Normal saline | Minced liver |
|---|
| DECT, HU |
| 80 kVp | 71.20±44.15 | 71.44±44.36 | 55.63±35.93 | 56.61±35.9 |
| 140 kVp | 53.73±21.22 | 54.74±21.09 | 39.7±17.38 | 41.62±17.38 |
|
ΔH80–140 | 17.67±23.36 | 16.90±23.71 | 16.11±18.88 | 15.16±18.85 |
| DECT, HU |
| 100 kVp | 64.74±35.71 | 65.03±34.61 | 50.29±29.43 | 51.3±28.66 |
| 140 kVp | 53.26±20.72 | 54.44±20.67 | 40.08±17.97 | 41.74±17.41 |
|
ΔH100–140 | 11.68±5.35 | 10.80±14.31 | 10.38±11.80 | 9.73±11.55 |
| MRI, msec |
| R2* | 114.82±121.60 | 127.35±136.95 | 156.63±92.39 | 137.36±83.91 |
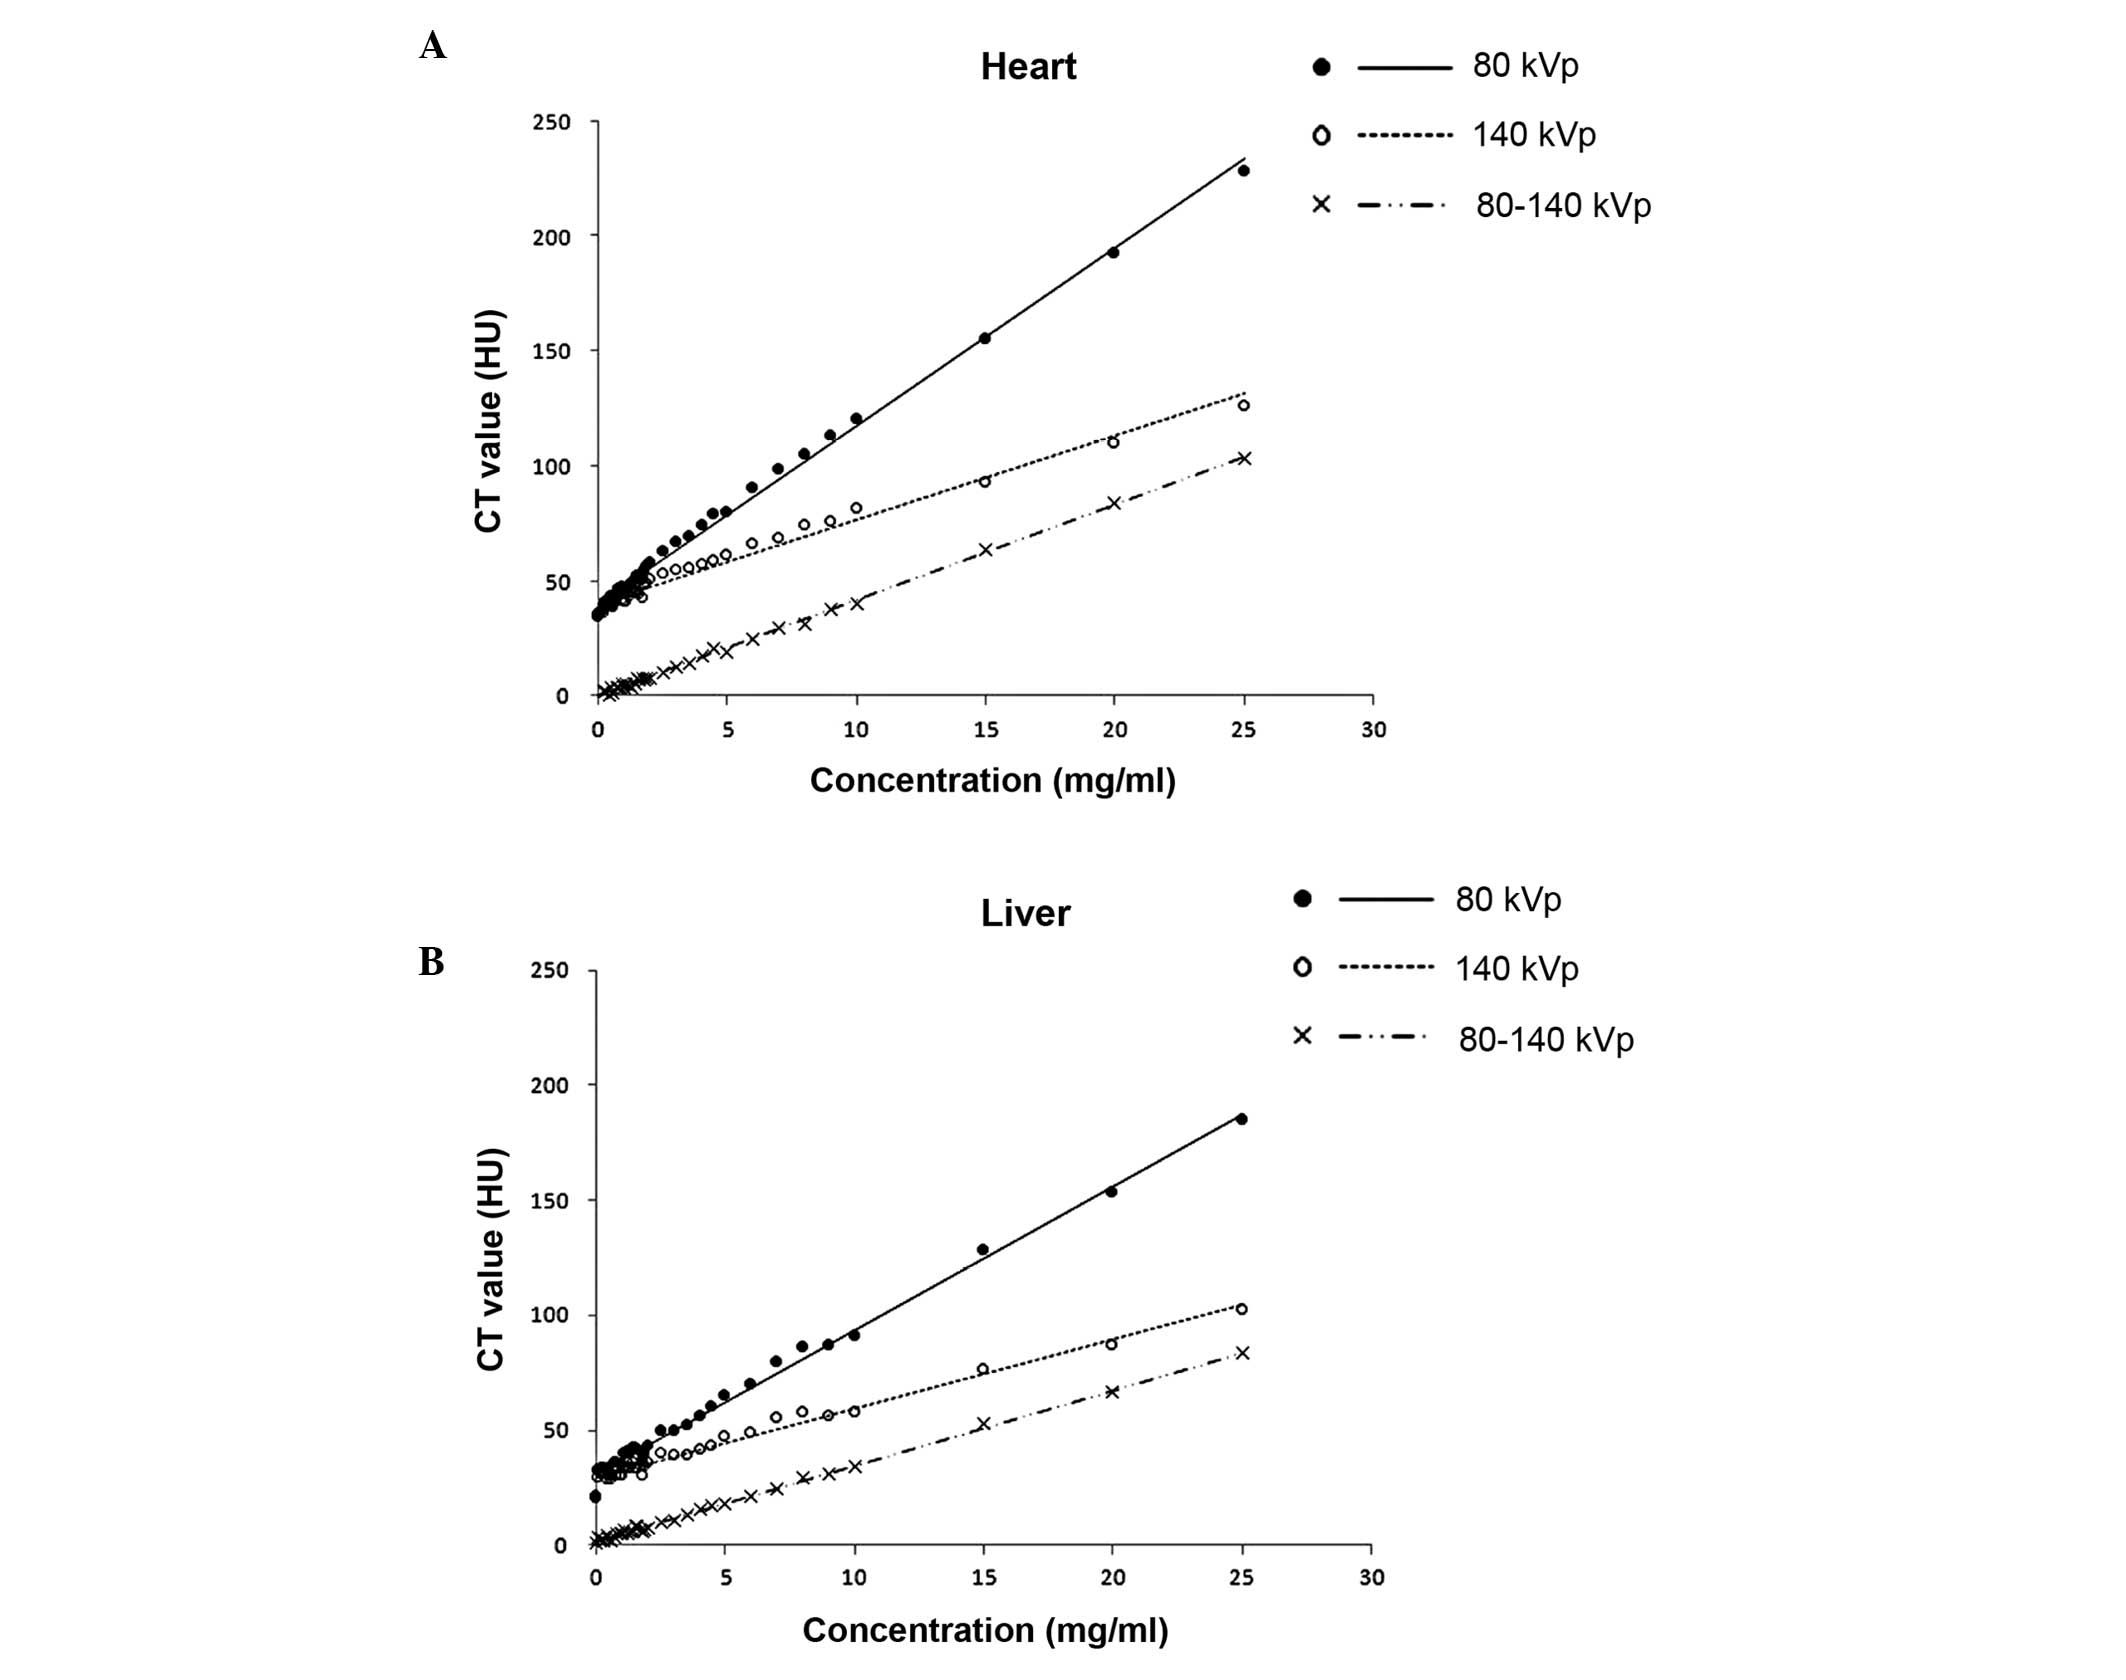
Fig. 1 shows the
DECT 80 and 140 kVp data compared with the iron concentrations for
the heart and liver phantoms. In the heart, an increase in 1 mg/ml
iron corresponded to an increase in CT HU values of 7.751 for DECT
80 kVp, 3.654 for 140 kVp and 4.066 for ΔH80–140. In the
liver, an increase of 1 mg/ml iron corresponded to an increase in
CT HU values of 6.265 for DECT 80 kVp, 3.010 for 140 kVp and 3.296
for ΔH80–140.
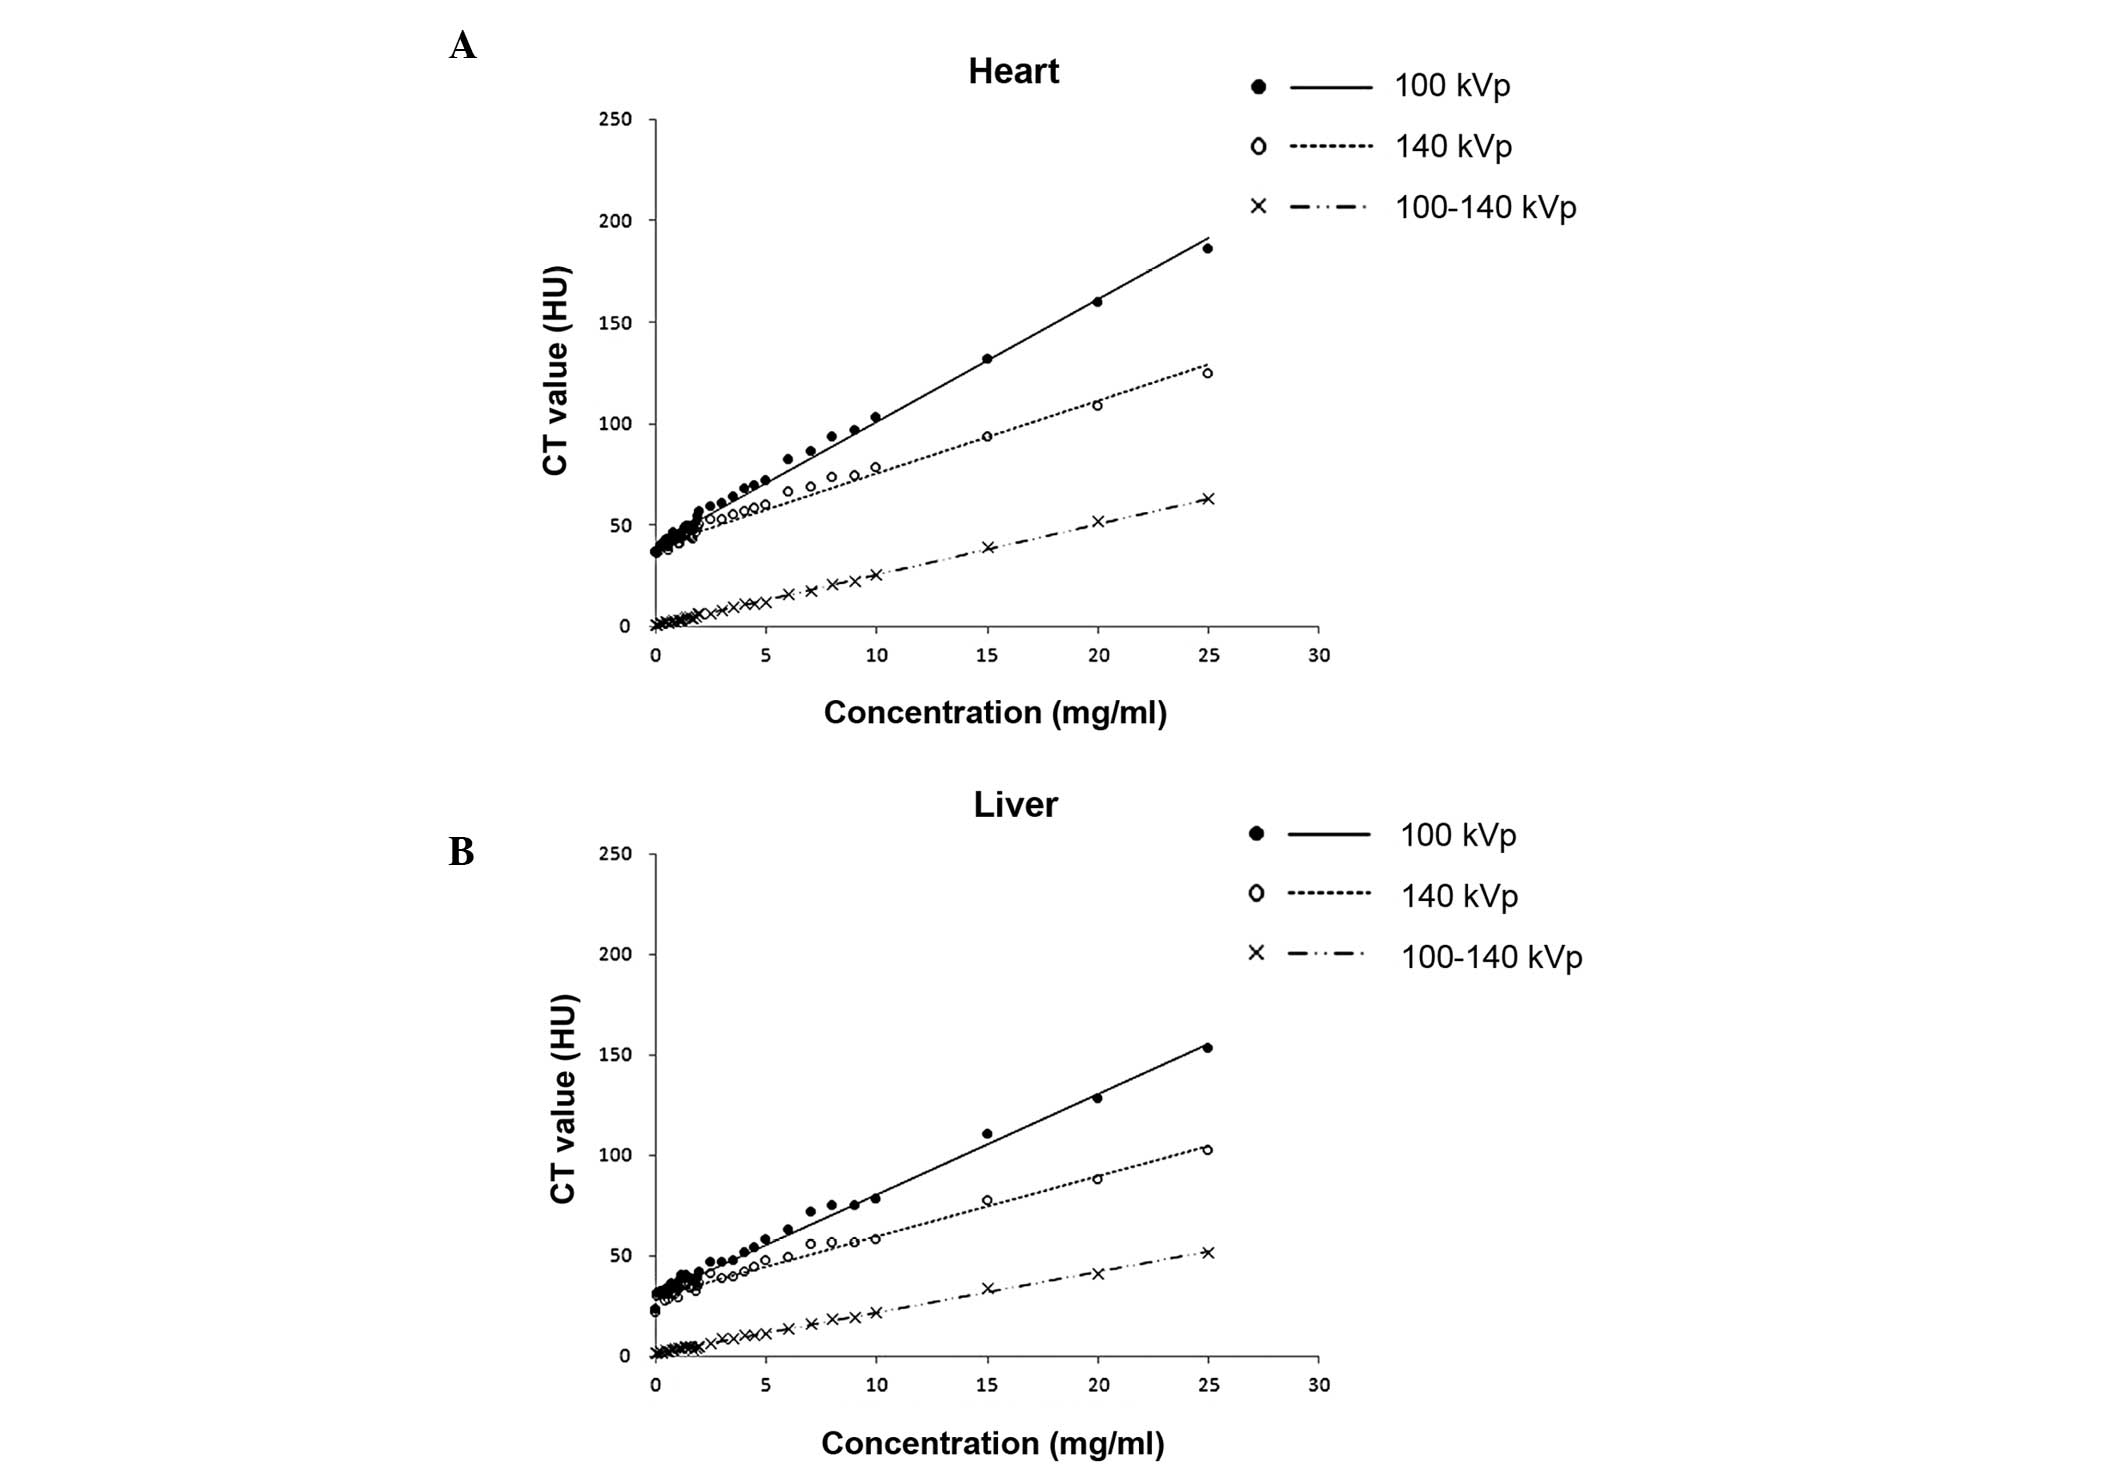
Fig. 2 shows the
DECT 100 and 140 kVp data compared with the iron concentrations for
the heart and liver phantoms. In the heart, an increase of 1 mg/ml
iron corresponded to an increase in CT HU values of 6.04 for DECT
100 kVp, 3.586 for 140 kVp and 2.505 for ΔH100–140. In
the liver, an increase of 1 mg/ml iron corresponded to an increase
in CT HU values of 4.996 for DECT 100 kVp, 3.018 for 140 kVp and
2.020 for ΔH100–140.
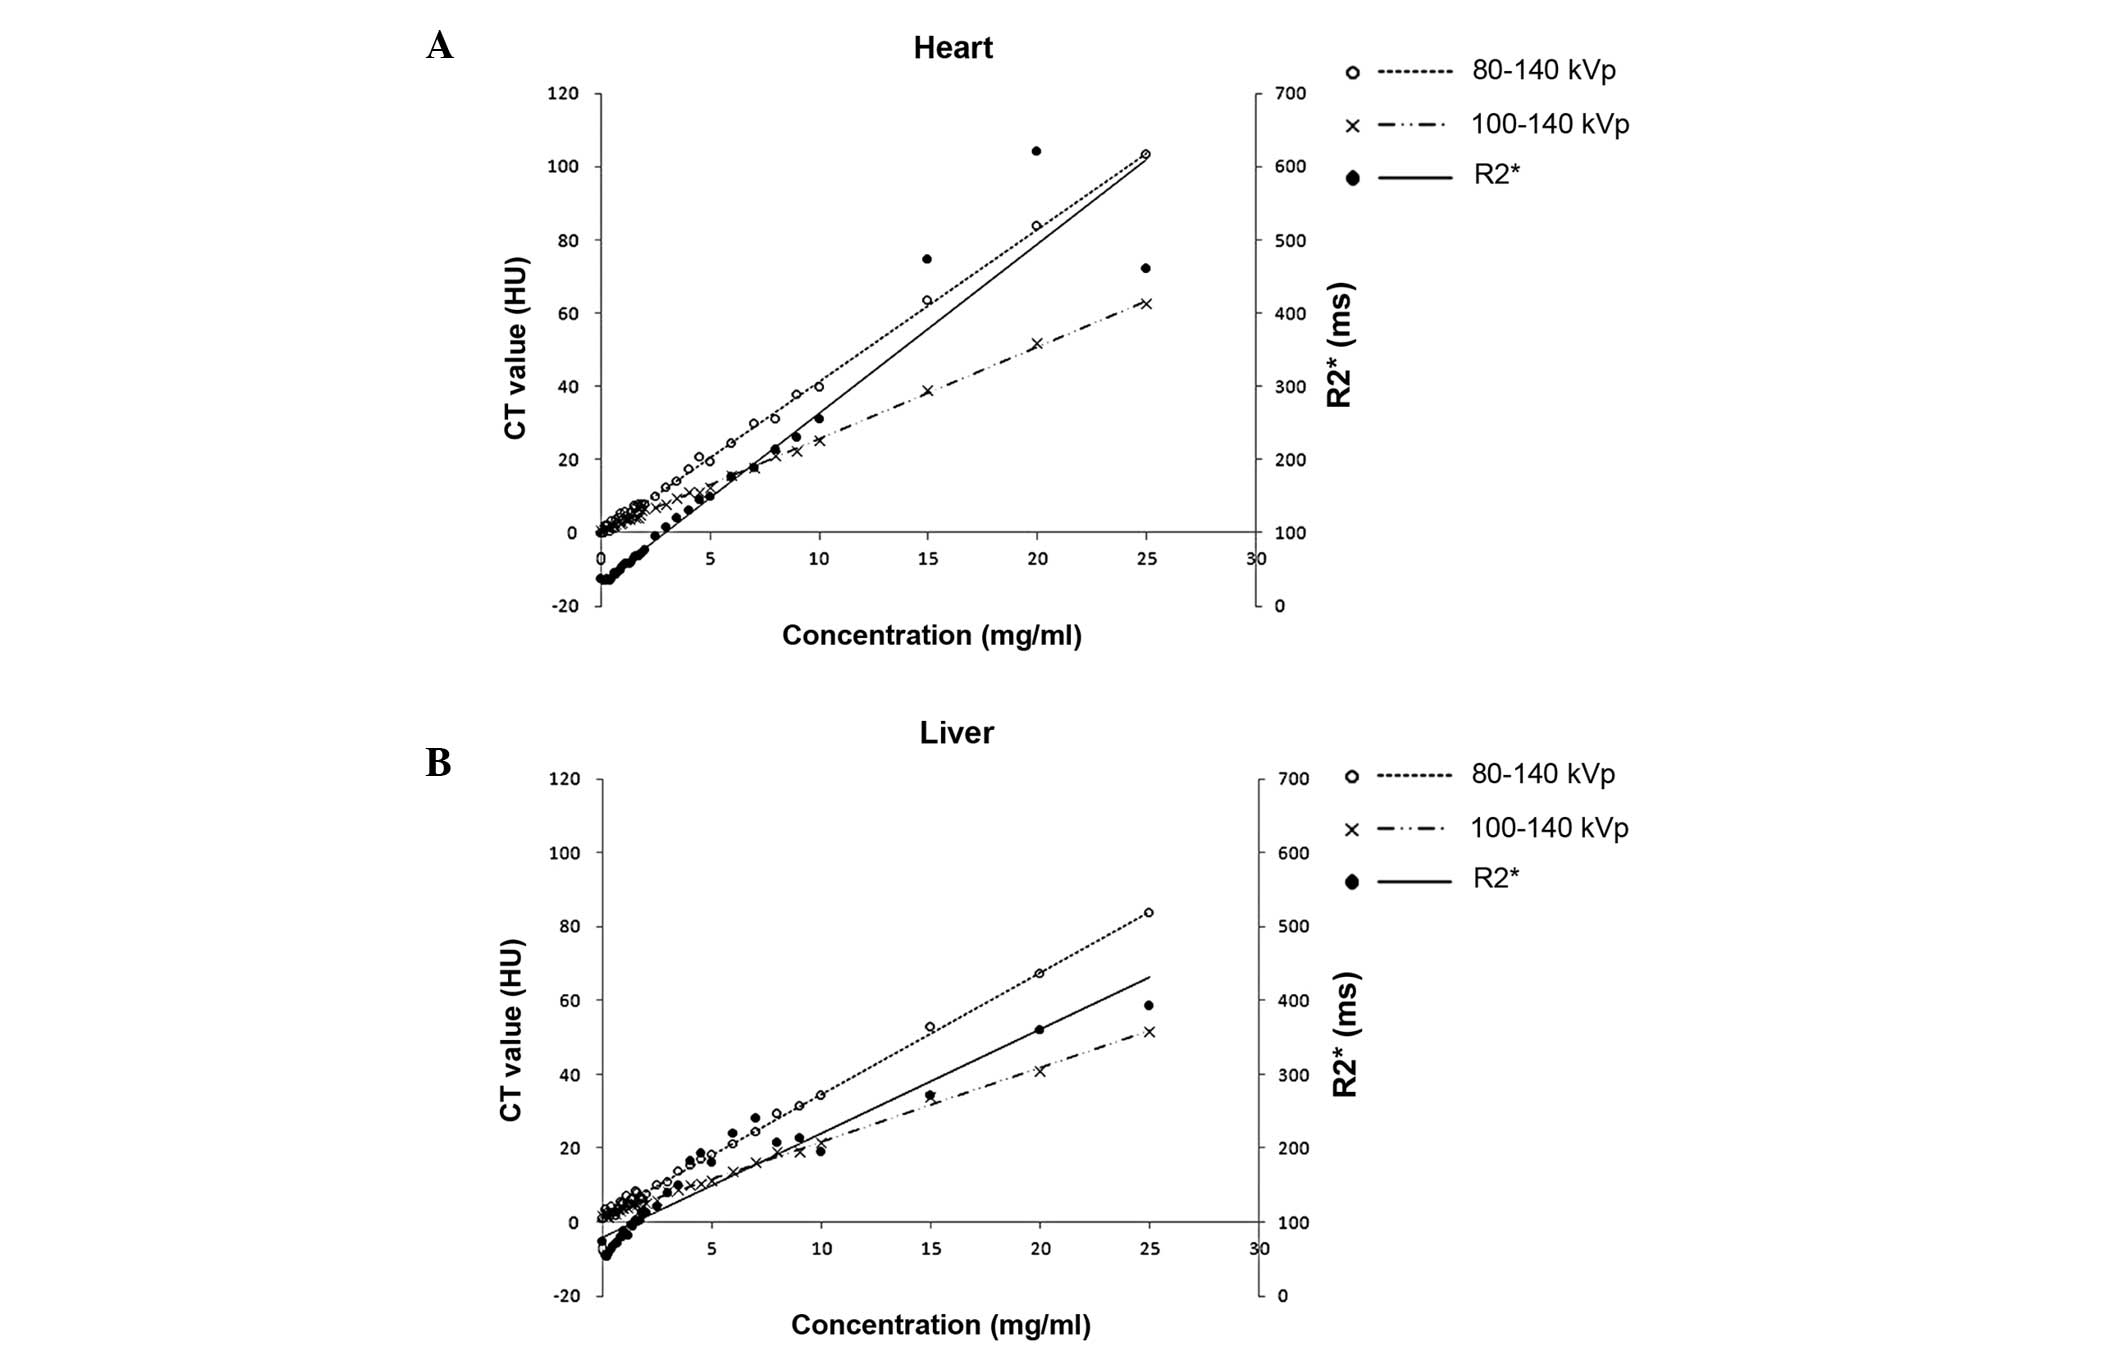
Scatter plots with predicted regression lines of
DECT 80–140 kVp, DECT 100–140 kVp and MRI R2* compared
with iron concentrations are shown in Fig. 3. In the heart, an increase of 1
mg/ml iron corresponded to an increase in CT HU values of 4.147 for
DECT 80–140 kVp and 2.505 for DECT 100–140 kVp, with the
corresponding increase of 23.072 in the MRI R2* value.
In the liver phantoms, an increase of 1 mg/ml iron corresponded to
an increase in CT HU values of 3.306 for DECT 80–140 kVp and 2.020
for DECT 100–140 kVp, with the corresponding increase of 14.04 in
the MRI R2* value.
Table II
summarizes the predicted regression lines and corresponding
R2 values for the associations between DECT and MRI
measurements with iron concentrations. The derived R2
values were all >0.9, indicating that DECT and MRI measurements
were significantly correlated in all the models.
| Table IIPredicted regression lines and
corresponding R2 values were used to identify the
association between DECT and MRI measurements with iron
concentrations. |
Table II
Predicted regression lines and
corresponding R2 values were used to identify the
association between DECT and MRI measurements with iron
concentrations.
| Heart | Liver |
|---|
|
|
|
|---|
| Group | Predicted
regression line | R2 | Predicted
regression line | R2 |
|---|
| DECT, HU |
| 80 kVp | y = 7.75x +
39.6 | 0.996 | y = 6.275x +
30.92 | 0.993 |
| 140 kVp | y = 3.65x +
39.76 | 0.980 | y = 3.01x +
29.27 | 0.979 |
|
ΔH80–140 | y = 4.15x −
0.10 | 0.998 | y = 3.31x +
1.66 | 0.998 |
| DECT, HU |
| 100 kVp | y = 6.04x +
40.27 | 0.993 | y = 4.99x +
30.81 | 0.992 |
| 140 kVp | y = 3.59x +
39.74 | 0.982 | y = 3.02x +
29.36 | 0.980 |
|
ΔH100–140 | y = 2.51x +
0.53 | 0.999 | y = 2.02x +
1.45 | 0.997 |
| MRI, msec |
|
R2* | y = 23.07x +
32.75 | 0.926 | y = 14.04x +
79.79 | 0.913 |
Discussion
The results of the present study using phantoms
indicate that DECT may be useful for the determination of iron
concentration in heart and liver tissues. The HU value of DECT
increased with increasing iron concentrations in the phantoms in a
linear manner, and values were significantly correlated with MRI
R2* data. The R2 value from the linear
regression analysis for each individual technique revealed the
goodness of fit for the model, and indicated that DECT correlated
with MRI for iron quantification, although the correlation was not
completely linear at high iron concentrations. Furthermore, the
slope of the HU value change compared with the iron concentration
demonstrated that ΔH80–140 provided a better discernment
of iron concentration compared with ΔH100–140. As shown
in Fig. 3, the slope was steeper
at 80–140 kVp than at 100–140 kVp for the heart and liver; a
steeper slope indicates a greater change in CT HU per unit of iron
concentration, indicating a greater discriminatory power.
MRI has become a useful tool for the determination
of iron content in various tissues (18). MRI scans can be produced with
various echo times to alter the contrast between different organs.
As echo times increase, the image of a particular organ darkens;
however, when iron is present, the image of the organ darkens more
rapidly. The time for an organ to become twice as dark is
designated as the T2* value, and T2* is
inversely proportional to the iron concentration (18). R2*, defined as
1,000/T2*, is directly proportional to the iron
concentration (14). A number of
studies have examined the use of MRI in the determination of
cardiac and hepatic iron accumulation. In an animal study, Wood
et al (19) demonstrated
that MRI measurements of cardiac T2* may be used for
quantifying cardiac iron accumulation. Ghugre et al
(20) studied 31 patients with
transfusion dependent sickle cell disease and 48 patients with
thalassemia major and accurately determined cardiac R2*
measurements. In addition, Carpenter et al (21) reported that R2* values
were significantly correlated with cardiac iron concentration.
Determination of hepatic iron concentration by MRI has been studied
more extensively than that of cardiac iron determination (5,18).
Wood et al (22) evaluated
the use of R2 and R2* values for the determination of
hepatic iron concentration in 102 patients with iron overload and
13 controls, and reported that R2 and R2* values can
accurately measure hepatic iron concentration.
While CT can detect increased tissue iron levels,
quantification is not possible due to variations in CT attenuation.
In addition, coexisting fat in the liver can affect CT attenuation,
thus, the detection of iron. Wood et al (23) examined the use of quantitative CT
(QCT) for the determination of liver iron concentration by
comparing liver attenuation by QCT with MRI estimates of liver iron
concentration in 37 patients with siderosis secondary to
transfusions. The authors found that although the CT HU values
correlated with the MRI data when the liver iron concentration was
above the normal range, when the liver iron concentration was <8
mg/g dry weight of liver, quantitation was unable to be performed
due to the variability in intrinsic liver attenuation.
In DECT, two energy settings are used
simultaneously. This allows for the differentiation of materials
based on their energy-associated attenuation characteristics, such
as density (24). In a study using
phantoms and DECT, Fischer et al (7) reported a significant linear
correlation between liver iron concentration and HU. In addition,
Joe et al (8) used DECT to
analyze the iron concentrations in liver phantoms and in liver
transplant candidates, and compared the results with those of MRI.
In the phantom study of Joe et al (8), CT HU values were shown to be strongly
correlated with iron concentration, as was the ΔH between 80 and
140 kVp. In patients with clinically important hepatic iron
accumulation, DECT exhibited a similar diagnostic performance as
MRI, with areas under the receiver operating characteristic curves
of 0.881 and 0.897, respectively. Fewer studies have investigated
the use of DECT in the determination of cardiac iron accumulation.
Hazirolan et al (9)
compared the results of DECT and cardiac MRI for the detection of
myocardial iron in 19 patients with thalassemia and found that the
HU values of septal muscle were strongly correlated with
T2* values, whereas no correlation was observed in the
paraspinal muscle.
The primary limitation of the present study was the
use of phantoms. While phantoms can emulate the characteristics of
organs, the use of whole organs with varying iron concentrations,
as determined by analytical methods, is preferable. However, this
type of analysis is very expensive. An additional limitation is
that the results obtained with phantoms may not be the same as when
the technique is applied to living tissue. Finally, the fat content
of the liver can affect DECT results and this was not assessed in
the current study.
In conclusion, the results of the present study
demonstrate that DECT can be used for the determination of iron
concentration in liver and heart tissue, and that the results
correlate with those obtained with MRI. However, further study is
required on the use of DECT for the detection of heart and liver
iron concentrations in humans.
Acknowledgements
The study was supported by the National Cheng-Kung
University College of Hospital Research Grant (grant no.
NCKUH-10108008).
References
|
1
|
Wanless IR, Sweeney G, Dhillon AP, Guido
M, Piga A, Galanello R, Gamberini MR, Schwartz E and Cohen AR: Lack
of progressive hepatic fibrosis during long-term therapy with
deferiprone in subjects with transfusion-dependent
beta-thalassemia. Blood. 100:1566–1569. 2002. View Article : Google Scholar : PubMed/NCBI
|
|
2
|
Cohen AR, Galanello R, Pennell DJ,
Cunningham MJ and Vichinsky E: Thalassemia. Hematology Am Soc
Hematol Educ Program. 14–34. 2004. View Article : Google Scholar
|
|
3
|
Wood JC, Tyszka JM, Carson S, Nelson MD
and Coates TD: Myocardial iron loading in transfusion-dependent
thalassemia and sickle cell disease. Blood. 103:1934–1936. 2004.
View Article : Google Scholar : PubMed/NCBI
|
|
4
|
Ceci A, Felisi M, De Sanctis V and De
Mattia D: Pharmacotherapy of iron overload in thalassaemic
patients. Expert Opin Pharmacother. 4:1763–1774. 2003. View Article : Google Scholar : PubMed/NCBI
|
|
5
|
Wood JC: Impact of iron assessment by MRI.
Hematology Am Soc Hematol Educ Program. 2011:443–450. 2011.
View Article : Google Scholar : PubMed/NCBI
|
|
6
|
Fischer MA, Gnannt R, Raptis D, et al:
Quantification of liver fat in the presence of iron and iodine: an
ex-vivo dual-energy CT study. Invest Radiol. 46:351–358. 2011.
View Article : Google Scholar : PubMed/NCBI
|
|
7
|
Fischer MA, Reiner CS, Raptis D, et al:
Quantification of liver iron content with CT-added value of
dual-energy. Eur Radiol. 21:1727–1732. 2011. View Article : Google Scholar : PubMed/NCBI
|
|
8
|
Joe E, Kim SH, Lee KB, et al: Feasibility
and accuracy of dual-source dual-energy CT for noninvasive
determination of hepatic iron accumulation. Radiology. 262:126–135.
2012.PubMed/NCBI
|
|
9
|
Hazirolan T, Akpinar B, Unal S, Gümrük F,
Haliloglu M and Alibek S: Value of dual energy computed tomography
for detection of myocardial iron deposition in thalassaemia
patients: initial experience. Eur J Radiol. 68:442–445. 2008.
View Article : Google Scholar : PubMed/NCBI
|
|
10
|
Raptopoulos V, Karellas A, Bernstein J,
Reale FR, Constantinou C and Zawacki JK: Value of dual-energy CT in
differentiating focal fatty infiltration of the liver from
low-density masses. AJR Am J Roentgenol. 157:721–725. 1991.
View Article : Google Scholar : PubMed/NCBI
|
|
11
|
Chapman RW, Williams G, Bydder G, Dick R,
Sherlock S and Kreel L: Computed tomography for determining liver
iron content in primary haemochromatosis. Br Med J. 280:440–442.
1980. View Article : Google Scholar : PubMed/NCBI
|
|
12
|
Goldberg HI, Cann CE, Moss AA, Ohto M,
Brito A and Federle M: Noninvasive quantitation of liver iron in
dogs with hemochromatosis using dual-energy CT scanning. Invest
Radiol. 17:375–380. 1982. View Article : Google Scholar : PubMed/NCBI
|
|
13
|
Primak AN, Ramirez Giraldo JC, Liu X, Yu L
and McCollough CH: Improved dual-energy material discrimination for
dual-source CT by means of additional spectral filtration. Med
Phys. 36:1359–1369. 2009.PubMed/NCBI
|
|
14
|
Yeh BM, Shepherd JA, Wang ZJ, Teh HS,
Hartman RP and Prevrhal S: Dual-energy and low-kVp CT in the
abdomen. AJR Am J Roentgenol. 193:47–54. 2009. View Article : Google Scholar : PubMed/NCBI
|
|
15
|
Leighton DM, de Campo JF, Matthews R and
Sephton RG: Dual energy CT estimation of liver iron content in
thalassaemic children. Australas Radiol. 32:214–219. 1988.
View Article : Google Scholar : PubMed/NCBI
|
|
16
|
Bennett CM and Miller MB: How reliable are
the results from functional magnetic resonance imaging? Ann NY Acad
Sci. 1191:133–155. 2010. View Article : Google Scholar : PubMed/NCBI
|
|
17
|
Sim J and Wright CC: The kappa statistic
in reliability studies: use, interpretation, and sample size
requirements. Phys Ther. 85:257–268. 2005.PubMed/NCBI
|
|
18
|
Wood JC: Diagnosis and management of
transfusion iron overload: the role of imaging. Am J Hematol. 82(12
Suppl): 1132–1135. 2007. View Article : Google Scholar : PubMed/NCBI
|
|
19
|
Wood JC, Otto-Duessel M, Aguilar M, et al:
Cardiac iron determines cardiac T2*, T2, and T1 in the
gerbil model of iron cardiomyopathy. Circulation. 112:535–543.
2005. View Article : Google Scholar : PubMed/NCBI
|
|
20
|
Ghugre NR, Enriquez CM, Coates TD, Nelson
MD Jr and Wood JC: Improved R2* measurements in
myocardial iron overload. J Magn Reson Imaging. 23:9–16. 2006.
|
|
21
|
Carpenter JP, He T, Kirk P, et al: On
T2* magnetic resonance and cardiac iron. Circulation.
123:1519–1528. 2011.
|
|
22
|
Wood JC, Enriquez C, Ghugre N, et al: MRI
R2 and R2* mapping accurately estimates hepatic iron
concentration in transfusion-dependent thalassemia and sickle cell
disease patients. Blood. 106:1460–1465. 2005.PubMed/NCBI
|
|
23
|
Wood JC, Mo A, Gera A, Koh M, Coates T and
Gilsanz V: Quantitative computed tomography assessment of
transfusional iron overload. Br J Haematol. 153:780–785. 2011.
View Article : Google Scholar : PubMed/NCBI
|
|
24
|
Karçaaltincaba M and Aktaş A: Dual-energy
CT revisited with multidetector CT: review of principles and
clinical applications. Diagn Interv Radiol. 17:181–194.
2011.PubMed/NCBI
|