Introduction
In 2003, Sheppard et al (1) identified a new family of interferon
(IFN), which was named the IFN-λ family (IFN-λ1, -λ2 and -λ3) by
Kotenko et al (2). The
Human Genome Organization also temporarily provided the names
interleukin (IL)-28A, IL-28B and IL-29 (1). IFN-λs utilize different receptor
complexes for signal transduction from the classical type I IFNs;
however, the biological effects and even the activation of the
intracellular signal pathways are similar. Although using distinct
receptor complexes, IFN-λs appear to induce similar intracellular
signals to type I IFNs, upsetting cell apoptosis and inhibiting
cell proliferation through the activation of caspase-3, caspase-8
and caspase-9 (3). The antiviral
and immunomodulatory activity of IFN-λs has previously been
demonstrated (4). Quantitative
analysis of IFN-λ expression in human immune cell populations has
revealed a particularly strong expression in T and natural killer
(NK) cells (5), and it has been
found that, similar to human immune B, T and NK cells, human liver
cells express IL-28 receptor 1 (IL-28R1) and accept IFN-λ1, -λ2 and
-λ3. Furthermore, human keratinocytes, intestinal epithelial cells,
the A549 lung adenocarcinoma cell line, HepG2 and HU7 human
hepatoma cells and human esophageal cancer cells express IFN-λ1,
-λ2 and -λ3 (6). IFN-λ1, -λ2 and
-λ3 exhibit a direct anti-proliferative activity, and the human
IL-28 plasmid vector can significantly inhibit murine tumor growth
(7).
It has been confirmed that a desired gene carried by
an adenoviral vector can be stably expressed in a host cell
(8); adenoviral DNA cannot be
integrated into the host chromosome and thus poses no risk.
Furthermore, adenoviruses exhibit a broad spectrum of cell invasion
and their use is associated with fewer restrictions, thereby making
them ideal viral vectors. The purpose of this study was to identify
the anti-proliferative and immunomodulatory effects of human IFN-λ1
recombinant adenovirus (r-Ad-hIFN-λ1) on gastric cancer in
vivo in a nude mouse model of human gastric cancer.
Materials and methods
The recombinant adenoviruses r-Ad-hIFN-λ1 and
adenovirus encoding bacterial β-galactosidase (Ad-Lac Z) were
successfully constructed by Mr. Yang Liu (Affiliated People’s
Hospital of Jiangsu University, Zhenjiang, China) and stored at the
College of Clinical Medicine of Jiangsu University (Zhenjiang,
China) (9). The SGC-7901 cell line
was obtained from the Cell Culture Center of the Basic Institute of
Medical Sciences, Peking Union Medical College (Beijing, China).
Four-week-old BALB/c (nu/nu) mice, weighing 14–16 g, were provided
by the Comparative Medicine Center of Yangzhou University
(Yangzhou, China) and were raised in the Experimental Animal Center
of Jiangsu University. FuAiLe (FAL) medical glue was obtained from
the Beijing Institute of Medical Glue (Beijing, China).
TRIzol® reagent and anti-IFN-λ1 antibody were purchased
from Invitrogen Life Technologies (Carlsbad, CA, USA) and Santa
Cruz Biotechnology, Inc. (Santa Cruz, CA, USA), respectively.
Immunohistochemistry-related reagents were purchased in Gene Tech
Biotechnology (Shanghai) Co., Ltd. (Shanghai, China). All
polymerase chain reaction (PCR) primers were synthesized by
Shanghai Sangon Biological Engineering Technology & Services
Co., Ltd. (Shanghai, China). Fluorescein isothiocyanate
(FITC)-anti-mouse cluster of differentiation (CD)49b and -CD3 were
purchased from eBioscience, Inc. (San Diego, CA, USA). The terminal
deoxynucleotidyl transferase-mediated dUTP-biotin nick end labeling
(TUNEL) assay kit was obtained from Nanjing KGI Biotechnology
Development Co., Ltd. (Nanjing, China). Dulbecco’s modified Eagle’s
medium (DMEM) and fetal bovine serum (FBS) were purchased from
Gibco-BRL (Grand Island, NY, USA).
Construction of the human gastric cancer
orthotopic transplantation model
The SGC adenocarcinoma cells were cultured in DMEM
with 10% FBS and incubated at 37°C and 5% CO2. SGC-7901
cells were regulated to a cell number of 1×10⁶/ml, and
200 μl was subcutaneously inoculated at the back of the right
forelimb in the nude mice with a 1-ml syringe. When the diameter of
the subcutaneous tumor increased to 1 cm, the tumor was removed
into another nude mouse, a procedure that was repeated three times.
In brief, the subcutaneous tumor-bearing nude mice were sacrificed
by anesthesia overdose and the tumors were removed and sterilely
cut into ~l-mm3 sections. New nude mice were then
anesthetized with ketamine (70 μg/kg), an incision was made in the
abdominal wall, exposing the stomach serosa, and gentle
scarification was performed. Tumor tissue blocks were fixed in the
greater curvature of the stomach with FAL surgical medical glue,
and the stomach was then returned to the abdominal cavity. The
abdominal incision was closed layer-by-layer, with erythromycin
ointment applied for protection.
Animal experiments
Following division into three groups, the orthotopic
mouse models of human gastric cancer received injections in the
skeletal muscle of the right leg as follows: Blank group,
phosphate-buffered saline (PBS; 2 ml); Ad-Lac Z group,
4×10⁸ pfu Ad-Lac Z (2 ml); and r-Ad-hIFN-λ1 group,
4×10⁸ pfu r-Ad-hIFN-λ1 (2 ml). The injection was
performed once a week for three weeks. The volume of the tumor was
measured on days 0, 7, 14 and 21. All nude mice were sacrificed
after 28 days, and the adenoma, skeletal muscle, spleen and liver
were dissected in situ. A quantity of each tissue was fixed
with 4% paraformaldehyde and the remaining tissue was stored at
−80°C.
Tumor growth curve and inhibition
rates
Once the gastric cancer orthotopic model had been
established for two weeks, the short and long diameters of the
tumors were measured using a vernier caliper every seven days.
Prior to being sacrificed, the nude mice underwent an abdominal B
ultrasound. The volumes of the tumors were calculated using the
following formula: V=a2 × b × 0.52, where ‘V’ refers to
tumor volume, and ‘a’ and ‘b’ refer to the short and long diameters
of the tumor, respectively. The tumor inhibition rates were
calculated according to the last measurement of tumor volume with
the following computational formula: Inhibition rate = (average
tumor volume of the blank group - average tumor volume of the
r-Ad-hIFN-λ1 group)/average tumor volume of the blank group ×
100%.
Histopathology analysis
The orthotopically transplanted tumor and the liver
and enlarged lymph nodes were fixed with 4% paraformaldehyde.
Tissue blocks were dehydrated, cleared, paraffin-embedded and
sectioned at 5-μm thickness. The sections were stained by a
hematoxylin and eosin (HE) staining procedure. Pathological changes
were observed with an optical microscope (Axio Observer A1m; Pury
Seth Instrument Co., Ltd., Beijing, China) and images were
captured.
Immunohistochemistry
The tissue sections were prepared at 60°C overnight.
The paraffin sections were rinsed in xylene for 10 min twice and
dewaxed using an ethanol gradient (100, 95, 90, 80 and 70%), prior
to undergoing antigen retrieval in boiling sodium
citrate-hydrochloric acid buffer solution for 20 min. The sections
were then washed with PBS three times for 5 min each, incubated
with anti-IFN-λ1 antibody (dilution ratio 1:100) at 4°C overnight,
washed with PBS for 5 min three times and incubated with
anti-rabbit antibody (GT Vision™ I type polymer) for 10 min. A
further three 5-min washes with PBS were then performed, prior to
the section being incubated with 3,3′-diaminobenzidine (DAB)
working solution for 10 min, washed with PBS for 5 min three times
and stained for 5 sec with hematoxylin. The sections were
subsequently further washed with PBS for 5 min three times,
dehydrated using an ethanol gradient (70, 80, 90, 95 and 100%), and
then rinsed in xylene for 10 min twice. A neutral rubber seal was
subsequently applied.
Reverse transcription (RT)-PCR
Skeletal muscle tissues were cut into 50-mg sections
and homogenized on ice. Following centrifugation at 16,000 × g for
20 min at 4°C, the supernatant was discarded. The total RNA was
extracted from the pellet by TRIzol® reagent. The cDNA
was synthesized with Oligo (dT) primers and moloney murine leukemia
virus reverse transcriptase. One-tenth of the cDNA was used for PCR
amplification and the PCR products were separated in 1% agarose
gels by electrophoresis. The PCR protocol was as follows: Initial
denaturation for 5 min at 94°C, followed by 30 cycles for 30 sec at
94°C, annealing (IFN-λ1) for 30 sec at 53°C and extension for 30
sec at 72°C. The final extension was performed by an incubation
step for 10 min at 72°C. The PCR products were subjected to
electrophoresis in 1% agarose gel and visualized by ethidium
bromide. The bands were analyzed using Quantity One®
software (Bio-Rad, Hercules, CA, USA). All the primers are listed
in Table I.
 | Table IPrimers for quantitative polymerase
chain reaction amplification. |
Table I
Primers for quantitative polymerase
chain reaction amplification.
| Primer | Sequence | Product size, bp |
|---|
| IFN-λ1 |
| Upstream |
5′-TATCCAGCCTCAGCCCACAGCA-3′ | 176 |
| Downstream |
5′-ACAGGTTCCCATCGGCCACATA-3′ | |
| β-actin |
| Upstream |
5′-CACGAAACTACCTTCAACTCC-3′ | 262 |
| Downstream |
5′-ACAGGTTCCCATCGGCCACATA-3′ | |
Western blotting
The IFN-λ1 protein was detected by western blotting.
Tumor tissue (1 g) was cut into 1×1×1 mm sections and homogenized
on ice. Following rapid centrifugation at 224 × g, the supernatant
was discarded and the pellet was resuspended with 1,000 μl
pre-cooled radioimmunoprecipitation assay lysis buffer, consisting
of 3 μl sodium orthovanadate, 3 μl phenylmethyl sulfonyl fluoride
and 3 μl protease inhibitor cocktail. The mixture was homogenized
and lysed for 60 min on ice. Following centrifugation at 12,000 × g
for 15 min at 4°C, the supernatant was transferred into another
1.5-ml tube and mixed with an equal volume of loading buffer (2×)
and β-mercaptoethanol (20×). The tubes were then placed in boiling
water for 10 min. The extracted protein was stored at −80°C.
Extracted lysates (5 μl) were separated using 12% SDS-PAGE and the
protein expression of IFN-λ1 was confirmed by western blot analysis
with the specific antibody.
Apoptosis assay
The apoptosis assay was performed using the TUNEL
kit according to the manufacturer’s instructions (Nanjing KGI
Biotechnology Development Co., Ltd.). Briefly, the paraffin
sections were prepared overnight at 60°C, rinsed in xylene for 10
min and then immersed in the graded ethanol series. Subsequent to
washing with PBS for 5 min twice, the samples were each incubated
with proteinase K work liquid (100 μl) for 30 min at 37°C and
washed with PBS for 5 min three times. The samples were then
incubated with 3% H2O2 methanol for 10 min at
room temperature (15–25°C) and washed with PBS for 5 min three
times. The positive and negative controls were set up. Pre-treated
specimens were incubated with 50 μl terminal deoxynucleotidyl
transferase labeling reaction buffer for 60 min at 37°C in the
dark. Subsequently, the specimens were incubated with 50 μl
streptavidin-horseradish peroxidase for 30 min in the dark and 50
μl DAB coloration solution was applied for 5 min. The sections were
observed and images were captured using an optical microscope.
Under a magnification of ×400, areas were selected where the
apoptotic cells were distributed evenly, and the number of positive
cells out of 100 cells was counted. This was repeated three times.
The apoptosis index (AI) was calculated using the following
formula: AI = apoptotic cell number/(apoptotic cell number +
non-apoptotic cell number) × 100%.
Flow cytometry
Flow cytometry was performed to detect the number of
NK cells in the spleen. Subsequent to sacrifice, the spleen of each
mouse was gently removed and made into a splenocyte suspension. The
erythrocytes were lysed by the addition of 0.83%
Tris-NH4Cl solution. Following rinsing with PBS (pH 7.4)
three times, the splenocytes were re-suspended with staining buffer
at a density of 1×10⁶/ml. The splenocytes were dispensed
into 100 μl aliquots, placed into tubes and surface-labeled with 5
μl hamster anti-CD3e-phycoerythrin and CD49b-FITC (the NK cells
were CD3− and CD49+). The mixture was
incubated at 4°C for 30 min in the dark, prior to the addition of
200 μl pre-cooled staining buffer. Following centrifugation at 126
× g for 10 min, the precipitates were re-suspended twice and fixed
in 200 μl 1% paraformaldehyde. Labeled cells were washed and
analyzed with a FACSCalibur™ flow cytometer (BD Biosciences,
Bedford, MA, USA) by Windows Multiple Document Interface for Flow
Cytometry 2.9 software (Microsoft Corp., Redmond, WA, USA) and
CellQuest™ software (BD Biosciences). In each sample, staining was
compared with that of an appropriately labeled isotype control
antibody.
Statistical analysis
The results were analyzed with Statistical Analysis
System (SAS) 6.12 (SAS Institute Inc., Cary, NC, USA) and are
expressed as the mean ± standard deviation. To compare the
differences among the groups, statistical significance was analyzed
using Pearson’s χ2 test and a one-way analysis of
variance followed by post hoc comparisons. P<0.05 was considered
to indicate a statistically significant difference.
Results
Tumor growth curve and inhibition
rates
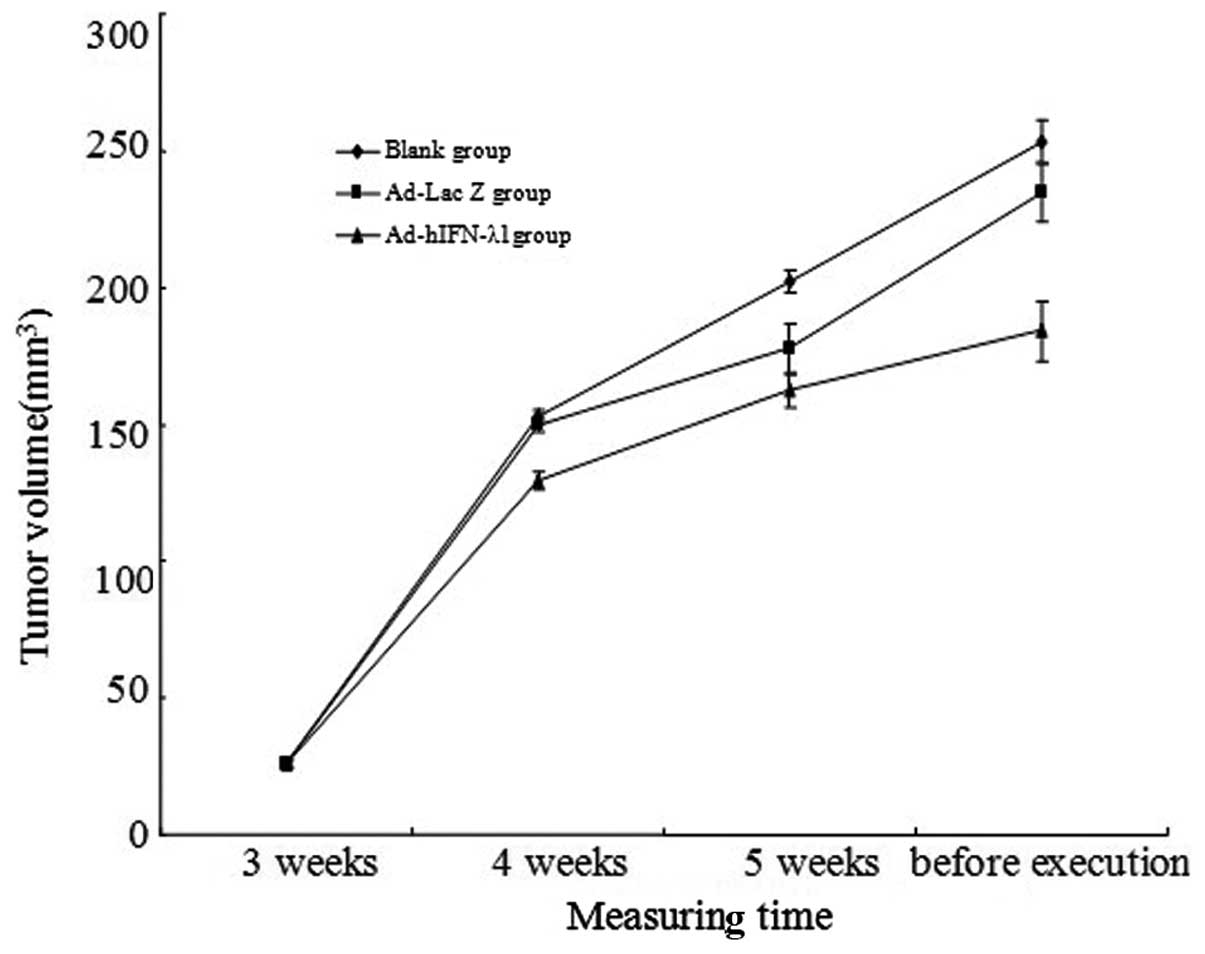
Tumor volumes notably increased in the blank and
Ad-Lac Z groups during the study. Although slight increases in
tumor volumes were also present in the r-Ad-hIFN-λ1 group, the
volumes were significantly lower than those in the blank and Ad-Lac
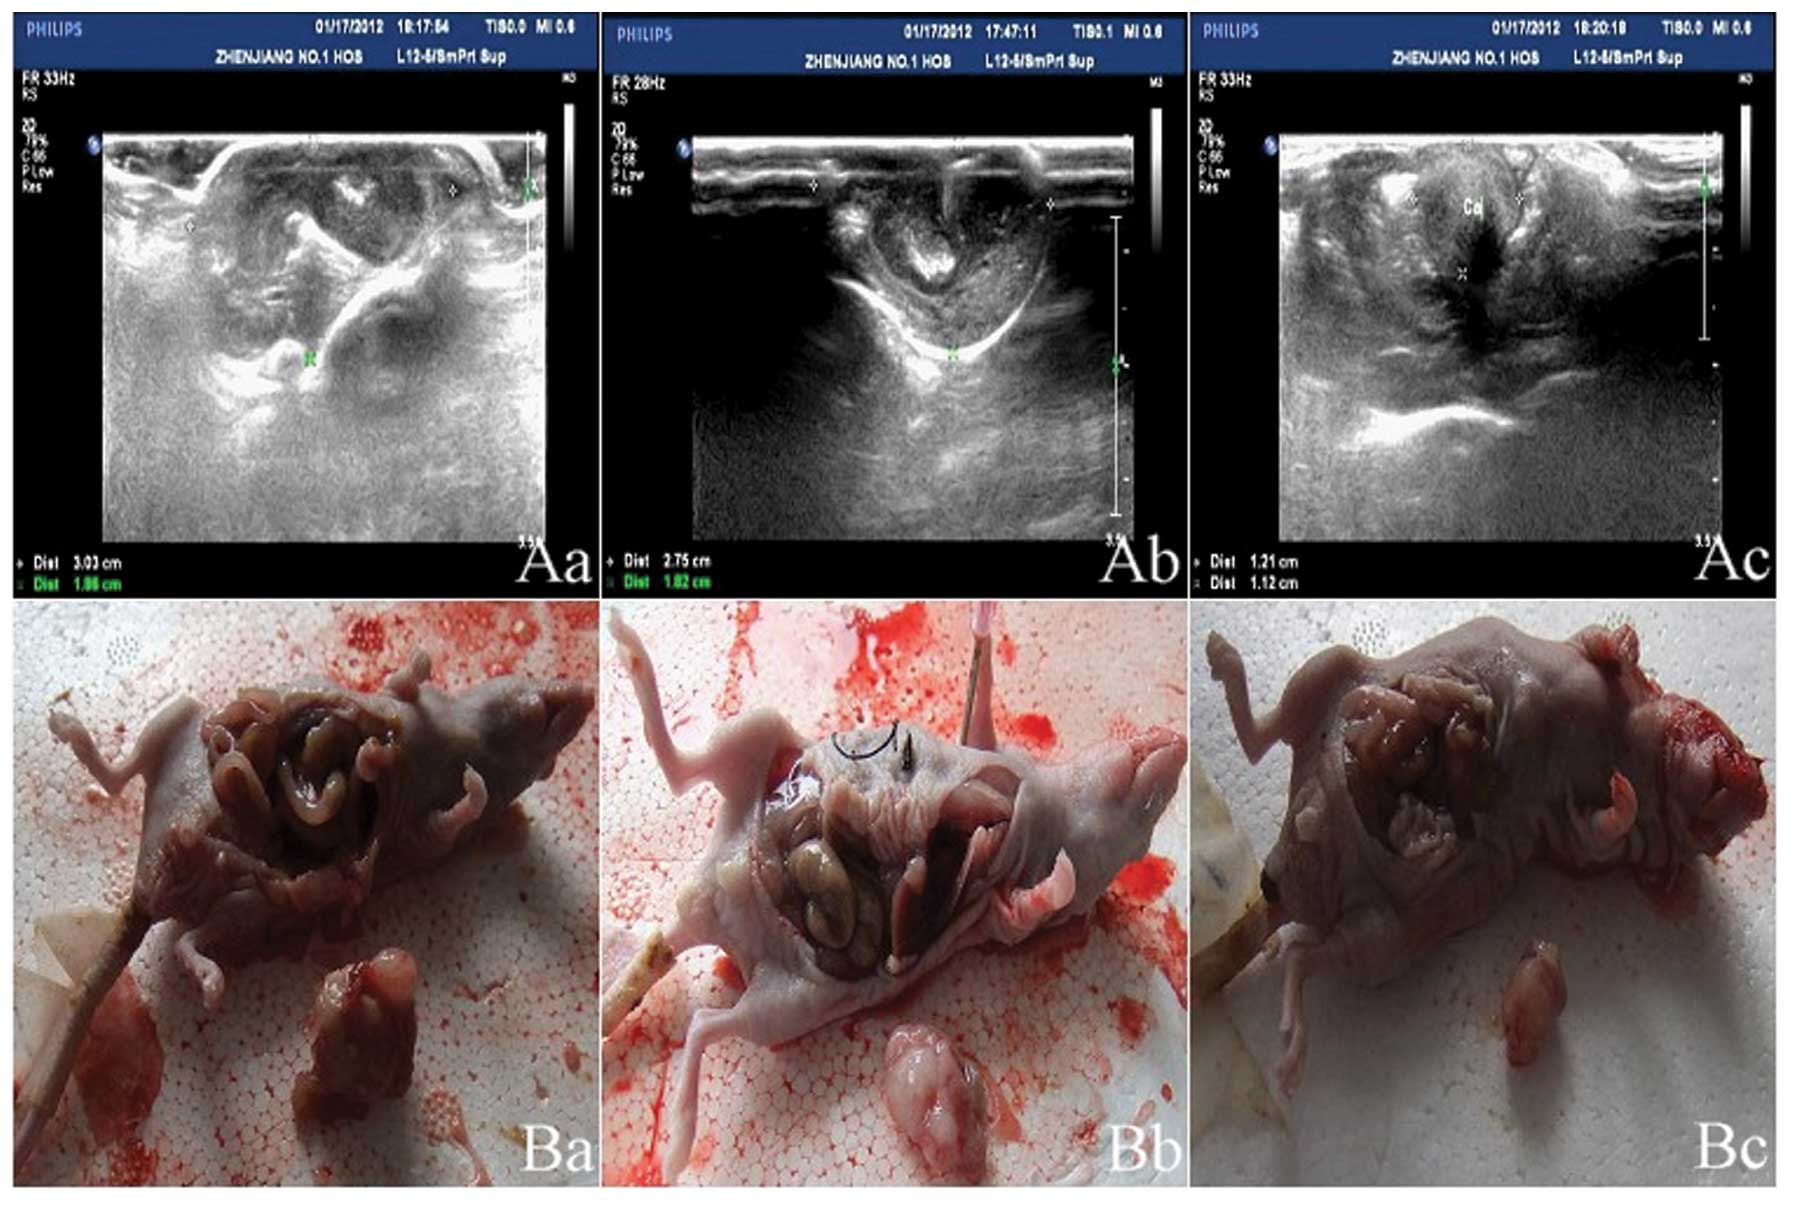
Z groups (Fig. 1 and Table II). The abdominal B ultrasound
showed the size and position of the orthotopically transplanted
tumors (Fig. 2). The inhibition
rate in the r-Ad-hIFN-λ1 group was 27.21%
[(253.18-184.29)/253.18×100%]. The abdominal laparotomy revealed
that following a month of intervention, the r-Ad-hIFN-λ1 group
exhibited no lymph node metastasis, whereas the Ad-Lac Z and blank
groups exhibited high levels of lymph node metastasis (Table III).
| Table IIGrowth of tumor and comparison of
tumor volume among the three groups. |
Table II
Growth of tumor and comparison of
tumor volume among the three groups.
| Group | | |
|---|
|
| | |
|---|
| Measurement time | Blank
(mm3) | Ad-Lac Z
(mm3) | r-Ad-hIFN-λ1
(mm3) | F-value | P-value |
|---|
| 7 days | 26.06±1.15 | 25.72±1.50 | 25.70±1.11 | 0.256 | 0.776 |
| 14 days | 152.68±2.51 | 149.62±2.41 | 129.19±3.30a | 212.64 | <0.001 |
| 21 days | 202.18±4.31 | 177.62±8.88 | 162.19±6.38b | 88.251 | <0.001 |
| Prior to
sacrifice | 253.18±7.69 | 234.62±10.59 | 184.29±10.84b | 131.90 | <0.001 |
| Table IIIAbdominal lymph node metastasis
rate. |
Table III
Abdominal lymph node metastasis
rate.
| Group | Abdominal lymph node
metastasis | Total (n) | Metastasis rate
(%) |
|---|
|
|---|
| + (n) | − (n) |
|---|
| Blank | 8 | 2 | 10 | 80 |
| Ad-Lac Z | 5 | 5 | 10 | 50 |
| r-Ad-hIFN-λ1 | 0 | 10 | 10 | 0 |
| Total | 13 | 17 | 30 | 46.7 |
Morphological analysis
HE staining of the orthotopic transplantation tumor
tissue sections showed that a number of cells exhibited a circular
disordered arrangement and had large and deeply stained nuclei.
These cells replaced the normal glandular tissue. Intra-abdominal
intumescent lymph nodes were found in the blank and Ad-Lac Z
groups. The HE staining revealed the normal structure of the lymph
nodes to be damaged and replaced by invasive tumor cells similar to
the orthotopic transplantation tumor cells in the histomorphology
(Fig. 3).
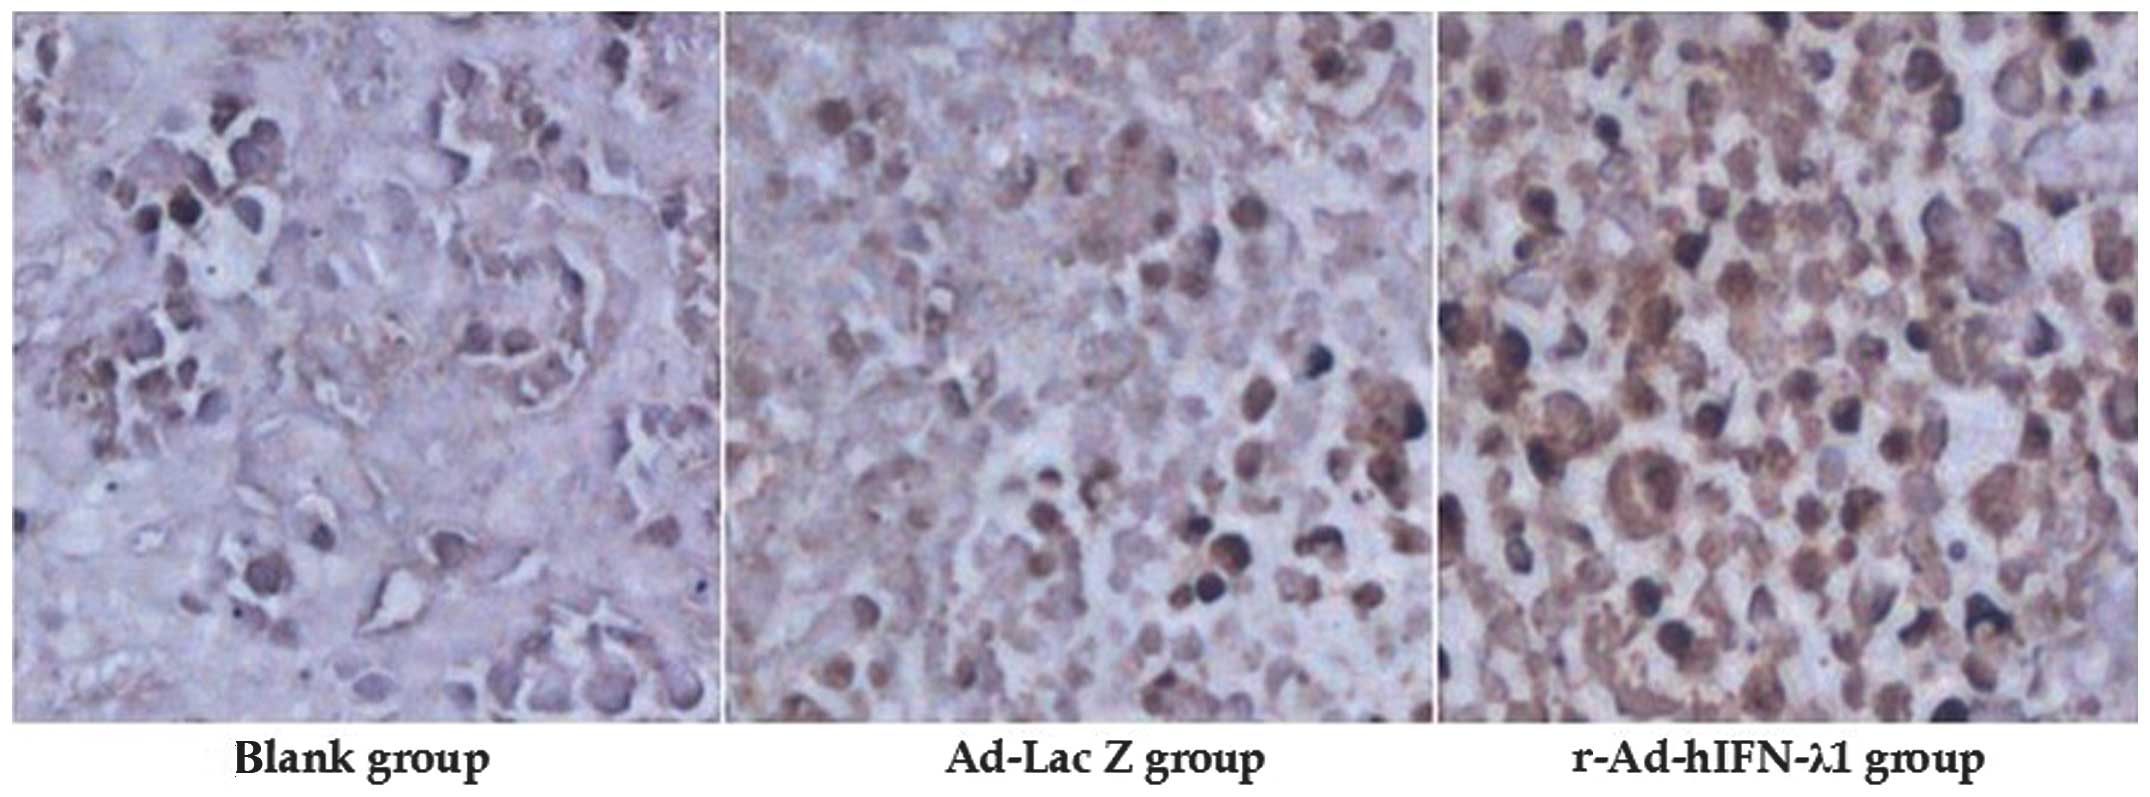
Immunohistochemistry
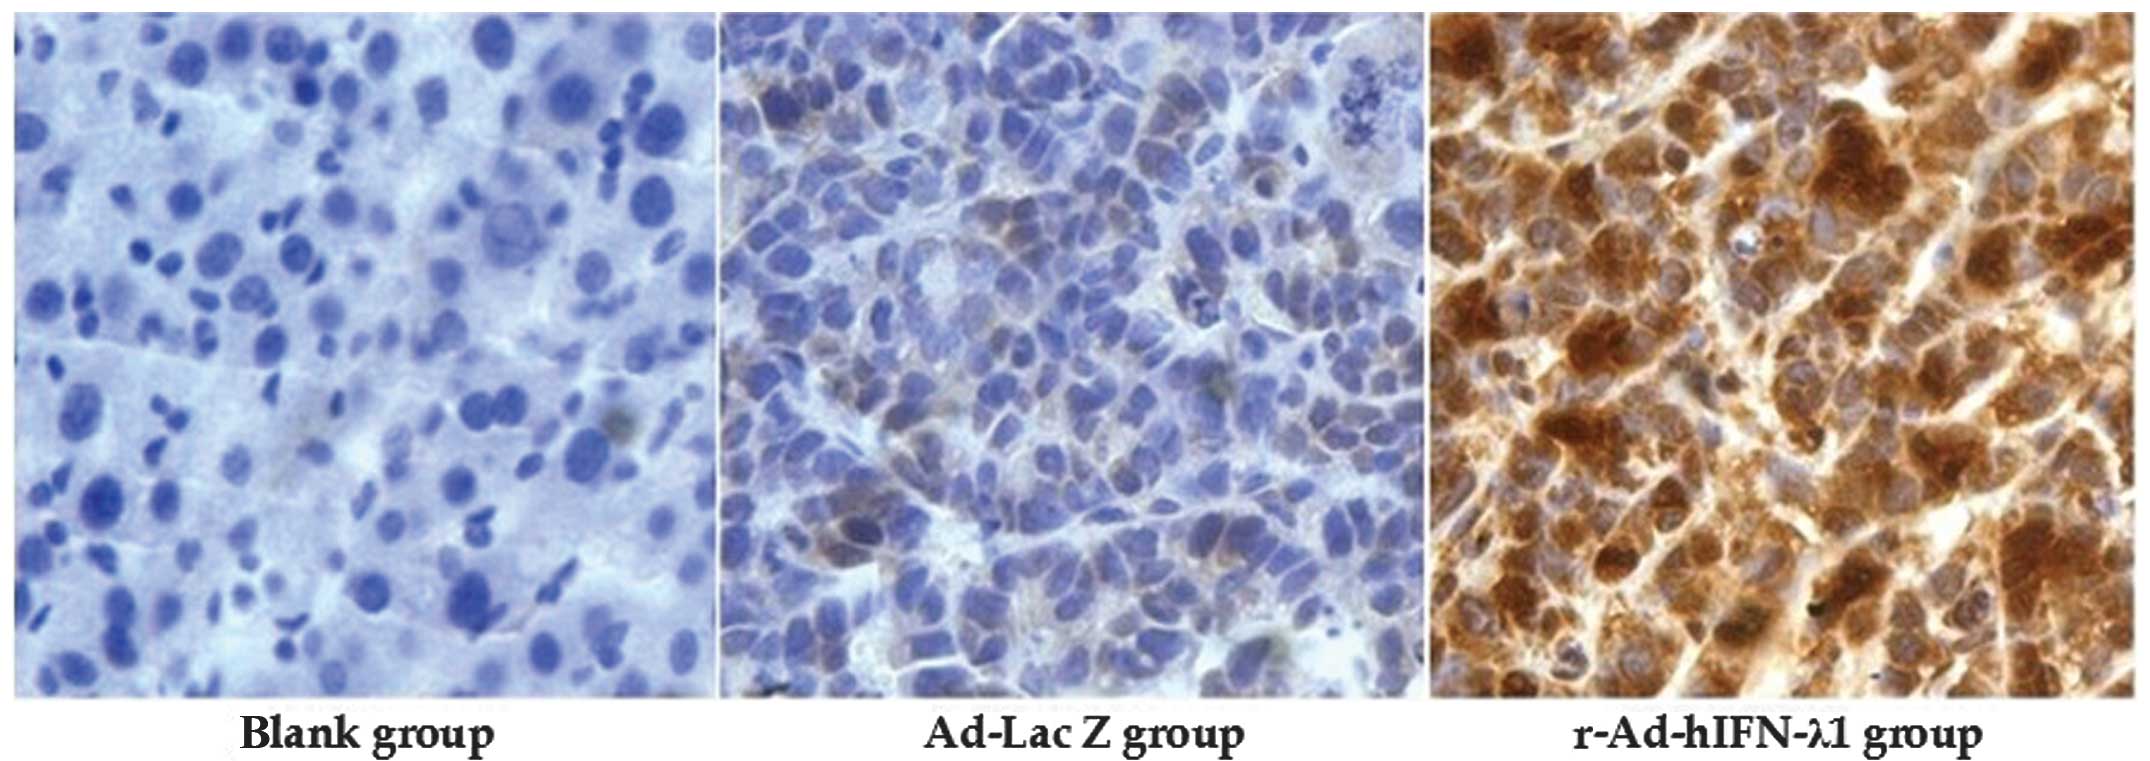
The protein expression of IFN-λ1 in the tumor tissue
was detected by immunohistochemistry. Strongly positive IFN-λ1
protein expression was observed in the cytoplasm in the
r-Ad-hIFN-λ1 group; however, the other two groups were negative for
IFN-λ1 protein expression. This indicated that IFN-λ1 was strongly
expressed in the tumor cells in the r-Ad-hIFN-λ1 group (Fig. 4).
Expression of hIFN-λ1 mRNA
RT-PCR was performed to confirm the transfection of
hIFN-λ1 mRNA in the skeletal muscle. The analysis showed evident
expression of hIFN-λ1 mRNA (~176 bp) following infection by
r-Ad-hIFN-λ1. In the blank and Ad-Lac Z groups, no hIFN-λ1 mRNA
expression was observed (Fig.
5).
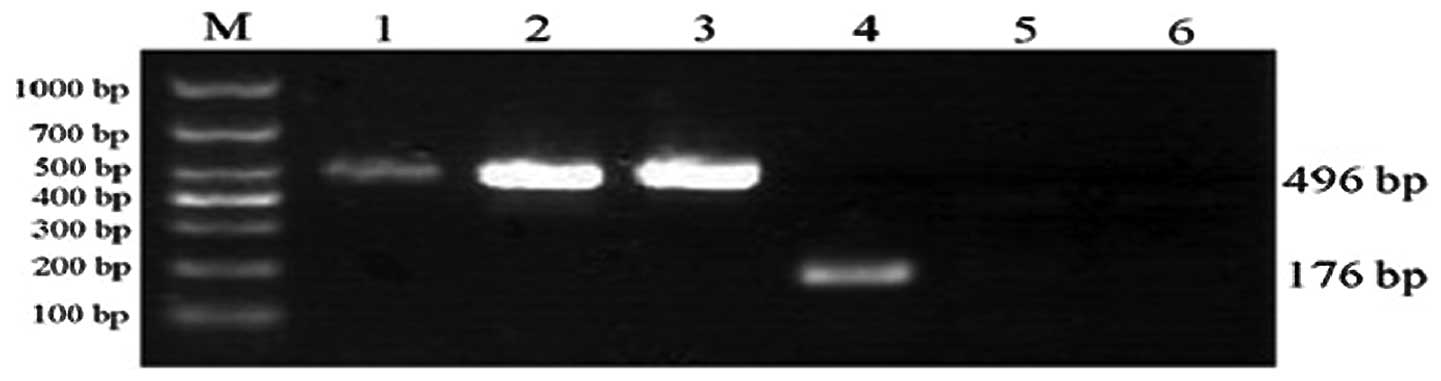 | Figure 5IFN-λ1 mRNA expression in skeletal
muscle. The r-Ad-hIFN-λ1 group expressed IFN-λ1 mRNA, while no
expression was identified in the other two groups. Lane: M, Marker;
1, GAPDH (r-Ad-hIFN-λ1 group); 2, GAPDH (Ad-Lac Z group); 3, GAPDH
(blank group); 4, hIFN-λ1 (r-Ad-hIFN-λ1 group); 5, hIFN-λ1 (Ad-Lac
Z group); 6, hIFN-λ1 (blank group). r-Ad-hIFN-λ1, human
interferon-λ1 recombinant adenovirus; Ad-Lac Z, adenovirus encoding
bacterial β-galactosidase. |
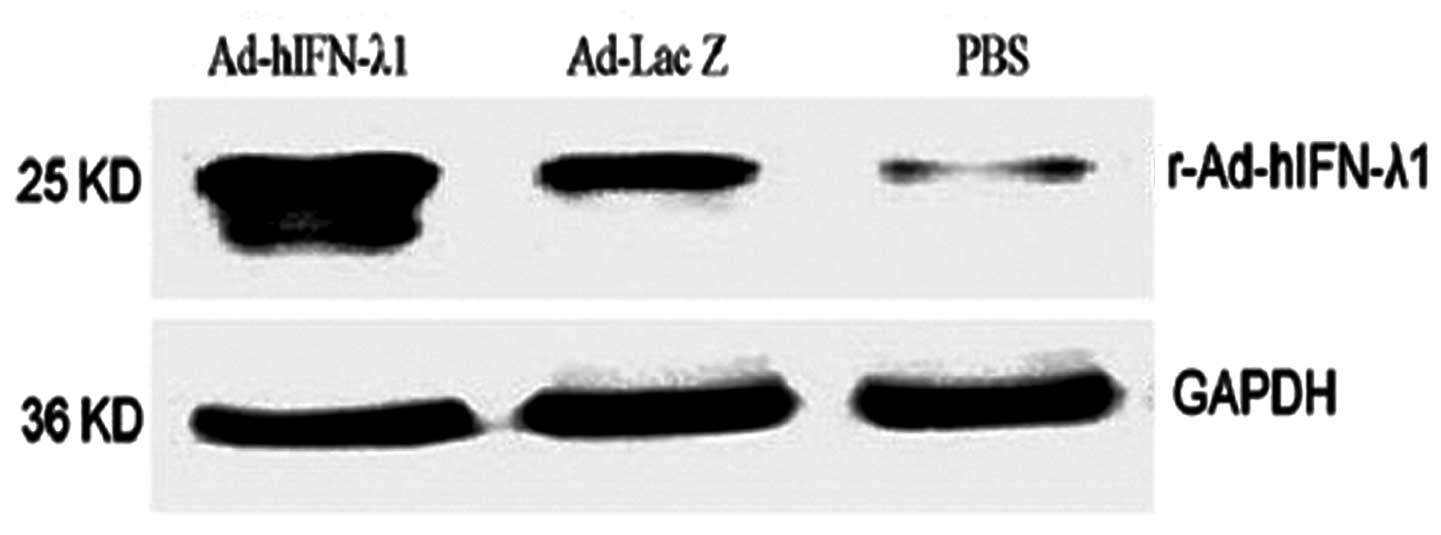
Protein expression of IFN-λ1
Western blotting was performed to confirm the
expression of hIFN-λ1 protein in the tumor tissues. The results
showed notable hIFN-λ1 expression in the tumor tissues following
infection by r-Ad-hIFN-λ1. In the Ad-Lac Z group, low levels of
hIFN-λ1 were expressed. In the blank group, hIFN-λ1 expression was
minimal (Fig. 6)
Apoptosis of tumor cells
TUNEL assay was performed to determine the level of
apoptosis in the tumor tissue paraffin sections. As expected, the
AI was significantly higher in the r-Ad-hIFN-λ1 group than that in
the blank and Ad-Lac Z groups. No significant difference was
identified between the blank and Ad-Lac Z groups (Fig. 7 and Table IV).
| Table IVComparison of the AI of apoptotic
cells among the three groups. |
Table IV
Comparison of the AI of apoptotic
cells among the three groups.
| Group | AI (n=10) | F-value | P-value |
|---|
| Blank | 0.265±0.049 | | |
| Ad-Lac Z | 0.329±0.167a | | |
| r-Ad-hIFN-λ1 | 0.772±0.075b | 63.664 | <0.001 |
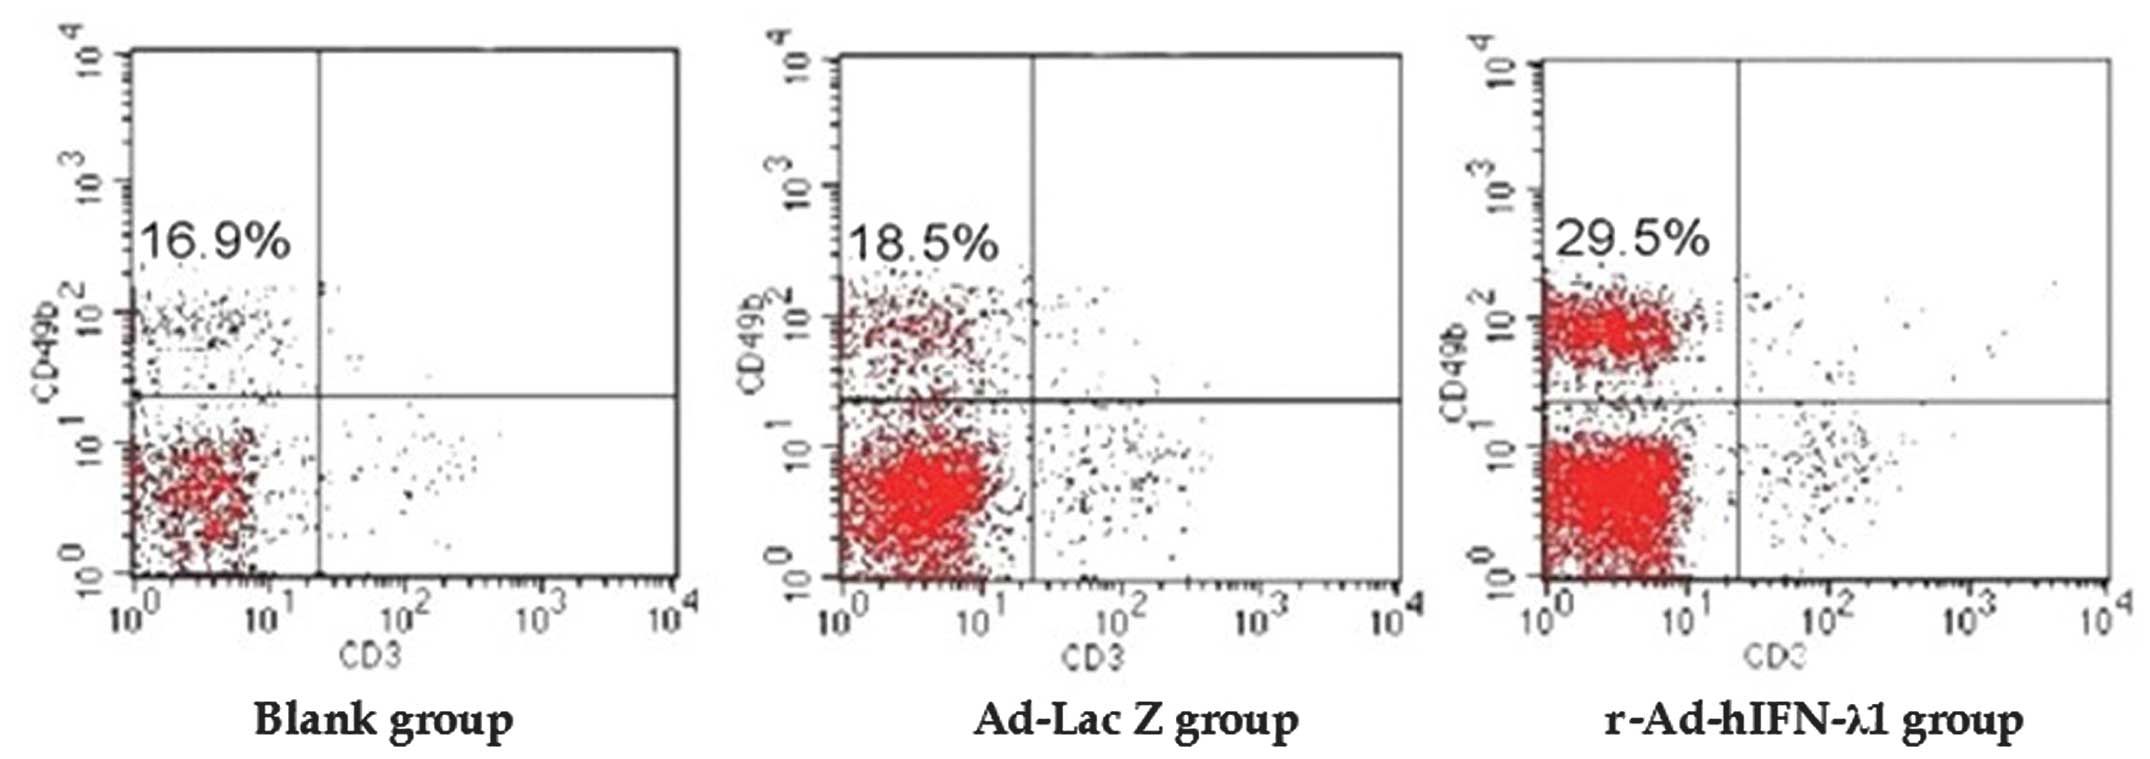
Flow cytometry
Flow cytometry was performed to detect the number of
NK cells in the spleen. The results showed that the number of NK
cells was significantly higher in the r-Ad-hIFN-λ1 group than that
in the blank and Ad-Lac Z groups. No significant difference was
identified between the blank and Ad-Lac Z groups (Fig. 8 and Table V).
| Table VComparison of the NK cell
proliferation in the spleen among the three groups. |
Table V
Comparison of the NK cell
proliferation in the spleen among the three groups.
| Group | NK cell
proliferation rate (%) | F-value | P-value |
|---|
| Blank | 16.35±1.43 | | |
| Ad-Lac Z | 17.70±1.09a | | |
| r-Ad-hIFN-λ1 | 26.53±1.54b | 162.96 | <0.0001 |
Discussion
It has been shown that the IFN family exhibits a
significant anti-tumor effect (4).
Thus, IFN is widely clinically applied as a biological therapy to
target hairy cell leukemia, chronic myelogenous leukemia, renal
cell carcinoma and melanoma (10).
IFN was also the first cytokine to undergo complete sequencing, be
purified to homogeneity, cloned, produced in a recombinant form and
used extensively in clinical application (11). However, treatment with type I IFNs
can occasionally cause significant side-effects, including fatigue,
fever, anorexia, depression and myelosuppression. When prolonged,
for instance in the case of hepatitis C treatment, type I IFN
treatment can lead to neurological or neuropsychiatric adverse
effects (12). Since the receptor
for IFN-λ exhibits a restricted pattern of expression, IFN-λ may
serve as a therapeutic alternative to type I IFNs and reduce the
adverse side-effects associated with type I IFN therapy (13).
At present, IFN-λs are a relatively novel member of
the cell factor family administered in tumor treatment. It has been
shown that IFN-λs inhibit a wide variety of tumors and induce their
apoptosis to the same degree as the type I IFNs (4). IFN-λs are different from type I IFNs
in their structure and respective receptors. The type I IFN
receptors are encoded by IFNα receptor (IFNAR) 1 and IFNAR2; by
contrast, IFN-λs belong to the type III group of IFNs, the receptor
complexes of which exhibit a restricted pattern of expression. The
receptors of type III IFNs have been identified as IL-28Rα and
IL-10Rβ; IL-10Rβ has also been shown to be one of the receptor
compounds of IL-10 and IL-10-related IL receptors, such as IL-22
and IL-26 (14). Although type I
and type III IFNs signal through distinct receptors, they both
induce anti-proliferative responses. The anti-proliferative
activity of IFN-λ1 has been previously demonstrated in a subclone
of the murine BW5147 thymoma cell line transfected with human
IFN-λR (15). Due to the
differences between the two types of IFN receptor complexes, it
could be hypothesized that the cells expressing different receptor
complexes may exhibit different reactions to IFN-λs and type I
IFNs. A previous study showed that the type I IFN receptor exists
on the surface of almost all cells and that the distribution of
IL-10Rβ is extensive. However, the expression of IL-28Rα appears to
be limited to specific tissues, with almost no expression in
fibroblasts and endothelial cells (16). In the present study, western
blotting and the immunohistochemical study of the tumors of the
r-Ad-hIFN-λ1 group showed that IFN-λ1 was successfully transfected
and effectively expressed in the cytoplasm of tumor cells injected
into skeletal muscle. This suggested that the IFN-λ1 receptor was
expressed on the surface of the gastric carcinoma cells.
In addition to antiviral effects, IFN-λs also
exhibit immunomodulatory effects that overlap with those of type I
IFNs in the innate and adaptive arms of the immune system. It has
been established that type I IFNs have the effect of stimulating
immune function, mainly by enhancing the response of T helper (Th)
1 cells and thereby increasing the amount of major
histocompatibility complex-I and the NK and T-cell-mediated killing
effect. Although the mechanism underlying the effect of IFN-λs on
the immune system was unclear, previous studies showed that IFN-λ
induced an increase in the levels of Th2 cells in peripheral blood
(17) and induced innate and
adaptive immune responses against tumors (18). IFN-λs modulate the immune system in
a similar manner to the type I IFNs; however, IFN-λs additionally
exert an anti-angiogenesis effect (19). In the present study, flow cytometry
was used to detect the number of NK cells in the spleen blood in
the r-Ad-hIFN-λ1 group. The immunoregulatory effects of IFN-λ are
cell type-specific, depending on the distribution of IFN-λRs, the
nature of the signal transduction and the genes activated.
Furthermore, IFN-λs are capable of signaling through almost all
signal transducer and activator of transcription molecules,
therefore exhibiting broader functions than the type I IFNs
(20).
Type I IFNs exhibit an anti-proliferative effect
that is predominantly caused by apoptosis and stagnation of the
cell cycle. The effect has been suggested to be associated with the
tumor suppressor gene p53, as shown by IFN-mediated apoptosis in
tumor cells with p53 mutation (21). Of note, Sato et al (7) showed that IFN-λ induced tumor
apoptosis and NK cell-mediated tumor destruction through innate
immune responses. Furthermore, IFN-λ expression in tumor cell lines
markedly inhibited subcutaneous and metastatic tumor formation
in vivo. A study using rats also found that IFN-λs exhibited
certain inhibitory effects on tumor metastasis by regulating
neutrophil, NK and CD8+ T cells (19). A previous in vivo study on
melanoma in nude mice confirmed that IFN-λs inhibited the growth of
the melanoma by stimulating autologous action that resulted in
tumor death (22). However,
Numasaki et al (18)
conducted an in vitro study administering an IFN-λ
intervention to a fibrosarcoma MCA205 cell line, and revealed that
the multicore-shape white blood cells, neutrophils, NK cells and
CD8+ cells played an important role in the inhibition of
the tumor cell growth process. In the present study, the
pathophysiological process of gastric cancer was successfully
simulated in mice.
In the present study, the tumor volume of the
r-Ad-hIFN-λ1 group was significantly lower than that of the blank
or Ad-Lac Z groups, and no intra-abdominal intumescent lymph nodes
were observed in the r-Ad-hIFN-λ1 group. The analysis of tumor
paraffin sections by TUNEL showed a higher level of apoptosis in
the r-Ad-hIFN-λ1 group than in the other two groups. These
findings indicated that r-Ad-hIFN-λ1 effectively inhibited the
growth and metastasis of gastric cancer and promoted gastric cancer
cell apoptosis.
In conclusion, IFN-λ1 was capable of inhibiting
tumor growth, decreasing the rate of tumor metastasis, as well as
killing tumor cells directly or indirectly. At the same time,
IFN-λ1 stimulated the immune system, leading to an indirect
anti-tumor effect. In future studies we aim to alter the structure
or administration route of IFN-λ1 in order to improve accordance
with clinical anti-tumor biological agents.
Acknowledgements
This study was supported by a grant from the
Zhenjiang Social Development Project (no. JLY2010005). The authors
would like to thank Ms. Yan Tao and Mr. Zhijian Zhang for their
technical assistance.
References
|
1
|
Sheppard P, Kindsvogel W, Xu W, et al:
IL-28, IL-29 and their class II cytokine receptor IL-28R. Nat
Immunol. 4:63–68. 2003. View
Article : Google Scholar : PubMed/NCBI
|
|
2
|
Kotenko SV, Gallagher G, Baurin VV, et al:
IFN-lambdas mediate antiviral protection through a distinct class
II cytokine receptor complex. Nat Immunol. 4:69–77. 2003.
View Article : Google Scholar : PubMed/NCBI
|
|
3
|
Meager A, Visvalingam K, Dilger P, Bryan D
and Wadhwa M: Biological activity of interleukins-28 and -29:
comparison with type I interferons. Cytokine. 31:109–118. 2005.
View Article : Google Scholar : PubMed/NCBI
|
|
4
|
Zheng Y, Li H, Yu J, Zhao H, Wang SE and
Ren X: Interferon-λs: special immunomodulatory agents and potential
therapeutic targets. J Innate Immun. 5:209–218. 2013.
|
|
5
|
Witte K, Gruetz G, Volk HD, et al: Despite
IFN-lambda receptor expression, blood immune cells, but not
keratinocytes or melanocytes, have an impaired response to type III
interferons: implications for therapeutic applications of these
cytokines. Genes Immun. 10:702–714. 2009. View Article : Google Scholar
|
|
6
|
Brand S, Beigel F, Olszak T, et al: IL-28A
and IL-29 mediate antiproliferative and antiviral signals in
intestinal epithelial cells and murine CMV infection increases
colonic IL-28A expression. Am J Physiol Gastrointest Liver Physiol.
289:G960–G968. 2005. View Article : Google Scholar
|
|
7
|
Sato A, Ohtsuki M, Hata M, Kobayashi E and
Murakami T: Antitumor activity of IFN-lambda in murine tumor
models. J Immunol. 176:7686–7694. 2006. View Article : Google Scholar : PubMed/NCBI
|
|
8
|
Halter R, Carnwath J, Espanion G, et al:
Strategies to express factor VIII gene constructs in the ovine
mammary gland. Theriogenology. 39:137–149. 1993. View Article : Google Scholar
|
|
9
|
Yan YL, Liu Y, Cao WY, Bu XF, Bu ZG and
Zheng JX: Human lamada-interferon expressed in BHK-21 cell line and
its bioactivity. Xi Bao Yu Fen Zi Mian Yi Xue Za Zhi. 24:950–953.
2008.(In Chinese).
|
|
10
|
Ferrantini M, Capone I and Belardelli F:
Interferon-alpha and cancer: mechanisms of action and new
perspectives of clinical use. Biochimie. 89:884–893. 2007.
View Article : Google Scholar : PubMed/NCBI
|
|
11
|
Billiau A: Interferon: the pathways of
discovery I. Molecular and cellular aspects. Cytokine Growth Factor
Rev. 17:381–409. 2006. View Article : Google Scholar : PubMed/NCBI
|
|
12
|
Raison CL, Demetrashvili M, Capuron L and
Miller AH: Neuropsychiatric adverse effects of interferon-alpha:
recognition and management. CNS Drugs. 19:105–123. 2005. View Article : Google Scholar : PubMed/NCBI
|
|
13
|
Brand S, Zitzmann K, Dambacher J, et al:
SOCS-1 inhibits expression of the antiviral proteins 2′,5′-OAS and
MxA induced by the novel interferon-lambdas IL-28A and IL-29.
Biochem Biophys Res Commun. 331:543–548. 2005.
|
|
14
|
Langer JA, Cutrone EC and Kotenko S: The
Class II cytokine receptor (CRF2) family: overview and patterns of
receptor-ligand interactions. Cytokine Growth Factor Rev. 15:33–48.
2004. View Article : Google Scholar : PubMed/NCBI
|
|
15
|
Dumoutier L, Tounsi A, Michiels T,
Sommereyns C, Kotenko SV and Renauld JC: Role of the interleukin
(IL)-28 receptor tyrosine residues for antiviral and
antiproliferative activity of IL-29/interferon-lambda 1:
similarities with type I interferon signaling. J Biol Chem.
279:32269–32274. 2004. View Article : Google Scholar : PubMed/NCBI
|
|
16
|
Sommereyns C, Paul S, Staeheli P and
Michiels T: IFN-lambda (IFN-lambda) is expressed in a
tissue-dependent fashion and primarily acts on epithelial cells in
vivo. PLoS Pathog. 4:e10000172008. View Article : Google Scholar : PubMed/NCBI
|
|
17
|
Pekarek V, Srinivas S, Eskdale J and
Gallagher G: Interferon lambda-1 (IFN-lambda1/IL-29) induces ELR(-)
CXC chemokine mRNA in human peripheral blood mononuclear cells, in
an IFN-gamma-independent manner. Genes Immun. 8:177–180. 2007.
View Article : Google Scholar : PubMed/NCBI
|
|
18
|
Numasaki M, Tagawa M, Iwata F, et al:
IL-28 elicits antitumor responses against murine fibrosarcoma. J
Immunol. 178:5086–5098. 2007. View Article : Google Scholar : PubMed/NCBI
|
|
19
|
Mennechet FJ and Uzé G:
Interferon-lambda-treated dendritic cells specifically induce
proliferation of FOXP3-expressing suppressor T cells. Blood.
107:4417–4423. 2006. View Article : Google Scholar
|
|
20
|
Uzé G and Monneron D: IL-28 and IL-29:
newcomers to the interferon family. Biochimie. 89:729–734.
2007.PubMed/NCBI
|
|
21
|
Porta C, Hadj-Slimane R, Nejmeddine M, et
al: Interferons alpha and gamma induce p53-dependent and
p53-independent apoptosis, respectively. Oncogene. 24:605–615.
2005. View Article : Google Scholar : PubMed/NCBI
|
|
22
|
Lasfar A, Lewis-Antes A, Smirnov SV, et
al: Characterization of the mouse IFN-lambda ligand-receptor
system: IFN-lambdas exhibit antitumor activity against B16
melanoma. Cancer Res. 66:4468–4477. 2006. View Article : Google Scholar : PubMed/NCBI
|