Introduction
Diabetes is a metabolic disorder that is typically
characterized by high levels of blood sugar. Prolonged high blood
sugar levels may cause macrovascular and microvascular diseases,
leading to chronic damage and dysfunction of various tissues,
particularly the eyes, kidneys, heart, veins and nerves (1). In patients with type 2 diabetes,
insulin sensitivity is usually decreased due to insulin resistance.
Although insulin resistance may be partially compensated by
increasing the levels of insulin in the blood, insulin secretion
remains insufficient to overcome the lesions caused by obesity and
high levels of blood sugar. The incidence rate of cerebrovascular
disease in patients with diabetes is >50%. Lesions on the
vascular intima induced by diabetes are widely hypothesized to
result in cerebral artery stenosis, which causes local
embolization, as well as cerebral ischemia, hypoxia and neuronal
necrosis (2). Thus, vascular
lesions have always been an important focus of studies
investigating the cerebral complications of diabetes. During the
occurrence and development of diabetic cerebral injury, vascular
disease may induce changes in the expression levels of numerous
regulatory factors; hypoxia-inducible factor-1α (HIF-1α) is one of
these regulatory factors (3).
The up- and downregulation of genes may be affected
by numerous factors with various mechanisms. The microRNA (miRNA)
regulatory pathway is one of the most well-studied mechanisms.
miRNA-18a belongs to the miR17-92 gene cluster, and HIF-1α is one
of the target genes of miRNA-18a (4). The stable gene expression profiles
and specificity of miRNA-18a make it a specific marker for the
early diagnosis and treatment of a number of diseases that are
associated with HIF-1α. A previous study indicated that
upregulation of miRNA-18a downregulates the expression level of
HIF-1α in tumor tissues (5).
However, to the best of our knowledge, the regulatory effect of
HIF-1α in diabetic cerebral injury has not been previously
investigated.
In order to provide early diagnostic approaches for
cerebral injury induced by type 2 diabetes, the present study
investigated the expression levels of miRNA-18a in the blood of
patients with type 2 diabetes and the association with cerebral
injury.
Materials and methods
Subjects
According to the diagnostic criteria for diabetes
set by the World Health Organization in 1999 (6), type 2 diabetes patients hospitalized
at the Fourth People’s Hospital of Jinan (Jinan, China) between
January and December 2013 were enrolled in the study. The patients
were divided into a control group of healthy subjects and two
experimental groups of patients with severe or mild diabetes. The
control group comprised 33 individuals, including 18 males and 15
females, with ages ranging from 30 to 76 years (average age, 51.6
years). In the mild diabetes group, there were 33 individuals,
including 16 males and 17 females, with ages ranging from 32 to 75
years (average age, 52.4 years). There were 33 individuals in the
severe diabetes group, including 13 males and 20 females, with ages
ranging between 35 to 72 years (average age, 53.8 years).
Intracranial pressure monitoring, brain oxygen partial pressure
monitoring and computed tomography scanning were performed on six
patients from the severe diabetes group. Blood samples were
collected from all the subjects following approval by the Ethics
Committee of The Fourth People’s Hospital of Jinan. Informed
consent was obtained from the patients or their families.
Reagents and instruments
miRcute miRNA isolation, miRcute miRNA first-strand
cDNA synthesis and miRcute miRNA qPCR detection kits were purchased
from Tiangen Biotech Co., Ltd. (Beijing, China). A quantitative
polymerase chain reaction (qPCR) iQ5 Optical System and Image
Lab™ software were obtained from Bio-Rad Laboratories,
Inc. (Hercules, CA, USA). The primary antibodies against HIF-1α
were purchased from Abcam (Cambridge, MA, USA).
Sample collection
Blood samples were collected and divided into equal
portions. One portion was sent immediately to the hospital
laboratories to determine changes in the biochemical indicators
with regard to brain-specific changes, including those of the S100
protein (S100B), neuron-specific enolase (NSE), myelin basic
protein (MBP) and endothelin-1 (ET-1). The remaining samples were
stored in a refrigerator at −80°C.
qPCR
Total RNA was extracted from the serum using TRIzol
reagent (Invitrogen Life Technologies, Carlsbad, CA, USA). The
quality of the extracted RNA was confirmed by a NanoDrop 1000
UV-Vis spectrophotometer (optical density ratio at 260/280 nm;
NanoDrop Technologies, Wilmington, DE, USA). The total RNA
underwent reverse transcription to acquire cDNA.
The primers used for qPCR were as follows: HIF-1α
upstream, 5′-GACAAGCCACCTGAGGAGAG-3′ (381 bp) and downstream,
5′-GTTCGCATCTTGATAAGGCC-3′; and β-actin upstream,
5′-GGCATGGGTCAGAAGGATTCC-3′ (316 bp) and downstream,
5′-ATGTCACGCACGATTTCCCGC-3′. The amplification conditions were as
follows: Initial denaturation at 94°C for 2 min, followed by 45
cycles of denaturation at 94°C for 30 sec, annealing at 60°C for 1
min and extension at 68°C for 2 min, with a final elongation at
68°C for 7 min. The 2−ΔΔCt method was used to calculate
the ratio of the gray levels of HIF-1α against those of
β-actin.
For qPCR analysis of miRNA-18a, the primers used
were as follows: miRNA-18a upstream, 5′-GATAGCAGC
ACAGAAATATTGGC-3′; U6 snRNA upstream, 5′-GCGCGTCGTGAAGCGTTC-3′; and
the universal downstream primer, 5′-GTGCAGGGTCCGAGGT-3′. The
amplification conditions were as follows: Initial denaturation at
95°C for 10 min, followed by 40 cycles of denaturation at 95°C for
15 sec, annealing at 60°C for 1 min and extension at 72°C for 2
min, with a final elongation at 72°C for 7 min. The
2-ΔΔCt method was used to calculate the ratio of gray
levels, where U6 was used as the internal reference.
Western blot analysis
Total proteins were extracted from the samples
according to the procedures for protein lysis (7). Following the determination of the
protein sample concentration using a bicinchoninic acid protein
assay kit (Pierce, Rockford, IL, USA), the samples were mixed with
sodium dodecyl sulfate polyacrylamide gel electrophoresis loading
buffer, prior to boiling for 5 min. Protein samples (20 μg) were
loaded onto the gel (10%) for electrophoresis, and electrically
transferred onto polyvinylidene difluoride membranes (Millipore,
Billerica, MA, USA) charged at a constant 100 V in an ice bath for
2 h. The membrane was blocked with skimmed milk (5%) for 1 h at
room temperature. Primary antibodies against HIF-1α (1:2,000;
rabbit anti-human polyclonal antibody; Abcam, Cambridge, MA, USA)
and the internal reference protein, β-actin (1:5,000; abbit
anti-human polyclonal antibody; Abcam), were added prior to
incubation overnight at 4°C. Following rinsing with
phosphate-buffered saline with Tween 20 three times for 10 min,
horseradish peroxidase conjugated goat anti-rabbit immunoglobulin G
(IgG; 1:3,000; Abcam) was added prior to incubation at room
temperature for 1 h. The samples were subsequently rinsed with
phosphate-buffered saline with Tween 20 three times for 10 min. The
immunoreactive bands were visualized by enhanced chemiluminescence
(Pierce). Image Lab™ software was used to acquire images
and analyze the signal intensity. The relative expression levels of
target proteins were calculated from the ratio of the gray levels
of the target protein bands against those of the β-actin bands.
Statistical analysis
Results were analyzed using SPSS 18.0 software
(SPSS, Inc., Chicago, IL, USA), and are expressed as the mean ±
standard deviation. All data were subjected to a normality test.
Multiple sets of measurements were analyzed using one-way analysis
of variance. To determine the homogeneity of variance, Fisher’s
least significant difference and the Student-Newman-Keuls tests
were used. To determine the heterogeneity of variance, Tamhane’s T2
or Dunnett’s T3 tests were used. P<0.05 was considered to
indicate a statistically significant difference; P<0.01 was
considered to indicate a highly statistically significant
difference.
Results
Mild diabetes leads to slight cerebral
injury, while severe diabetes causes severe cerebral injury,
according to the levels of biochemical indicators
To compare the biochemical indicators among the
control, mild diabetes and severe diabetes groups, the
concentrations of S100B, NSE, MBP and ET-1 were measured. The
levels of NSE and MBP in the mild diabetes group were significantly
higher compared with those in the control group (P<0.05). In the
severe diabetes group, the levels of S100B, NSE, MBP and ET-1 were
all significantly higher compared with those in the control group
(P<0.01). In addition, the NSE concentration was significantly
higher in the severe diabetes group when compared with the mild
diabetes group (P<0.05), while the levels of S100B, MBP and ET-1
exhibited a highly statistically significant difference when
comparing the two groups (P<0.01; Table I). Notably, the levels of all the
biochemical indicators greatly exceeded their clinically normal
reference values (Table I). These
observations indicated that mild diabetes led to slight cerebral
injury, while severe diabetes caused severe cerebral injury.
 | Table IBiochemical indicators for
brain-specific changes. |
Table I
Biochemical indicators for
brain-specific changes.
| Parameter | S100B (μg/l) | NSE (U/ml) | MBP (ng/ml) | ET-1 (ng/l) |
|---|
| Control | 0.04±0.02 | 9.18±5.23 | 1.14±0.96 | 46.1±5.58 |
| Mild diabetes | 0.06±0.03 | 12.08±7.16a | 1.98±1.03a | 48.8±7.71 |
| Severe diabetes | 0.51±0.16b,d | 16.22±8.18b,c | 6.74±3.59b,d | 59.08±10.66b,d |
| Normal reference
values | <0.05 | <12.5 | 2.28±1.65 | 50.8±7.58 |
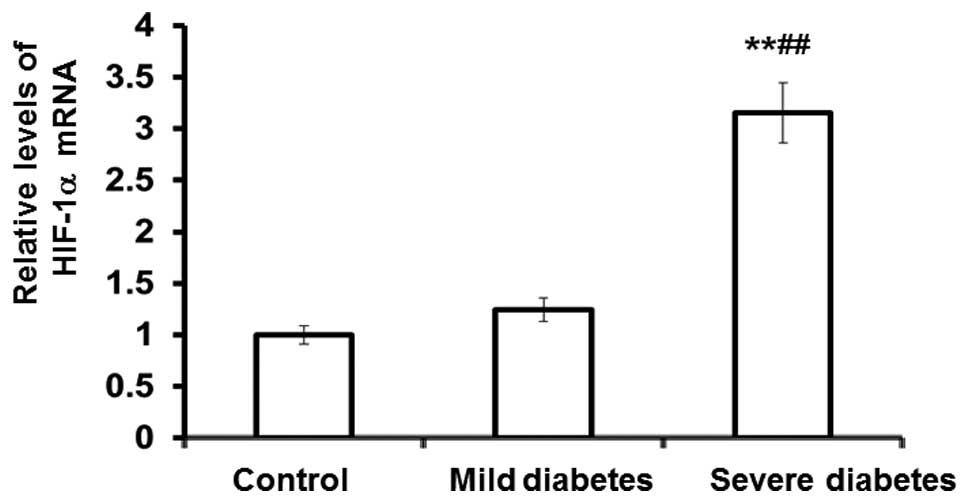
HIF-1α mRNA and protein expression
markedly increase in patients with severe diabetes, while only
HIF-1α protein expression increases in mild diabetic patients
To determine the mRNA and protein expression levels
of HIF-1α in the control, mild diabetes and severe diabetes groups,
qPCR and western blot analysis were performed. The qPCR results
revealed that the mRNA expression levels of HIF-1α in the severe
diabetes group were significantly elevated compared with those in
the control and mild diabetes groups (P<0.01; Fig. 1). In addition, the western blot
analysis results demonstrated that the protein expression levels of
HIF-1α in the severe diabetes group were significantly elevated
compared with the control (P<0.01) and mild diabetes groups
(P<0.05). Furthermore, the protein expression of HIF-1α in the
mild diabetes group was significantly higher compared with the
control group (P<0.05; Fig. 2).
These observations indicated that the mRNA and protein expression
levels of HIF-1α were markedly increased in patients with severe
diabetes, whereas for the mild diabetes patients, an increase in
HIF-1α protein expression was observed, but not mRNA
expression.
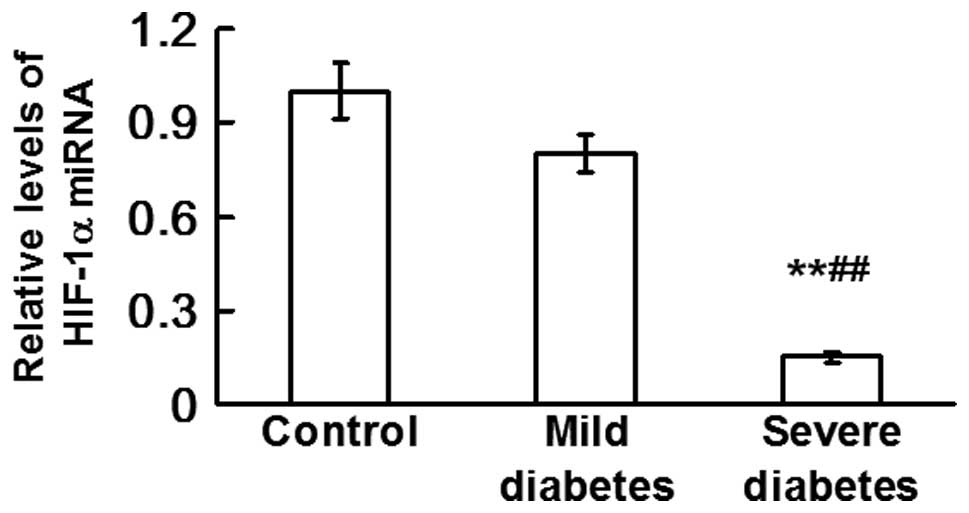
Expression levels of miRNA-18a are
downregulated by severe diabetes
qPCR was used to determine the levels of miRNA-18a
in the control, mild diabetes and severe diabetes groups. The
results revealed that the levels of miRNA-18a in the severe
diabetes group were significantly lower compared with those in the
control and mild diabetes groups (P<0.01; Fig. 3). This observation indicated that
the levels of miRNA-18a were downregulated by severe diabetes, in
contrast to the upregulation of HIF-1α mRNA and protein
expression.
Discussion
Cerebral injury, such as brain thrombosis, brain
infarction, secondary epilepsy and dementia, is one of the most
severe complications of diabetes. However, the pathogenesis of
diabetes-induced cerebral injury remains unclear (8). There are various methods of detecting
cerebral injury in current clinical practice, including functional
tests and biochemical detection. However, clinical application of
the functional tests is limited due to patient compliance and
affordability. Therefore, detection by biochemical indicators has
become the common method for the evaluation of cerebral injury.
Biochemical indicators that reliably reflect
brain-specific changes include S100B (9), NSE (10), MBP (11) and ET (12). In the present study, these
biochemical indicators were used to evaluate the degree of cerebral
injury in patients with diabetes. The data revealed that the levels
of biochemical indicators in patients with severe diabetes were
distinct from those in the control group, and were markedly higher
than the clinically normal reference values, indicating that
cerebral injury had already occurred in the patients. Although only
two biochemical indicators in the patients with mild diabetes were
significantly different from individuals in the control group, all
the biochemical indicators in the mild diabetes group were close to
or only slightly higher than the clinically normal reference
values, indicating that the patients may have had slight cerebral
injury that was alleviated through self-regulation or other
reasons. The clinical presentations of the patients concurred with
the current observations. The majority of the patients with severe
diabetes experienced dizziness, tinnitus, sleepiness, transient
amnesia and sleep disturbances; however, considerably fewer
patients in the other two groups exhibited these presentations.
Intracranial pressure monitoring, brain oxygen partial pressure
monitoring and computed tomography scanning in several patients
revealed increased intracranial pressure, lower oxygen partial
pressure and slight thrombus and stenosis in the intracranial
veins.
In an environment of local oxygen deficiency or
tumor growth, HIF-1α, as an important transcription factor for the
regulation of oxygen homeostasis, is upregulated (13). The mechanisms underlying this
compensatory and pathological procedure promote angiogenesis,
increase the blood supply, improve the situation of oxygen
deficiency or meet the requirements for the growth and
proliferation of tumors. Angiopathies induced by diabetes,
including thrombus and infarction, may cause blood and oxygen
deficiency in the whole body, resulting in the upregulation of
HIF-1α. Since brain samples are valuable and hard to retrieve from
living patients, the detection of HIF-1α expression in the brain
tissue is difficult. However, when the severity of cerebral injury
induced by diabetes reaches a certain level, HIF-1α enters the
blood circulation from the brain. Therefore, the levels of HIF-1α
detected in the blood may indirectly reflect the levels of HIF-1α
in the brain. In the present study, the mRNA and protein expression
levels of HIF-1α in patients with severe diabetes were
significantly higher compared with those in the other two groups,
indicating that local hypoxia may exist in the brains of severely
diabetic patients. Thus, the values of the biochemical indicators
for brain-specific changes deviated from the clinically normal
reference ranges. As HIF-1α expression increased, the deviation was
augmented.
In previous tumor studies (14–17),
the upregulation of miRNA-18a was found to downregulate the levels
of HIF-1α, inhibiting angiogenesis in tumor cells. In the current
study, the expression of HIF-1α was enhanced in the blood of
diabetes patients, while the levels of miRNA-18a were
downregulated; thus, the results were in accordance with the
previous studies. Furthermore, the biochemical indicators in the
blood, which reflect brain-specific changes, were also found to be
associated with HIF-1α expression.
In conclusion, the levels of the biochemical
indicators, HIF-1α expression and miRNA-18a have a fixed
association. Changes in the levels of miRNA-18a in the blood
indirectly reflect the status of cerebral injury and may be
significant in the diagnosis of cerebral injury. However, the
present study has certain limitations, including the small sample
size, regional differences of the patients, additional cerebral
injury factors other than HIF-1α (18–20)
and the numerous other miRNAs that regulate these factors. However,
miRNA-18a remains indicative of cerebral injury and may provide
novel insights for the prevention and treatment of diabetes-induced
cerebral injury.
Acknowledgements
The study was supported by The Fourth People’s
Hospital of Jinan. The authors thank Professor Wenruo Duan of
Qingdao Municipal Hospital, Professor Lingzhong Xu of Shandong
University and Professor Hongzhuan Li of The Fourth People’s
Hospital of Jinan for their assistance during the study.
References
|
1
|
Minagawa S, Hanyu O and Sone H: Stroke in
the elderly people with diabetes mellitus. Nihon Rinsho.
71:1948–1953. 2013.(In Japanese).
|
|
2
|
Palazzo P, Maggio P, Altavilla R, et al:
Cerebral hemodynamics and systemic endothelial function are already
impaired in well-controlled type 2 diabetic patients, with
short-term disease. PLoS One. 8:e832872013. View Article : Google Scholar : PubMed/NCBI
|
|
3
|
Mao X, Wang T, Liu Y, et al:
N-acetylcysteine and allopurinol confer synergy in attenuating
myocardial ischemia injury via restoring HIF-1α/HO-1 signaling in
diabetic rats. PLoS One. 8:e689492013.PubMed/NCBI
|
|
4
|
Ayala de la Peña F, Kanasaki K, Kanasaki
M, et al: Loss of p53 and acquisition of angiogenic microRNA
profile are insufficient to facilitate progression of bladder
urothelial carcinoma in situ to invasive carcinoma. J Biol Chem.
286:20778–20787. 2011.PubMed/NCBI
|
|
5
|
Luo F and Hu TH: Overexpression of miR-18a
suppresses tumor angiogenesis in colon cancer. Zhonghua Xian Dai Yi
Xue Za Zhi. 23:37–41. 2013.(In Chinese).
|
|
6
|
No authors listed. Report of the expert
committee on the diagnosis and classification of diabetes mellitus.
Diabetes Care. 20:1183–1197. 1997. View Article : Google Scholar : PubMed/NCBI
|
|
7
|
Chromy BA, Eldridge A, Forsberg JA, et al:
Wound outcome in combat injuries is associated with a unique set of
protein biomarkers. J Transl Med. 11:2812013. View Article : Google Scholar : PubMed/NCBI
|
|
8
|
Siddiqi SS, Gupta R, Aslam M, Hasan SA and
Khan SA: Type-2 diabetes mellitus and auditory brainstem response.
Indian J Endocrinol Metab. 17:1073–1077. 2013. View Article : Google Scholar : PubMed/NCBI
|
|
9
|
Foerch C, Singer OC, Neumann-Haefelin T,
et al: Evaluation of serum S100B as a surrogate marker for
long-term outcome and infarct volume in acute middle cerebral
artery infarction. Arch Neurol. 62:1130–1134. 2005.PubMed/NCBI
|
|
10
|
Wang SZ, Ma CC, Cao LL, Wei RY and Chi ZF:
Detection and significance of serum neuron-specific enolase in
elderly stroke patients. Zhongguo Lao Nian Xue Za Zhi. 26:410–411.
2006.(In Chinese).
|
|
11
|
Wunderlich MT, Wallesch CW and Goertler M:
Release of neurobiochemical markers of brain damage is related to
the neurovascular status on admission and the site of arterial
occlusion in acute ischemic stroke. J Neurol Sci. 227:49–53. 2004.
View Article : Google Scholar : PubMed/NCBI
|
|
12
|
Yanagisawa M, Kurihara H, Kimura S, Goto K
and Masaki T: A novel peptide vasoconstrictor, endothelin, is
produced by vascular endothelium and modulates smooth muscle
Ca2+ channels. J Hypertens Suppl. 6:S188–S191. 1988.
View Article : Google Scholar : PubMed/NCBI
|
|
13
|
Morfoisse F, Kuchnio A, Frainay C, et al:
Hypoxia induces VEGF-C expression in metastatic tumor cells via a
HIF-1α-independent translation-mediated mechanism. Cell Rep.
6:155–167. 2014.PubMed/NCBI
|
|
14
|
Grebhardt S, Veltkamp C, Ströbel P and
Mayer D: Hypoxia and HIF-1 increase S100A8 and S100A9 expression in
prostate cancer. Int J Cancer. 131:2785–2794. 2012. View Article : Google Scholar : PubMed/NCBI
|
|
15
|
Liang J, Qian Y, Xu D, et al: Serum tumor
markers, hypoxia-inducible factor-1α HIF-1α and vascular
endothelial growth factor, in patients with non-small cell lung
cancer before and after intervention. Asian Pac J Cancer Prev.
14:3851–3854. 2013.
|
|
16
|
Revet I, Feeney L, Tang AA, et al:
Dysmyelination not demyelination causes neurological symptoms in
preweaned mice in a murine model of Cockayne syndrome. Proc Natl
Acad Sci USA. 109:4627–4632. 2012. View Article : Google Scholar : PubMed/NCBI
|
|
17
|
Sagar SK, Zhang C, Guo Q, et al: Role of
expression of endothelin-1 and angiotensin-II and hypoxia-inducible
factor-1α in the kidney tissues of patients with diabetic
nephropathy. Saudi J Kidney Dis Transpl. 24:959–964. 2013.
|
|
18
|
Bertozzi D, Marinello J, Manzo SG, et al:
The natural inhibitor of DNA topoisomerase I, camptothecin,
modulates HIF-1α activity by changing miR expression patterns in
human cancer cells. Mol Cancer Ther. 13:239–248. 2014.PubMed/NCBI
|
|
19
|
Chai ZT, Kong J, Zhu XD, et al:
MicroRNA-26a inhibits angiogenesis by down-regulating VEGFA through
the PIK3C2α/Akt/HIF-1α pathway in hepatocellular carcinoma. PLoS
One. 8:e779572013.PubMed/NCBI
|
|
20
|
Lemaire J, Mkannez G, Guerfali FZ, et al:
MicroRNA expression profile in human macrophages in response to
Leishmania major infection. PLoS Negl Trop Dis. 7:e24782013.
View Article : Google Scholar : PubMed/NCBI
|