Introduction
The incidence and mortality rates of pancreatic
cancer are similar worldwide (1),
and the five-year survival rate of the condition is only 3%.
Furthermore, the incidence of early-onset pancreatic cancer is
increasing (2). As pancreatic
cancer is typically malignant and exhibits a rapid growth rate,
metastasis to the lymph nodes and blood occurs frequently, and this
is closely associated with the prognosis. Therefore, further study
of the potential molecular mechanisms underlying pancreatic cancer
cell invasion is of particular significance.
Protease-activated receptor 2 (PAR-2) is a type of G
protein-coupled receptor in the cell membrane. PAR-2 expression,
which is associated with tumor proliferation, invasion and
metastasis, is significantly higher in gastrointestinal cancers,
including esophageal, gastric, liver and colorectal, than that in
normal tissue cells (3–5). It has been shown that the PAR-2
receptor is expressed in pancreatic cancer tissue (1); however, whether the PAR-2 receptor
and its endogenous agonist trypsin is involved in pancreatic cancer
metastasis is unknown.
There are four PAR subtypes, known as PAR-1, -2, -3
and -4. Trypsin, tryptase, coagulation factors and other unknown
proteolytic enzymes are the natural receptor agonists. Synthetic
PAR-2 activation peptides, such as Ser-Leu-Ile-Gly-Arg-Leu, have
been widely used in PAR-2 tumor and inflammation research (6). The molecular mechanism study
underlying pancreatic cancer invasion and metastasis has become a
study focus domestically and abroad.
It has been established that the normal pancreatic
acinar and pancreatic cancer cells secrete trypsinogen. Trypsinogen
becomes trypsin following activation, and trypsin is a powerful
endogenous PAR-2 agonist. Soreide et al (7) showed that PAR-2 and trypsin promoted
colon cancer invasion and metastasis in association with matrix
metalloproteinases (MMPs), and indicated the intrinsic causes of
the high malignancy of pancreatic cancer. However, at present the
mechanism of PAR-2 in pancreatic cancer invasion and metastasis is
unclear. In the present study, the highly invasive and metastatic
human pancreatic cancer cell line SW1990 was utilized as the target
cells in an attempt to further elucidate the molecular mechanism
underlying the invasion and metastasis of pancreatic cancer.
In this study, the human pancreatic adenocarcinoma
cell line SW1990 was treated in vitro with the anti-PAR-2
agonist peptide (Val-Lys-Gly-Ile-Leu-Ser; VKGILS), trypsin or the
PAR-2 agonist (Ser-Leu-Ile-Gly-Lys-Val; SLIGKV). The effects of
such treatments on PAR-2 receptor expression levels were determined
by reverse transcription-polymerase chain reaction (RT-PCR) and
immunocytochemistry methodology. The effect of the activated PAR-2
receptor agonist on SW1990 cell invasion and metastasis was also
investigated for its possible use as a novel cancer drug candidate
for clinical application in the future.
Materials and methods
Materials
RPMI-1640 medium was purchased from Gibco-BRL (Grand
Island, NY, USA). Fetal bovine serum (FBS) was obtained from the
Institute of Hematology, Chinese Academy of Medical Sciences
(Tianjin, China). Polyclonal PAR-2 antibody was purchased from
Santa Cruz Biotechnology, Inc. (Santa Cruz, CA, USA). Streptomycin
avidin-peroxidase immunohistochemistry and diaminobenzidine (DAB)
color kits were obtained from Fuzhou Maixin Biotechnology
Development Co., Ltd. (Fuzhou, China). TRIzol® was
purchased from Invitrogen Life Technologies (Carlsbad, CA, USA).
PCR marker and RT-PCR kits were obtained from Dalian Bao Biological
Engineering Co. (Dalian, China). The PAR-2 agonist (SLIGKV) and
anti-PAR-2 agonist (VKGILS) peptides were synthesized by Meilian
(Xi’an) Biological Technology Co., Ltd. (Xi’an, China). Matrigel™
glue was purchased from BD Biosciences (Bedford, MA, USA). The
Transwell® chamber was purchased from Millipore
(Billerica, MA, USA). PAR-2, MMP-2 and MMP-9 primers were
synthesized by Invitrogen Life Technologies.
Cell culture and experimental
grouping
FBS RPMI-1640 complete medium with 100 ml/l FBS was
applied and the cells were incubated in a 50-ml/l CO2
incubator at 37°C with a relative humidity of 95%. When the cells
covered 70–80% of the bottle bottom, they were digested by 0.25%
trypsin and 0.03% EDTA. Cells in the logarithmic growth phase were
utilized for the subsequent experiments. In the MTT experiment,
there were four groups: Control (with medium only), trypsin (at
concentrations of 0.1, 1, 10 and 100 nM), SLIGKV (at concentrations
of 5, 25, 50 and 100 μM) and the VKGILS-NH2 group (at
concentrations of 5, 25, 50 and 100 μM). In the RT-PCR, cell
migration and invasion test and gelatin zymography experiment, the
cells were divided into the control, VKGILS-NH2 (50 μM),
trypsin (10 nM) and SLIGKV (50 μM) groups. Prior to treatment,
cells were cultured in serum-free RPMI-1640 for 24 h for cell cycle
synchronization. The present study was approved by the ethics
review board of the Logistics University of Chinese People’s Armed
Police Force (Tianjin, China).
Immunocytochemical detection
In each well of the six-well plate, 1×10⁵
cells were inoculated at 37°C for 24 h. When cell fusion reached
~60%, the coverslip was removed and the cells were fixed with
ice-cold methanol-acetone (1:1). Following the removal of
endogenous hydrogen peroxide enzyme by 3% hydrogen peroxide, the
cells were preserved in normal goat serum at room temperature for
10 min. The 1:100 diluted goat PAR-2 polyclonal antibody was added
(replaced with phosphate-buffered saline in the negative control)
and the cells were incubated overnight at 4°C. The biotin-labeled
secondary antibody was then added and the solution was incubated at
37°C for 10 min. Following incubation, horseradish
peroxidase-labeled streptomycin avidin complex was added and the
cells were further incubated for 10 min at 37°C, prior to
coloration by DAB and hematoxylin. The cells were observed under
the microscope (Olympus CK-2; Olympus Corporation, Tokyo, Japan)
and images were captured.
RT-PCR
Total RNA was extracted from the SW1990 cells by
TRIzol reagent. The integrity of RNA was identified by
electrophoresis of 1% agarose gel (the ratio of 28S and 18S RNA
band was ≥2). Total RNA (1 μg) was reverse transcribed in the
following conditions: 10 min at 30°C, 30 min at 42°C, 5 min at 99°C
and 5 min at 5°C. β-actin was used as the internal control. The
primers used in this study are provided in Table I. Following the electrophoresis of
2% agarose gel, PCR products were scanned by the gel automatic
imaging system. Relative value analysis was determined by β-actin
correction and the value was expressed as the ratio of the
absorbance of the detected band to the absorbance of the β-actin
band.
 | Table IPrimers used in this study. |
Table I
Primers used in this study.
| Primer | Sequence | Product (bp) |
|---|
| PAR-2_FP |
5′-AGAAGCCTTATTGGTAAGGTT-3′ | 582 |
| PAR-2_RP |
5′-AACATCATGACAGGTCGTGAT-3′ |
| MMP-2_FP |
5′-CAGGCTCTTCTCCTTTCACAAC-3′ | 398 |
| MMP-2_RP |
5′-AAGCCACGGCTTGGTTTTCCTC-3′ |
| MMP-9_FP |
5′-TCCCCTACGTCACCTATGACAT-3′ | 172 |
| MMP-9_RP |
5′-GCCCAGCCCACCTCCACTCCTC-3′ |
| β-actin_FP |
5′-TGTTTGAGACCTTCAACACCC-3′ | 540 |
| β-actin_RP |
5′-AGCACTGTGTTGGCGTACAGG-3′ |
MTT assay
The cell suspension was incubated in a 96-well plate
with a density of 6×10⁴/ml. Following culture at 37°C
for 24 h, the medium was replaced with serum-free medium and cell
suspension was continued to culture for 24 h. The suspension was
dosed according to each group with eight wells, respectively. A
total of 20 μl MTT solution (5 g/l) was added in each well after 48
h of culture. Four hours later, the culture was terminated and the
culture medium was removed. A total of 150 μl dimethyl sulfoxide
was added to each well, prior to oscillation for 30 min at room
temperature for the crystals to dissolve. An absorbance value for
each well at 490 nm wavelength was determined by the enzyme mark
instrument (Model 550; Bio-Rad Laboratories Inc., Hercules, CA,
USA). This experiment was repeated three times.
Cell migration and invasion assay
The method for the cell migration and invasion assay
was performed according to that described previously for the
Albini’s chamber test (8) with
certain modifications. Briefly, SW1990 cells in the logarithmic
growth phase were preserved in serum-free RPMI-1640 medium for 24
h. Following digestion by 0.04% EDTA, the single-cell suspension
was made by serum-free RPMI 1640 medium. The cell concentration was
adjusted to 2.5×10⁵/ml and cell viability was detected
by trypan blue staining. Cell suspension (0.2 ml) was added to each
upper chamber of the Millicell® chamber room, and drugs
were added according to the experimental group with three wells in
each group. In the lower chamber, 600 μl cell culture medium
RPMI-1640 containing 10% fetal calf serum was added in each hole.
The suspension was cultured in the culture box for 24 h, and the
microporous membrane was removed. Cells that did not enter the
membrane were wiped by a cotton ball, and the remaining cells were
fixed and stained by methanol and hematoxylin. The number of cells
through the membrane was counted in five high-power fields
(magnification, ×400) under the microscope, and the average number
was calculated. In the cell invasion assay, the Matrigel matrix gel
was melted at 4°C in advance. Each microcellular polycarbonate
membrane surface was paved with 40 μl diluted Matrigel glue ratio
of Matrigel and serum-free medium, 1:4). The cells were solidified
into the culture box for 4 h and cell concentration was adjusted to
1×10⁵/ml. The remaining steps were the same as those for
the migration test.
Gelatin zymography
Total cellular protein was extracted using protein
extraction reagent [50 mM Tris (pH 8.0), 1% NP-40, 0.1% sodium
dodecyl sulfate, 0.02% sodium azide, 150 mM sodium chloride and
0.5% phenylmethylsulfonyl fluoride]. Sample protein content was
determined and adjusted using the Bicinchoninic Acid Protein
Quantitation kit (Beyotime Institute of Biotechnology, Haimen,
China) and electrophoresed by 10% polyacrylamide gel
electrophoresis gel containing 1 g/l gelatin. The sample was
agitated and washed in the eluent (2.5% Triton X-100, 50 mM
Tris-HCl, 5 mM CaCl2 and 1 μM ZnCl2, pH 7.0)
at room temperature for 15 min three times and then incubated at
37°C overnight in gelatinase buffer [50 mM Tris-HCl (pH 7.4), 200
mM NaCl and 5 mM CaCl2). The protein was fixed and
stained for 30 min respectively in 1 g/l Coomassie brilliant blue
(concentration ratio of acetic acid:methanol:water, 1:4:5) at room
temperature. The protein was destained by eluent excluding
Coomassie brilliant blue and a clear strip appeared. The active
sites of the protease were bright and transparent. Strip area,
width and gray value was detected by a gel automatic imaging system
(GDS-8000; Ultra Violet Products Inc., Upland, CA, USA), and the
relative value of MMP-2 and MMP-9 was calculated based on the gray
values of the deeply-stained proteins.
Statistical analysis
Statistical analysis was performed using SPSS 13.0
statistical software (SPSS, Inc., Chicago, IL, USA). Measurement
data are expressed as the mean ± standard deviation. Comparisons
between groups were conducted using the Student’s t-test or
Wilcoxon rank sum test. P<0.05 was considered to indicate a
statistically significant difference, and P<0.01 was considered
to indicate a highly significant difference.
Results
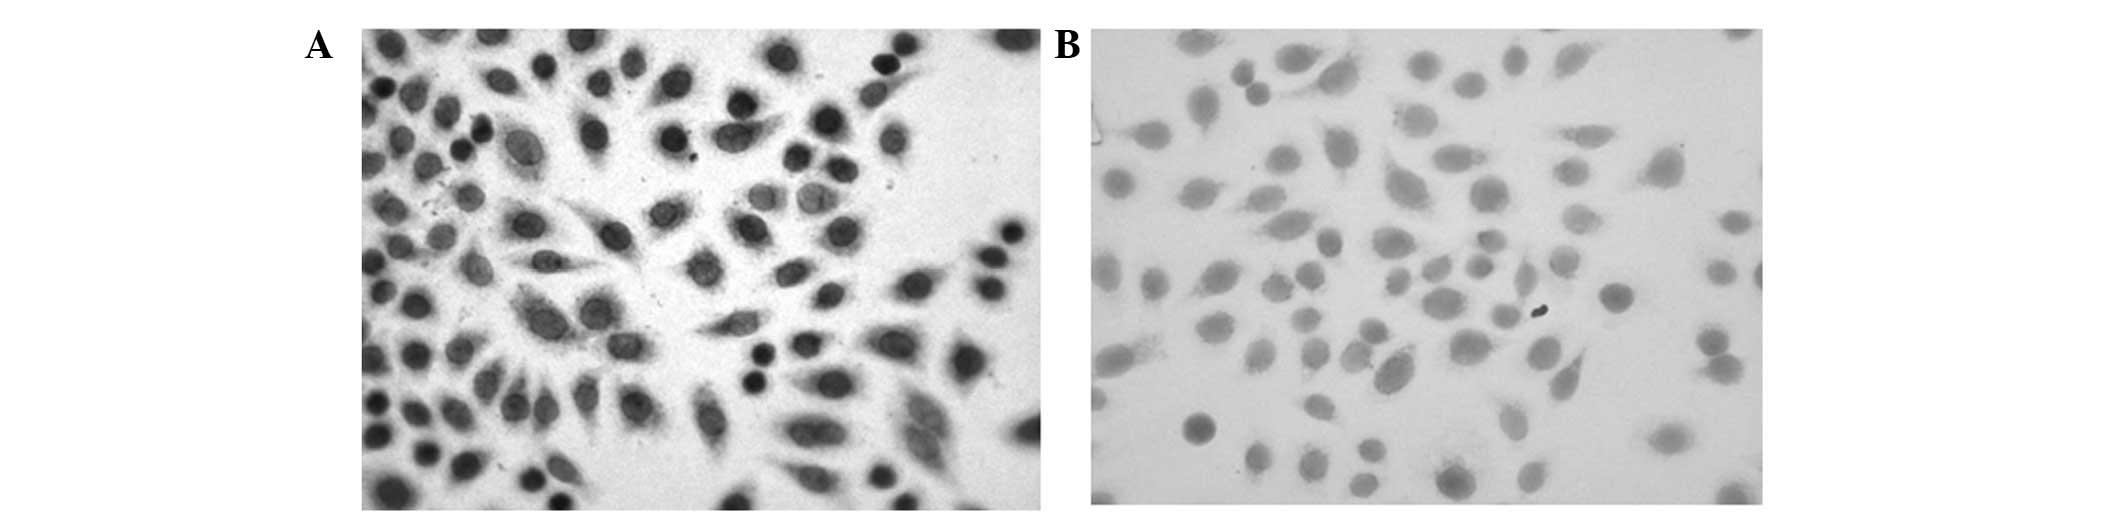
PAR-2 protein is expressed mainly in the
cell membrane and cytoplasm of SW1990 cells
To investigate the expression of PAR-2 protein in
SW1990 cells, immunocytochemical detection was performed. As shown
in Fig. 1, PAR-2 protein
expression, shown by brown-yellow staining, was observed
predominantly in the cell membrane and cytoplasm. In the negative
control group, the cell membrane and cytoplasm were not stained.
These results showed that PAR-2 is expressed mainly in the cell
membrane and cytoplasm of SW1990 cells.
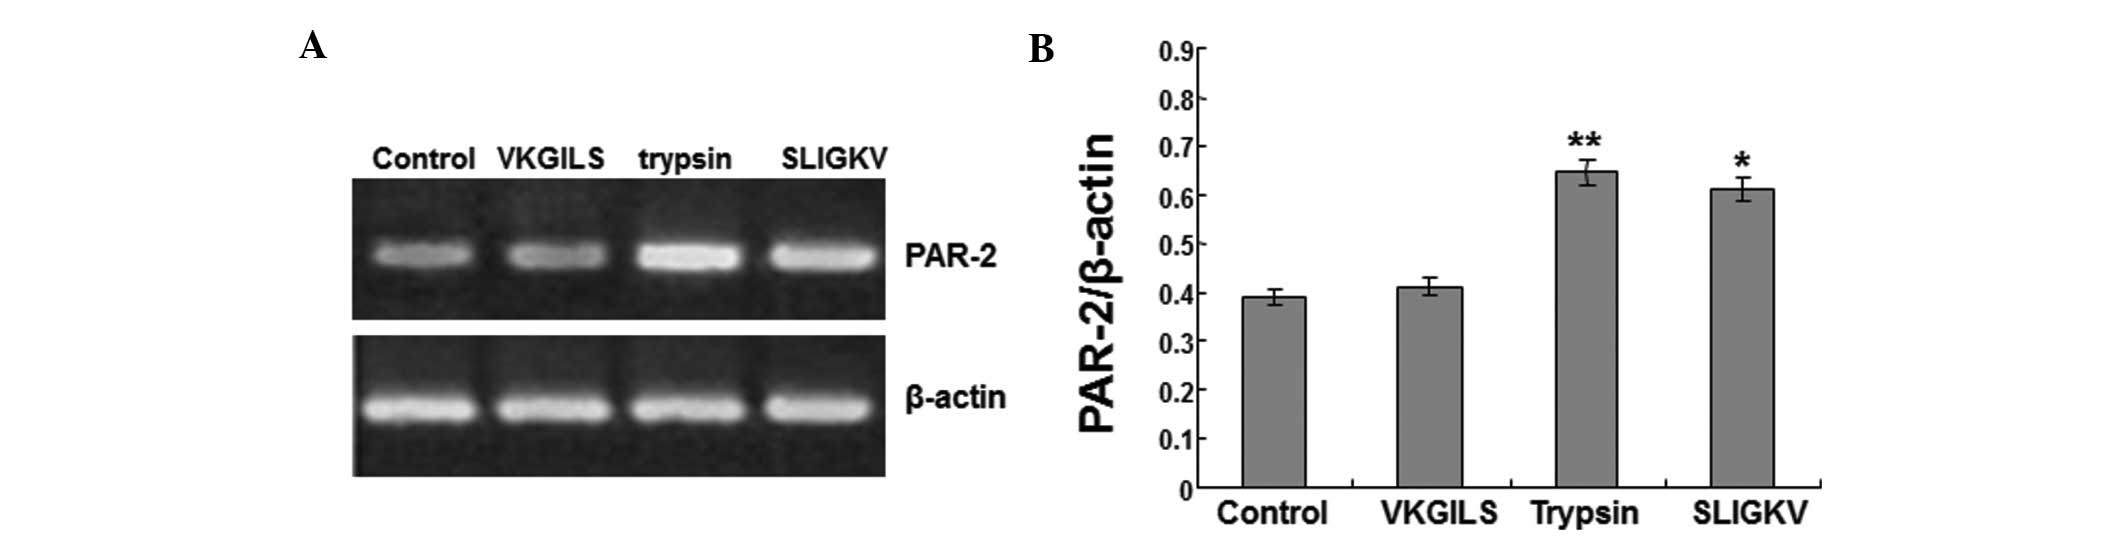
SLIGKV and trypsin increase PAR-2 mRNA
expression in SW1990 cells
The anti-PAR-2 agonist peptide (VKGILS) and the
PAR-2 agonist (SLIGKV) were used in this study. The cells were
treated with VKGILS-NH2 (50 μM), SLIGKV (50 μM) or
trypsin (10 nM) for 18 h, or were left untreated (medium only). To
investigate the effects of the treatments on the expression of
PAR-2 mRNA in SW1990 cells, RT-PCR was performed. β-actin served as
the internal control.
As shown in Fig. 2A and
B, the PAR-2 mRNA expression level in the VKGILS group
(0.412±0.036) was similar to that in the control group
(0.391±0.022). No significant difference in expression was
identified between the control and VKGILS groups. However, in the
trypsin and SLIGKV groups, PAR-2 mRNA expression levels were
increased to 0.645±0.038 and 0.612±0.042, respectively, and were
significantly higher than the PAR-2 mRNA levels in the control
group (0.391±0.022) (P<0.05). Therefore, these results suggest
that SLIGKV and trypsin treatments increase PAR-2 mRNA expression
in SW1990 cells.
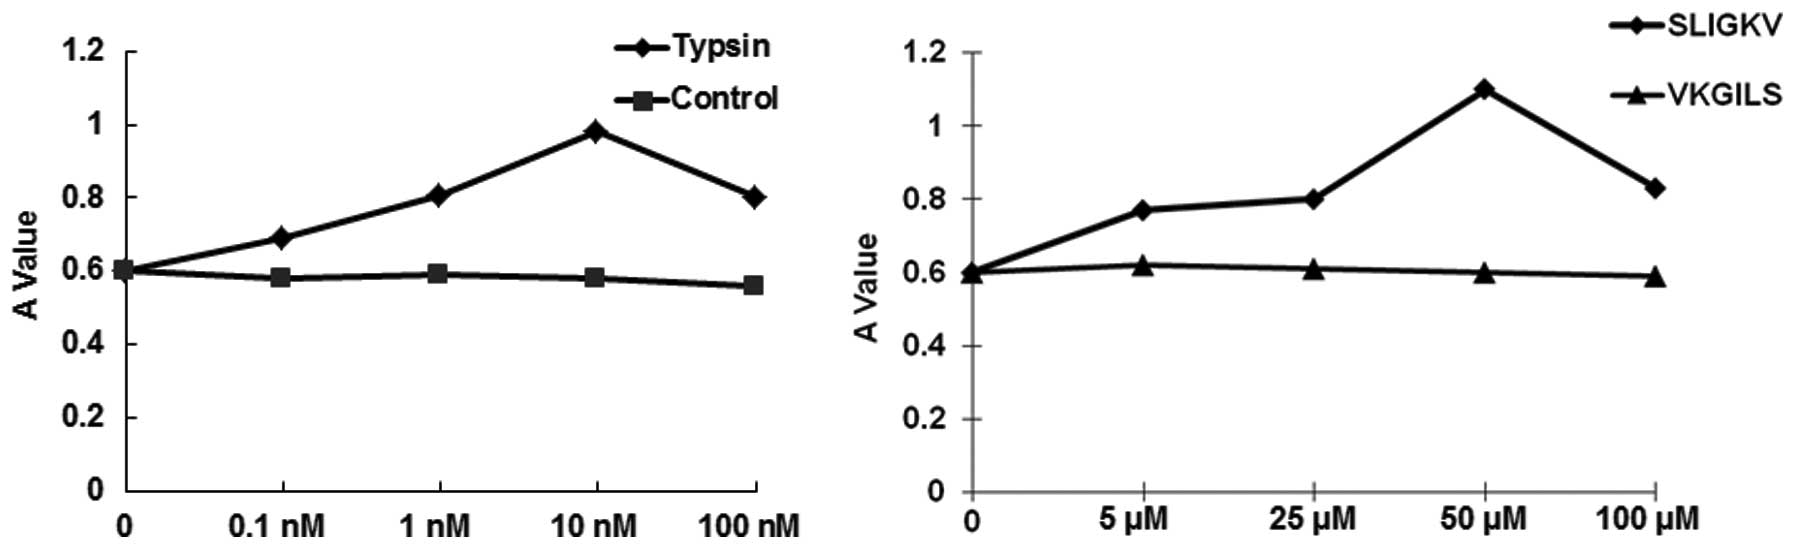
Trypsin and SLIGKV increase SW1990 cell
proliferation
To determine if treatment with VKGILS, trypsin or
SLIGKV affected SW1990 cell proliferation, the MTT assay was
performed. As shown in Fig. 3,
VKGILS slightly affected cell proliferation, without a significant
difference when compared with the control group (P>0.05).
However, trypsin and SLIGKV increased the proliferation of
pancreatic cancer SW1990 cells in a concentration-dependent manner
when compared with the control group (P<0.05). Treatments with
high concentrations of trypsin (100 nM) and SLIGKV (100 μM) were
harmful to cell proliferation, as expected. These results suggest
that trypsin and SLIGKV increase SW1990 cell proliferation.
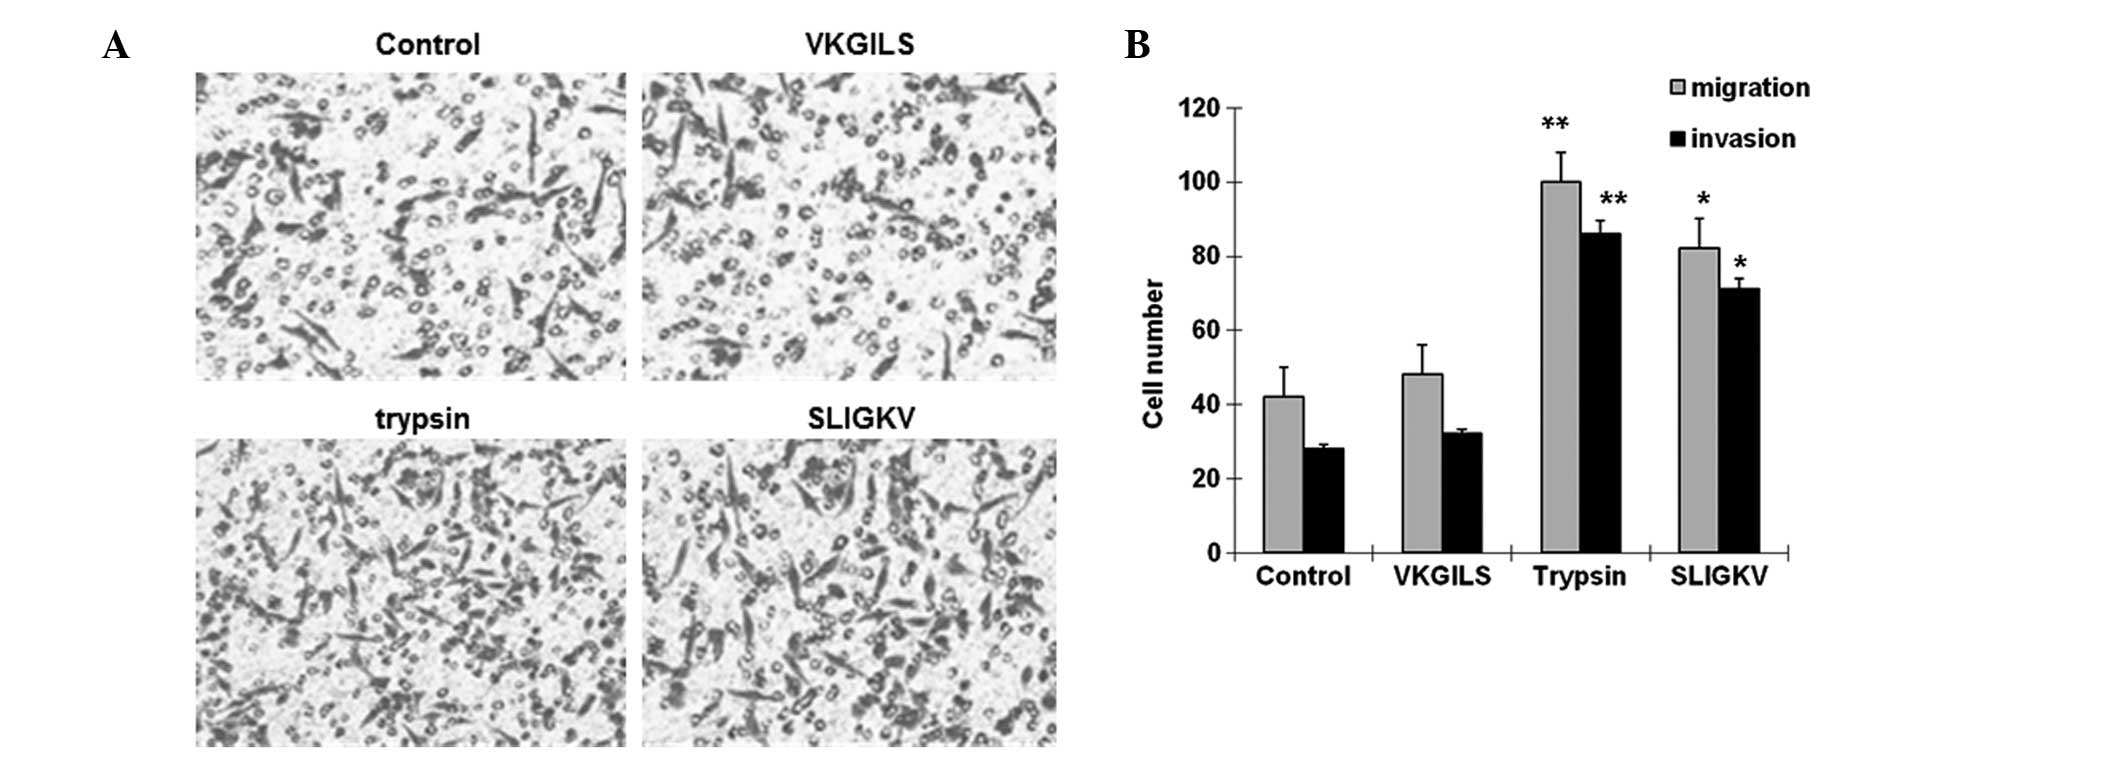
SW1990 cell invasion and migration are
increased by trypsin or SLIGKV
To determine if treatment with VKGILS, trypsin or
SLIGKV affected the invasion and migration of SW1990 cells, the
cells were treated with VKGILS (50 μM), SLIGKV (50 μM) or trypsin
(10 nM) for 24 h, or left untreated (medium only). Cell migration
and invasion assays were subsequently performed. As shown in
Fig. 4A and B, in these cell
migration tests, SW1990 cells disrupted the Matrigel matrix. The
number of cells penetrating the microporous membranes in the
trypsin (100.8±12.9) and SLIGKV (89.6±10.9) groups was
significantly higher than the number in the control (43.3±9.2) and
the VKGILS (50.1±7.5) groups. In the invasion tests, SW1990 cells
degraded the Matrigel matrix. The number of cells that penetrated
the microporous membrane in the trypsin (81.5±8.1) and SLIGKV
(71.7±5.2) groups was significantly higher than the number in the
control (28.3±5.6) and the VKGILS (32.2±7.8) groups. These results
suggest that SW1990 cell invasion and migration were increased by
trypsin or SLIGKV when compared with the control and VKGILS
treatments.
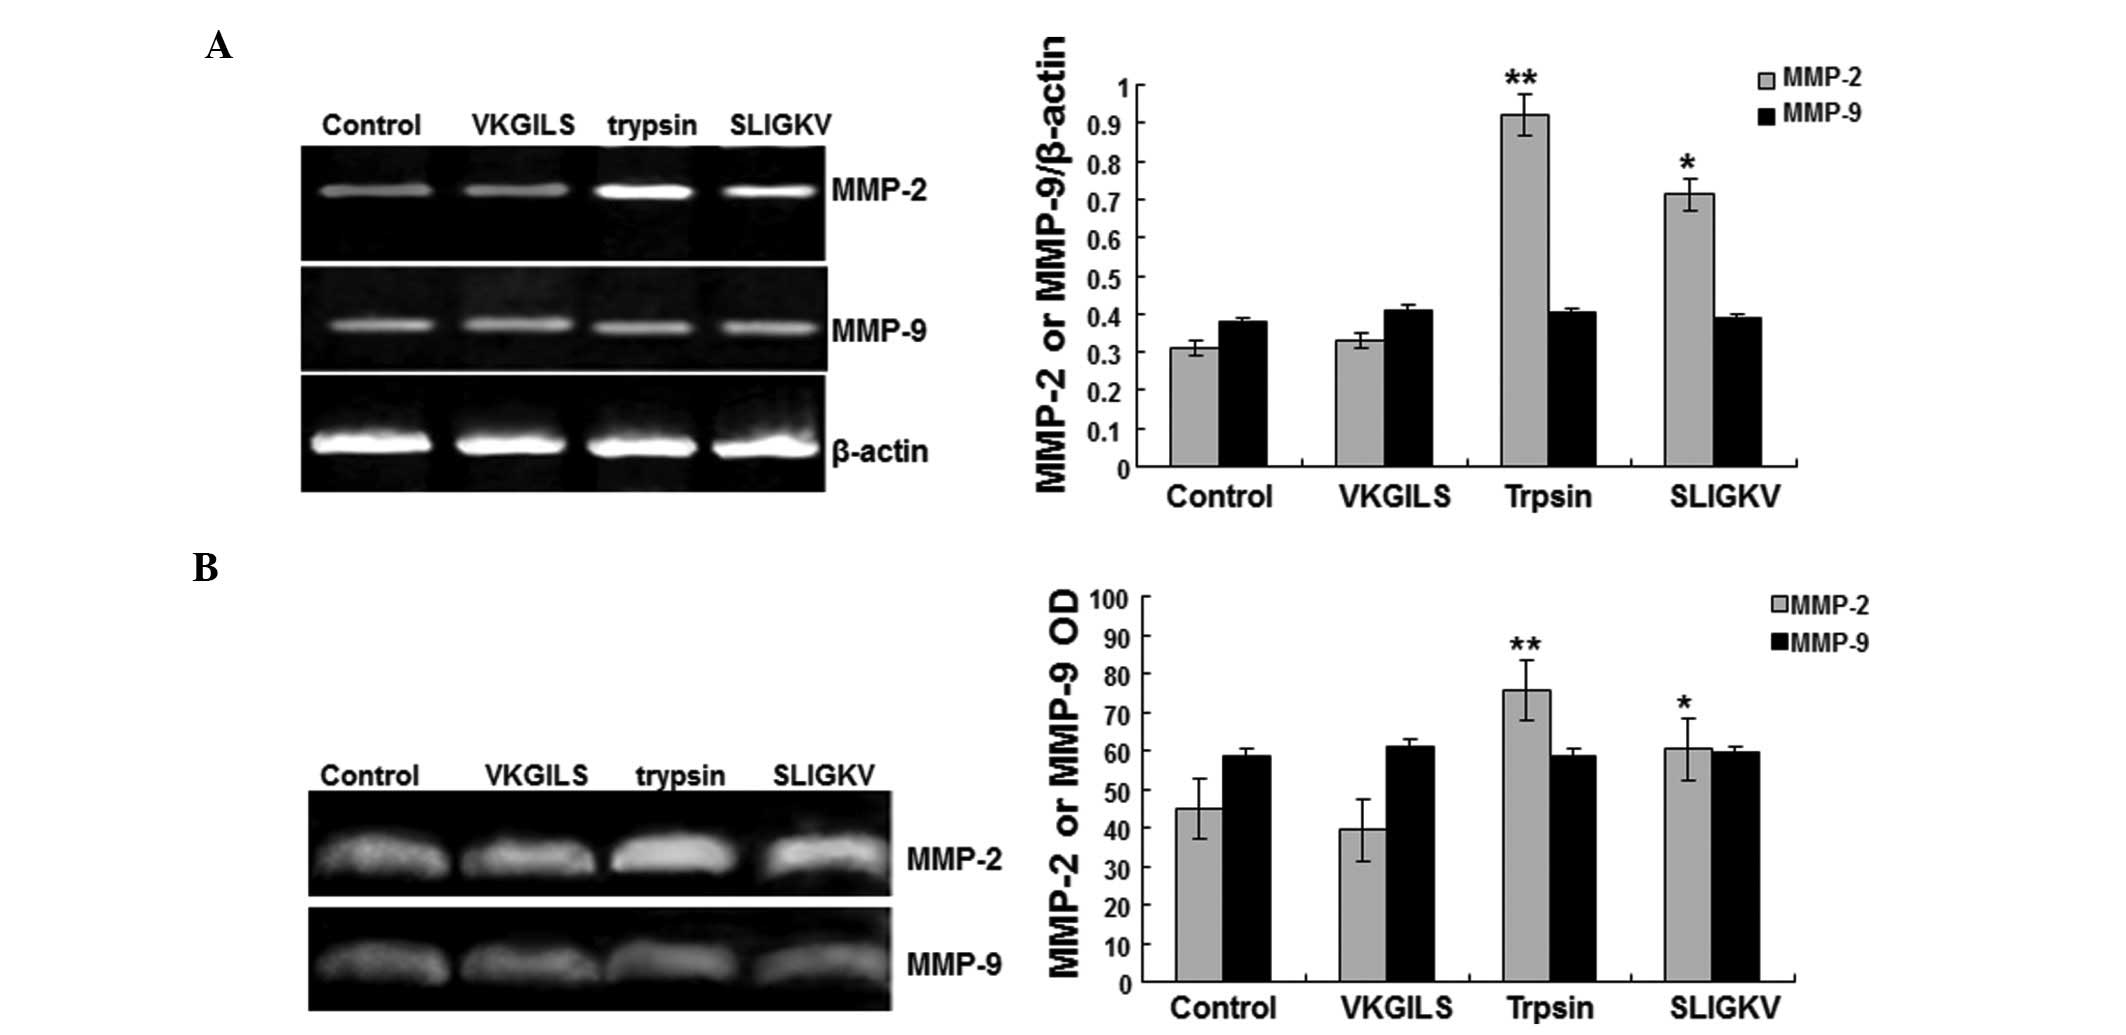
Changes in mRNA expression and enzymatic
activity of MMP-2 and MMP-9
To investigate the mechanisms underlying the effects
of trypsin or SLIGKV on SW1990 cell invasion and migration, the
cells were treated with VKGILS (50 μM), trypsin (10 nM) or SLIGKV
(50 μM) for 24 h, or were left untreated (medium only). The mRNA
expression and enzymatic activity changes of MMP-2 and MMP-9 were
determined.
The RT-PCR results (Fig. 5A) showed that VKGILS had no
detectable effects on MMP-2 and MMP-9 mRNA levels when compared
with the control group. However, the MMP-2 mRNA levels in the
trypsin (0.921±0.032) and the SLIGKV (0.712±0.024) groups were
significantly higher than those in the control (0.310±0.038) and
VKGILS (0.378±0.029) groups. No significant differences were
identified in the MMP-9 mRNA levels among the four groups
(P>0.05) (Fig. 5A). These
results suggest that trypsin and SLIGKV increase the expression
levels of MMP-2, but not MMP-9.
Gelatin zymography results (Fig. 5B) showed that MMP-2 enzyme activity
in the trypsin (75.6±6.1) and SLIGKV (60.4±4.6) groups was
significantly higher than that in the control (44.9±4.2) and VKGILS
(39.3±5.2) groups. The MMP-9 enzyme activity was not significantly
changed (Fig. 5B). These results
suggest that trypsin and SLIGKV increase the activity of MMP-2, but
not MMP-9.
Discussion
In this study, through immunocytochemistry and
RT-PCR, it was found that PAR-2 is expressed at the gene and
protein levels in the human pancreatic cancer cell line SW1990. In
the trypsin and synthetic PAR-2 agonist peptide SLIGKV groups, the
PAR-2 mRNA expression level was increased compared with that in the
control and inverse agonist peptide groups. This indicated that
PAR-2 was present in the human pancreatic cancer cell SW1990 and
that its expression increased following activation. In addition,
the results suggested that the PAR-2 agonists activated and
upregulated PAR-2 levels, thus promoting cancer cell proliferation,
suggesting that PAR-2 activation may be crucial in the development
of pancreatic cancer. At certain concentrations and time ranges,
trypsin and the PAR-2 agonist SLIGKV were found to significantly
promote SW1990 proliferation in a concentration- and time-dependent
manner. This is consistent with the theory that PAR-2 promotes
colon, gastric, breast, liver, esophageal and lung cancer cell
proliferation (9). It is suggested
that this cell proliferation is associated with the MMP-epidermal
growth factor receptor-mitogen-activated protein
kinase-extracellular signal-regulated kinase 1/2
(MMP-EGFR-MAPK-ERK1/2) pathway, and that PAR-2 promoted colon and
gastric cancer cell proliferation and invasion through the
MMP-EGFR-MAPK-ERK1/2 pathway following activation. It is
additionally suggested that PAR-2 activated the Ca2+
channel through the activation of the MAPK-ERK1/2 pathway to
promote prostaglandin E2 release, and then activated EGFR to
promote cell proliferation (3–5,10).
It can be inferred that PAR-2 may also promote cancer cell
proliferation subsequent to activation through the above
pathway.
Invasion and metastasis are characteristic of
malignant tumors. Two key steps are involved in metastasis: The
degradation of the basement membrane and extracellular matrix,
which allows breakthrough into the blood circulation or target
organ and new vessel formation subsequent to entering the target
organs so that metastatic lesions can increase rapidly (11,12).
The damage to the integrity of the basal cell membrane is the
important sign for malignant tumor invasion. In this preliminary
study, it was investigated whether the activation of PAR-2 promotes
pancreatic cancer invasion and metastasis in these two key steps.
The Transwell chamber was applied to stimulate the extracellular
matrix microenvironment, and the effect of PAR-2 activation on the
invasion and migration of the pancreatic cancer cell SW1990 was
observed. It was found that trypsin and the PAR-2 activating
peptide significantly enhanced SW1990 pancreatic cancer cell
invasion and migration, showing that PAR-2 activation is associated
with pancreatic cancer invasion. Furthermore, it was found that the
invasion and migration of SW1990 cells was higher in the trypsin
group than that in SLIGKV group. This was consistent with the
above-mentioned previous studies showing that trypsin promotes
colon cancer invasion and metastasis through its close association
with MMPs, and that trypsin can also be activated by PAR-2.
Soreide et al (7) showed that colon cancer metastasis is
closely associated with the MMP family. MMP-2 and MMP-9 are the key
members of the MMP family, and they are closely associated with
tumor metastasis since they can degrade the extracellular matrix
and disrupt the basement membrane. The association between MMPs and
pancreatic cancer metastasis has become a study focus. Bramhall
et al (13) found through
the immunohistochemical method that the expression level of MMP-2
was significantly higher in pancreatic cancer tissue than that in
other tissues, and MMP-2 expression was significantly higher in
tumor cells than that in interstitial cells. Koshiba et al
(14) further showed through
gelatin zymography and western blot analysis that MMP-2 was
associated with pancreatic cancer progression. MMP-2 protein
expression in pancreatic carcinoma specimens with distant and lymph
node metastasis was significantly higher than that in specimens
without metastasis, indicating that MMP-2 level is associated with
pancreatic adenocarcinoma invasion, metastasis and prognosis. In
the present study, the effects of PAR-2 activation on the gene
expression and gelatinase activity of MMP-2 and MMP-9 were
determined through RT-PCR and gelatin zymography assay. It was
found that, in the trypsin and PAR-2 agonist groups, MMP-2 mRNA
level and gelatinase activity were increased, which was consistent
with the aforementioned study findings. However, there was no clear
association between the gene expression and gelatinase activity of
MMP-2 following PAR-2 activation. It has been shown that tumor
necrosis factor-α induces MMP expression through MAPK signaling
system-mediated nuclear factor-κB activation (15), and PAR-2 promotes numerous types of
tumor cell proliferation through the MAPK signaling pathways
(16). Therefore, it is
hypothesized that PAR-2-induced MMP-2 generation may also share
this pathway; this will be a further study focus.
In conclusion, in this study it was found that PAR-2
expressed in the pancreatic cancer cell line SW1990 exhibits an
important function in SW1990 cell proliferation and invasion
following its activation. Its mechanism may be associated with the
PAR-2/MMP-2 pathways. Thus this pathway may be an important target
for the prevention and treatment of pancreatic cancer. Further
studies of the dynamic expression of PAR-2 and tumor metastasis and
the associated signal transduction pathways are required.
References
|
1
|
Yada K, Shibata K, Matsumoto T, Ohta M,
Yokoyama S and Kitano S: Protease-activated receptor-2 regulates
cell proliferation and enhances cyclooxygenase-2 mRNA expression in
human pancreatic cancer cells. J Surg Oncol. 89:79–85. 2005.
View Article : Google Scholar : PubMed/NCBI
|
|
2
|
Xu Y, Liu Z and Guo K: Inhibition of JDP2
to epithelial-to-mesenchymal transition of the TGF-β1-induced
pancreatic cancer cell line Panc-1. World J Gastroenterol.
19:2931–2936. 2011.
|
|
3
|
Zheng YM, Xie LQ, Zhao JY, et al: Effect
of protease activated receptor-2 agonists on proliferation of
hepatoma cells. Zhonghua Gan Zang Bing Za Zhi. 17:701–702. 2009.(In
Chinese). PubMed/NCBI
|
|
4
|
Zhou J, Xie L, Li X, et al: Promotion of
protease-activated receptor 2 agonists on cell invasion and
metastasis of esophageal cancer cell EC109. Shi Jie Hua Ren Xiao
Hua Za Zhi. 18:1313–1319. 2010.
|
|
5
|
Chen HT, Tsou HK, Tsai CH, et al: Thrombin
enhanced migration and MMPs expression of human chondrosarcoma
cells involves PAR receptor signaling pathway. J Cell Physiol.
223:737–745. 2010.PubMed/NCBI
|
|
6
|
Kirkland JG, Cottrell GS, Bunnett NW and
Corvera CU: Agonists of protease-activated receptors 1 and 2
stimulate electrolyte secretion from mouse gallbladder. Am J
Physiol Gastrointest Liver Physiol. 293:G335–G346. 2007. View Article : Google Scholar : PubMed/NCBI
|
|
7
|
Soreide K, Janssen EA, Körner H and Baak
JP: Trypsin in colorectal cancer: molecular biological mechanisms
of proliferation, invasion, and metastasis. J Pathol. 209:147–156.
2006. View Article : Google Scholar : PubMed/NCBI
|
|
8
|
Albini A, et al: A rapid in vitro assay
for quantitating the invasive potential of tumor cells. Cancer Res.
47:3239–3245. 1987.PubMed/NCBI
|
|
9
|
Nishibori M, Mori S and Takahashi HK:
Physiology and pathophysiology of proteinase-activated receptors
(PARs): PAR-2-mediated proliferation of colon cancer cell. J
Pharmacol Sci. 97:25–30. 2005. View Article : Google Scholar : PubMed/NCBI
|
|
10
|
Kaufmann R, Oettel C, Horn A, et al: Met
receptor tyrosine kinase transactivation is involved in
proteinase-activated receptor-2-mediated hepatocellular carcinoma
cell invasion. Carcinogenesis. 30:1487–1496. 2009. View Article : Google Scholar : PubMed/NCBI
|
|
11
|
Hofmann UB, Westphal JR, et al: Expression
and activation of matrix metalloproteinase-2 (MMP-2) and its
co-localization with membrane-type 1 matrix metalloproteinase
(MT1-MMP) correlate with melanoma progression. J Pathol.
191:245–256. 2000. View Article : Google Scholar : PubMed/NCBI
|
|
12
|
Jung JY, Kim HS, Roh MR, Roh HJ, Lee SY
and Chung KY: The effect of imiquimod on matrix metalloproteinases
and tissue inhibitors of metalloproteinases in malignant melanoma
cell invasion. Ann Dermatol. 26:363–373. 2014. View Article : Google Scholar : PubMed/NCBI
|
|
13
|
Bramhall SR, Stamp GW, Dunn J, Lemoine NR
and Neoptolemos JP: Expression of collagenase (MMP2), stromelysin
(MMP3) and tissue inhibitor of the metalloproteinases (TIMP1) in
pancreatic and ampullary disease. Br J Cancer. 73:972–978. 1996.
View Article : Google Scholar : PubMed/NCBI
|
|
14
|
Koshiba T, Hosotani R, Wada M, et al:
Involvement of matrix metallproteinase-2 activity in invasion and
metastasis of pancreatic carcinoma. Cancer. 82:642–650. 1998.
View Article : Google Scholar : PubMed/NCBI
|
|
15
|
Suh SJ, Kwak CH, Chung TW, et al: Pimaric
acid from Aralia cordata has an inhibitory effect on TNF-α-induced
MMP-9 production and HASMC migration via down-regulated NF-κB and
AP-1. Chem Biol Interact. 199:112–119. 2012. View Article : Google Scholar : PubMed/NCBI
|
|
16
|
Han S, Lee CW, Trevino JG, Hughes SJ and
Sarosi GA Jr: Autocrine extra-pancreatic trypsin 3 secretion
promotes cell proliferation and survival in esophageal
adenocarcinoma. PLoS One. 8:e766672013. View Article : Google Scholar : PubMed/NCBI
|