Introduction
In 2010, 285 million individuals were estimated to
have been diagnosed with diabetes mellitus worldwide, a prevalence
of 6.4%, which is predicted to increase to 439 million (7.7%) by
2030 (1). The mortality rate of
diabetes mellitus, including indirect mortalities, is estimated to
be ∼3.96 million per year for all age groups, which is a prevalence
of 6.8% (2). Type 2 diabetes
mellitus (T2DM) accounts for ∼90% of diabetes cases worldwide
(1). T2DM has been described as a
ʻsilent diseaseʼ (3) and is
characterized by a combination of inadequate insulin secretion due
to islet β cell deterioration and insulin resistance (IR) (3). Interruption of pancreatic β cell
function and insulin activity characterizes T2DM, resulting in
symptoms which include dyslipidemia, hyperglycemia, hypertension
and atherosclerosis, which subsequently contribute to reduced
insulin sensitivity (4).
T2DM is associated with IR, which induces a range of
detrimental effects in various organs and tissues. The impact of IR
on the central nervous system (CNS) may lead to obesity, as the
appetite may be enhanced as a result of the activity of insulin in
the CNS (5). In adipose tissue, IR
causes hyperlipidemia. Under normal conditions, insulin promotes
adipocyte differentiation and glucose uptake, while inhibiting
lipolysis in adipocytes. Furthermore, adipose tissue is able to
function as an endocrine organ by releasing cytokines and hormones,
a function which is disrupted by fat expansion, thus promoting IR
(6). In pancreatic tissue, IR
impairs β cell regeneration (7).
However, whether insulin has a direct autocrine function on β cells
in promoting insulin secretion is yet to be fully elucidated
(8).
Jung et al (9)
identified a novel hepatokine secreted by the liver, named
fetuin-A, which was found to be associated with obesity, IR and
non-alcoholic fatty liver disease. Fetuin-A affects insulin signal
transduction by inhibiting the activity of the insulin receptor
tyrosine kinase in the liver and skeletal muscle, in addition to
mitigating insulin receptor autophosphorylation in vitro and
in vivo, subsequently resulting in IR (10). An additional novel biological marker
that can function as a reliable indicator of IR is retinol binding
protein-4 (RBP-4). RBP-4 may serve crucial functions in the
development of IR and atherosclerosis in T2DM patients with
coronary artery disease. Further study of these marker proteins and
peptides may aid in the diagnosis and alleviation of IR (11). Perilipins are a family of proteins
that target the surfaces of lipid droplets to regulate lipid
storage and hydrolysis. A previous study investigating perilipin
activity indicated the physiological function of cytosolic lipid
droplets and their association with obesity-associated diseases,
such as IR (12).
Metformin hydrochloride is one of the most commonly
used treatments for T2DM. Metformin improves insulin sensitivity,
reduces gluconeogenesis, promotes glucose uptake and reduces
glucose production in the liver (13,14). In
combination with lifestyle modifications, metformin is the primary
glucose-lowering agent used in the treatment of T2DM, due to its
efficacy, safety and beneficial cardiovascular and metabolic
activity (15,16). Notably, metformin exerts pleiotropic
effects in a number of tissues that are affected by IR and
hyperinsulinemia, such as skeletal muscles, adipose tissue and the
endothelium (17). Although
metformin has been used in clinical practice for >40 years, the
exact underlying mechanism of action is yet to be fully elucidated
(18).
The present study investigated the effects of
metformin on dyslipidemia and the expression of genes associated
with lipid metabolism in T2DM rats. The effects of metformin were
assessed at a molecular and immunohistopathological level.
Materials and methods
Reagents
Streptozotocin (STZ) and metformin were purchased
from Sigma-Aldrich (St. Louis, MO, USA). Wistar albino rats were
purchased from Egyptian Co. for Experimental Animals Production
(Helwan, Egypt). Solvents and associated reagents were purchased
from ADWIA Pharmaceuticals (Obour City, Egypt). The high-fat diet
(HFD) was purchased from Qaha Co. for Food Production (Qaha,
Egypt). Biochemical kits to assess the lipids profiles were
obtained from Clini Lab (Heliopolis, Egypt).
Induction of T2DM and experimental
design
In total, 30 male Wistar rats (age, 4 weeks; weight,
80–100 g) were selected at random. The rats were exposed to a 12-h
day/night cycle, with free access to food and water. The present
study was approved by the Ethics Committee on Animal Care of Taif
University (Taif, Saudi Arabia; project no. #3103/1435/1). Rats
were divided into three groups (n=10 per group). Control group rats
received a normal diet. In order to induce IR and T2DM, the
remaining 20 rats received a HFD for 4 weeks, which consisted of
15.5% protein, 38.8% fat and 45.7% carbohydrates, by calories.
Induction of T2DM in the HFD-fed rats was based on the protocol
outlined by Srinivasan et al (19), which comprised an intraperitoneal
injection of STZ (35 mg/kg body weight), followed by administration
of the HFD for 4 weeks. T2DM was confirmed after 1 week, as serum
glucose levels and lipid profiles were increased. The T2DM rats
(n=20) were subsequently divided into two subgroups, namely the
T2DM group (n=10) and the T2DM + metformin group (n=10), in which
metformin (400 mg/kg/day) was administered for 4 weeks.
Following the experimental procedures, all rats were
decapitated following inhalation of diethyl ether and after
overnight fasting and blood samples were collected for serum
extraction and serum chemistry analysis. In addition, liver and
adipose tissues were maintained in TRIzol reagent (Invitrogen Life
Technologies, Carlsbad, CA, USA) for RNA extraction and
semi-quantitative reverse transcription-polymerase chain reaction
(RT-PCR) analysis of gene expression.
Serum chemistry analysis
Levels of serum triglycerides (TG), total
cholesterol (TC), low-density lipoproteins (LDLs), very low-density
lipoproteins (VLDLs) and high-density lipoproteins (HDLs) were
measured using commercial spectrophotometric analysis kits. Insulin
and glucose levels were measured using spectrophotometric
commercial kits. All the kits were purchased from Bio-Diagnostic
Company (Giza, Egypt).
cDNA synthesis, semi-quantitative
RT-PCR analysis and gene expression
Liver and epididymal adipose tissues were collected
from rats, flash frozen in 1 ml TRIzol reagent and subsequently
stored at −70°C. Frozen samples (∼100 mg tissue per sample) were
immediately homogenized using a POLYTRON 300 D homogenizer
(Brinkmann Instruments, Inc., Westbury, NY, USA). Total RNA was
extracted via chloroform extraction, which was followed by nucleic
acid precipitation with isopropanol. The pellet was washed with 75%
ethanol and resuspended in molecular biology grade water. The
nucleic acid concentration was measured at an optical density of
260 nm using a SmartSpec spectrophotometer (Bio-Rad Laboratories,
Inc., Hercules, CA, USA). The RNA integrity was evaluated using an
Agilent 2100 Bioanalyzer (Agilent Technologies, Inc., Foster City,
CA, USA).
RNA (1 µg) was treated at 70°C for 5 min and reverse
transcribed using 100 units Moloney Murine Leukemia Virus Reverse
Transcriptase (Gibco Life Technologies, Carlsbad, CA, USA), 50 pmol
poly (dT) primer and 20 nmol dNTPs, in a total volume of 10 µl at
37°C for 1 h. After heating at 94°C for 5 min, PCR amplification
was performed using 2.5 units Taq polymerase (PerkinElmer, Inc.,
Waltham, MA, USA), 3 mM MgCl2 and 50 pmol forward and
reverse primers specific for the respective genes, in a total
volume of 25 µl. The PCR conditions for the various genes
investigated are presented in Table
I. PCR products were visualized under an ultra-violet lamp
following electrophoresis in 1.5% agarose gel stained with ethidium
bromide. Intensities of the PCR bands were analyzed
densitometrically using ImageJ software (version 1.48; http://imagej.en.softonic.com).
 | Table I.Polymerase chain reaction conditions
for the genes analyzed. |
Table I.
Polymerase chain reaction conditions
for the genes analyzed.
| Gene | Product size
(bp) | Annealing temp
(°C) | Direction | Sequence |
|---|
| Fetuin-A | 260 | 55.5 | Sense |
CCAGTGTCATTCCACCAGA |
|
|
|
| Antisense |
CGCAGCTATCACAAACTCCA |
| FAS | 345 | 61 | Sense |
CCAGAGCCCAGACAGAGAAG |
|
|
|
| Antisense |
GACGCCAGTGTTCGTTCC |
| IRS-1 | 337 | 53.5 | Sense |
GCCAATCTTCATCCAGTTGC |
|
|
|
| Antisense |
CATCGTGAAGAAGGCATAGG |
| IRS-2 | 151 | 55 | Sense |
CTACCCACTGAGCCCAAGAG |
|
|
|
| Antisense |
CCAGGGATGAAGCAGGACTA |
| ACO | 633 | 53 | Sense |
GCCCTCAGCTATGGTATTAC |
|
|
|
| Antisense |
AGGAACTGCTCTCACAATGC |
| CPT-1 | 628 | 52 | Sense |
TATGTGAGGATGCTGCTTCC |
|
|
|
| Antisense |
CTCGGAGAGCTAAGCTTGTC |
| Perilipin | 260 | 53.5 | Sense |
ACACTCTTTCTCGACACACC |
|
|
|
| Antisense |
CTGGTCTTCATGGTTCTCAT |
| PPAR-α | 680 | 59 | Sense |
GAGGTCCGATTCTTCCACTG |
|
|
|
| Antisense |
ATCCCTGCTCTCCTGTATGG |
| G3PDH | 309 | 52 | Sense |
AGATCCACAACGGATACATT |
|
|
|
| Antisense |
TCCCTCAAGATTGTCAGCAA |
Liver and pancreatic histopathology
and immunohistochemistry
Rats were anesthetized with diethyl ether and the
liver was incised. Following removal of the liver from the rats,
the liver was fixed overnight in 10% buffered neutral formalin
solution. Fixed tissues were processed routinely by washing,
dehydration, clearing, paraffin embedding, casting and sectioning
into 5-µm slices for hematoxylin and eosin staining (20). With regard to immunohistochemistry,
pancreatic tissue sections were deparaffinized and treated with 3%
H2O2 for 10 min to inactivate the
peroxidases. Subsequently, the tissue samples were heated in 10 mM
citrate buffer at 121°C for 30 min for antigen retrieval, blocked
in 5% normal serum for 20 min, and incubated with a rabbit
polyclonal anti-insulin primary antibody (1:100; sc-9168; Santa
Cruz Biotechnology, Inc., Dallas, TX, USA) in phosphate-buffered
saline (PBS) overnight at 4°C. After three extensive washes with
PBS, the sections were incubated with a goat anti-rabbit IgG
biotin-conjugated secondary antibody (1:2,000; sc-2040; Santa Cruz
Biotechnology, Inc.) for 20 min at 32°C. After further incubation
with horseradish peroxidase-labeled streptavidin, antibody binding
was visualized using diaminobenzidine, and the sections were
counterstained with hematoxylin. Tissue slides were visualized
using a Wolfe S9-0982 microscope (Carolina Biological Supply Co.,
Burlington, NC, USA). Images were captured using a Canon powershot
SX500 IS digital camera (Canon, Inc., Tokyo, Japan).
Statistical analysis
Results are expressed as the mean ± standard error
for five independent rats per group. The statistical significance
of the differences between groups was assessed using analysis of
variance and post hoc descriptive analysis with SPSS software for
Windows, version 11.5 (SPSS, Inc., Chicago, IL, USA). P<0.05 was
considered to indicate a statistically significant difference.
Results
Changes in the serum levels of
insulin, glucose and various lipid parameters
As shown in Table
II, the induction of T2DM and IR increased the serum levels of
glucose, TC, TG, LDL and VLDL, while decreasing the levels of HDL
and insulin. By contrast, metformin administration for 4 weeks
mitigated these elevations in all the parameters measured and
increased the HDL levels and insulin secretion, supporting the
beneficial effects of metformin in the treatment of IR and
T2DM.
| Table II.Serum changes in insulin, glucose and
lipid profiles during insulin resistance and following metformin
administration. |
Table II.
Serum changes in insulin, glucose and
lipid profiles during insulin resistance and following metformin
administration.
| Parameter | Control | Type 2
diabetes | Metformin |
|---|
| Insulin (IU/l) | 4.5±0.5 |
3.4±2.5a |
5.6±1.4b |
| Glucose
(mg/dl) | 85.2±10.6 |
165.5±15.6a |
75.5±9.4b |
| Trigylcerides
(mg/dl) | 98.3±6.0 |
195.7±10.5a |
80.6±5.2b |
| Cholesterol
(mg/dl) | 118.6±2.9 |
190.6±4.4a |
103.6±3.5b |
| LDL (mg/dl) | 57.6±4.4 |
208.6±9.6a |
58.6±1.8b |
| VLDL (mg/dl) | 19.6±2.1 |
38.0±2.1a |
17.3±1.8b |
| HDL (mg/dl) | 34.0±1.0 |
23.6±2.1a |
32.6±1.2b |
Metformin normalizes the T2DM-induced
alterations in the expression levels of genes associated with lipid
metabolism
Semi-quantitative RT-PCR analysis was performed for
hepatic acyl-CoA oxidase (ACO), carnitine palmitoyl transferase-1
(CPT-1), apolipoprotein C-III (apo C-III) and fetuin-A in the
normal control, T2DM and T2DM + metformin rats. During T2DM and IR,
a disturbance in lipid profiles typically occurs and alterations in
the expression of genes associated with lipid metabolism may be
observed (6). Therefore, alterations
in the expression levels of ACO, CPT-1, apo C-III and fetuin-A were
analyzed in the rat livers. Fatty acid oxidation was reduced during
IR, as indicated by the expression levels of ACO and CPT-1
(Fig. 1A and B). However, metformin
administration for 4 weeks increased the expression levels of ACO
and CPT-1 (Fig. 1A and B), which
appeared to improve the dyslipidemia observed in the T2DM rats. In
contrast to ACO and CPT-1, the expression levels of apo C-III and
fetuin-A increased in the T2DM rats, and metformin administration
decreased their expression to approximately normal levels (Fig. 1C and D).
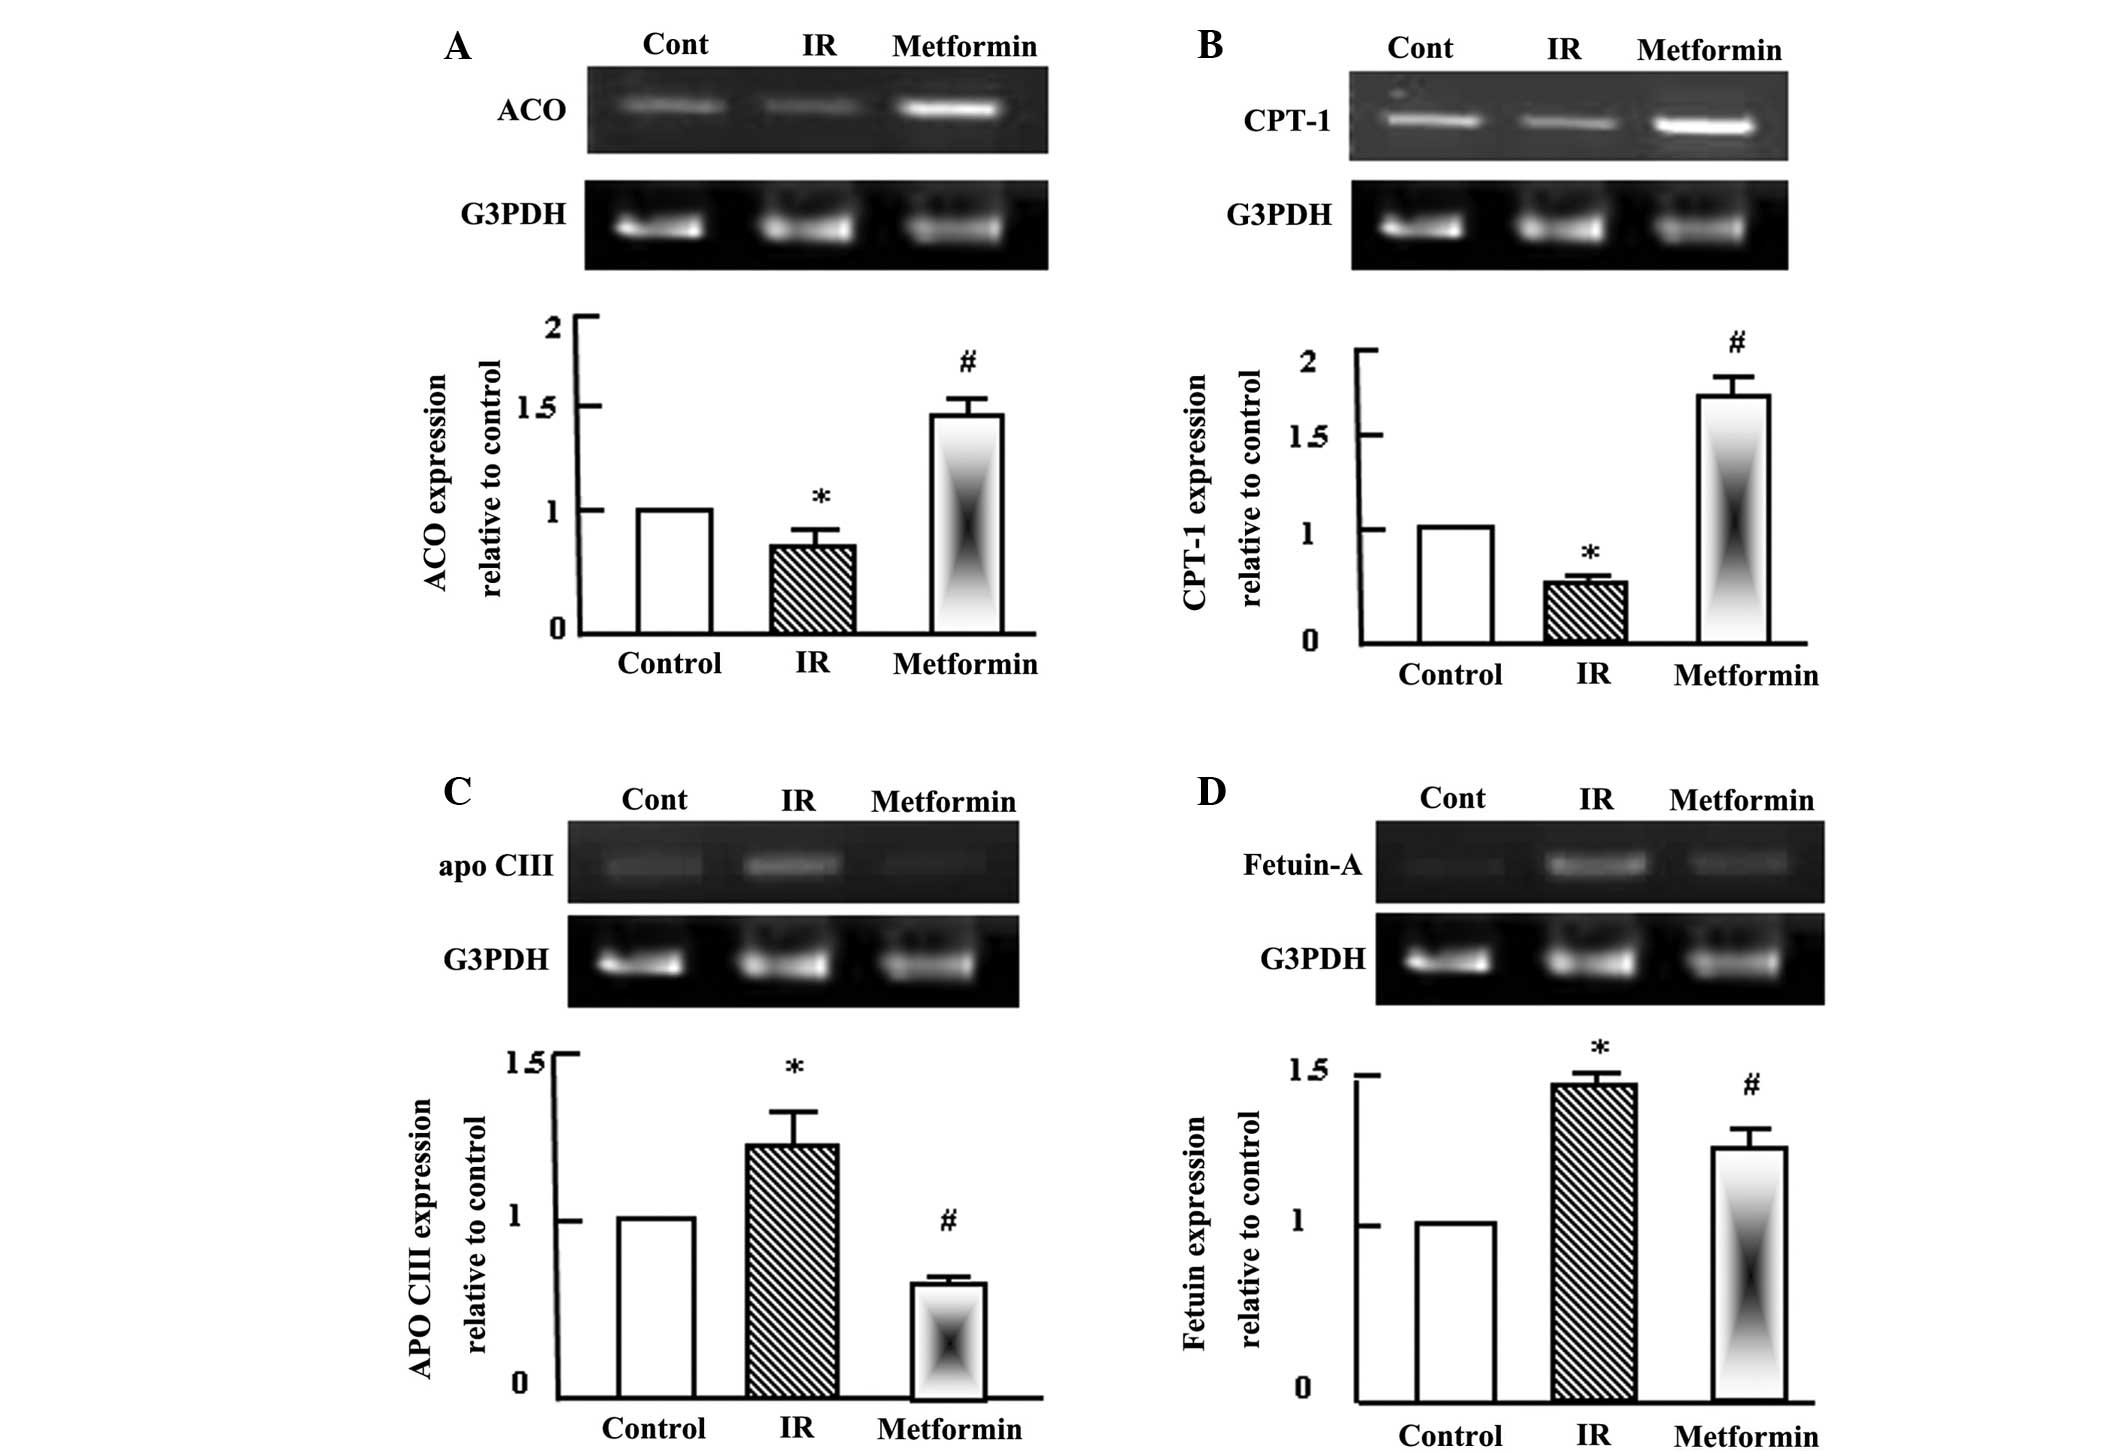 | Figure 1.Semi-quantitative reverse
transcription-polymerase chain reaction (RT-PCR) analysis of (A)
ACO, (B) CPT-1, (C) apo C-III and (D) fetuin-A expression in the
liver tissue of the control, IR and metformin-administered rats.
RNA (1 mg) was extracted, reverse transcribed and RT-PCR analysis
was conducted to assess ACO, CPT-1, apo C-III and fetuin-A
expression, as described in the materials and methods.
Densitometric analysis was conducted for three independent
experiments, and data are presented as the mean ± standard error
for the three independent experiments. *P<0.05, vs. control;
#P<0.05, vs. IR group. ACO, acyl-CoA oxidase; IR,
insulin resistance; CPT-1, carnitine palmitoyl transferase-1; Apo
C-III, apolipoprotein C-III; G3PDH, glyceraldehyde-3-phosphate
dehydrogenase. |
Metformin normalizes the T2DM-induced
alterations in the expression levels of insulin signaling
molecules
Semi-quantitative RT-PCR analysis was performed for
hepatic insulin receptor substrate (IRS)-1 and IRS-2, fatty acid
synthetase (FAS) and peroxisome proliferator activated receptor
(PPAR)-α in the normal control, T2DM and T2DM + metformin rats. As
shown in Fig. 2A and B, insulin
signaling was reduced as a result of IR and T2DM, as indicated by
the reduction in the expression levels of IRS-1 and IRS-2. By
contrast, the expression of FAS was increased during IR due to the
increase in fatty acids synthesis and lipogenesis, while metformin
administration normalized the FAS expression levels (Fig. 2C). PPAR-α expression was increased
following the administration of metformin (Fig. 2D), which indicated that the effects
of metformin were gene specific.
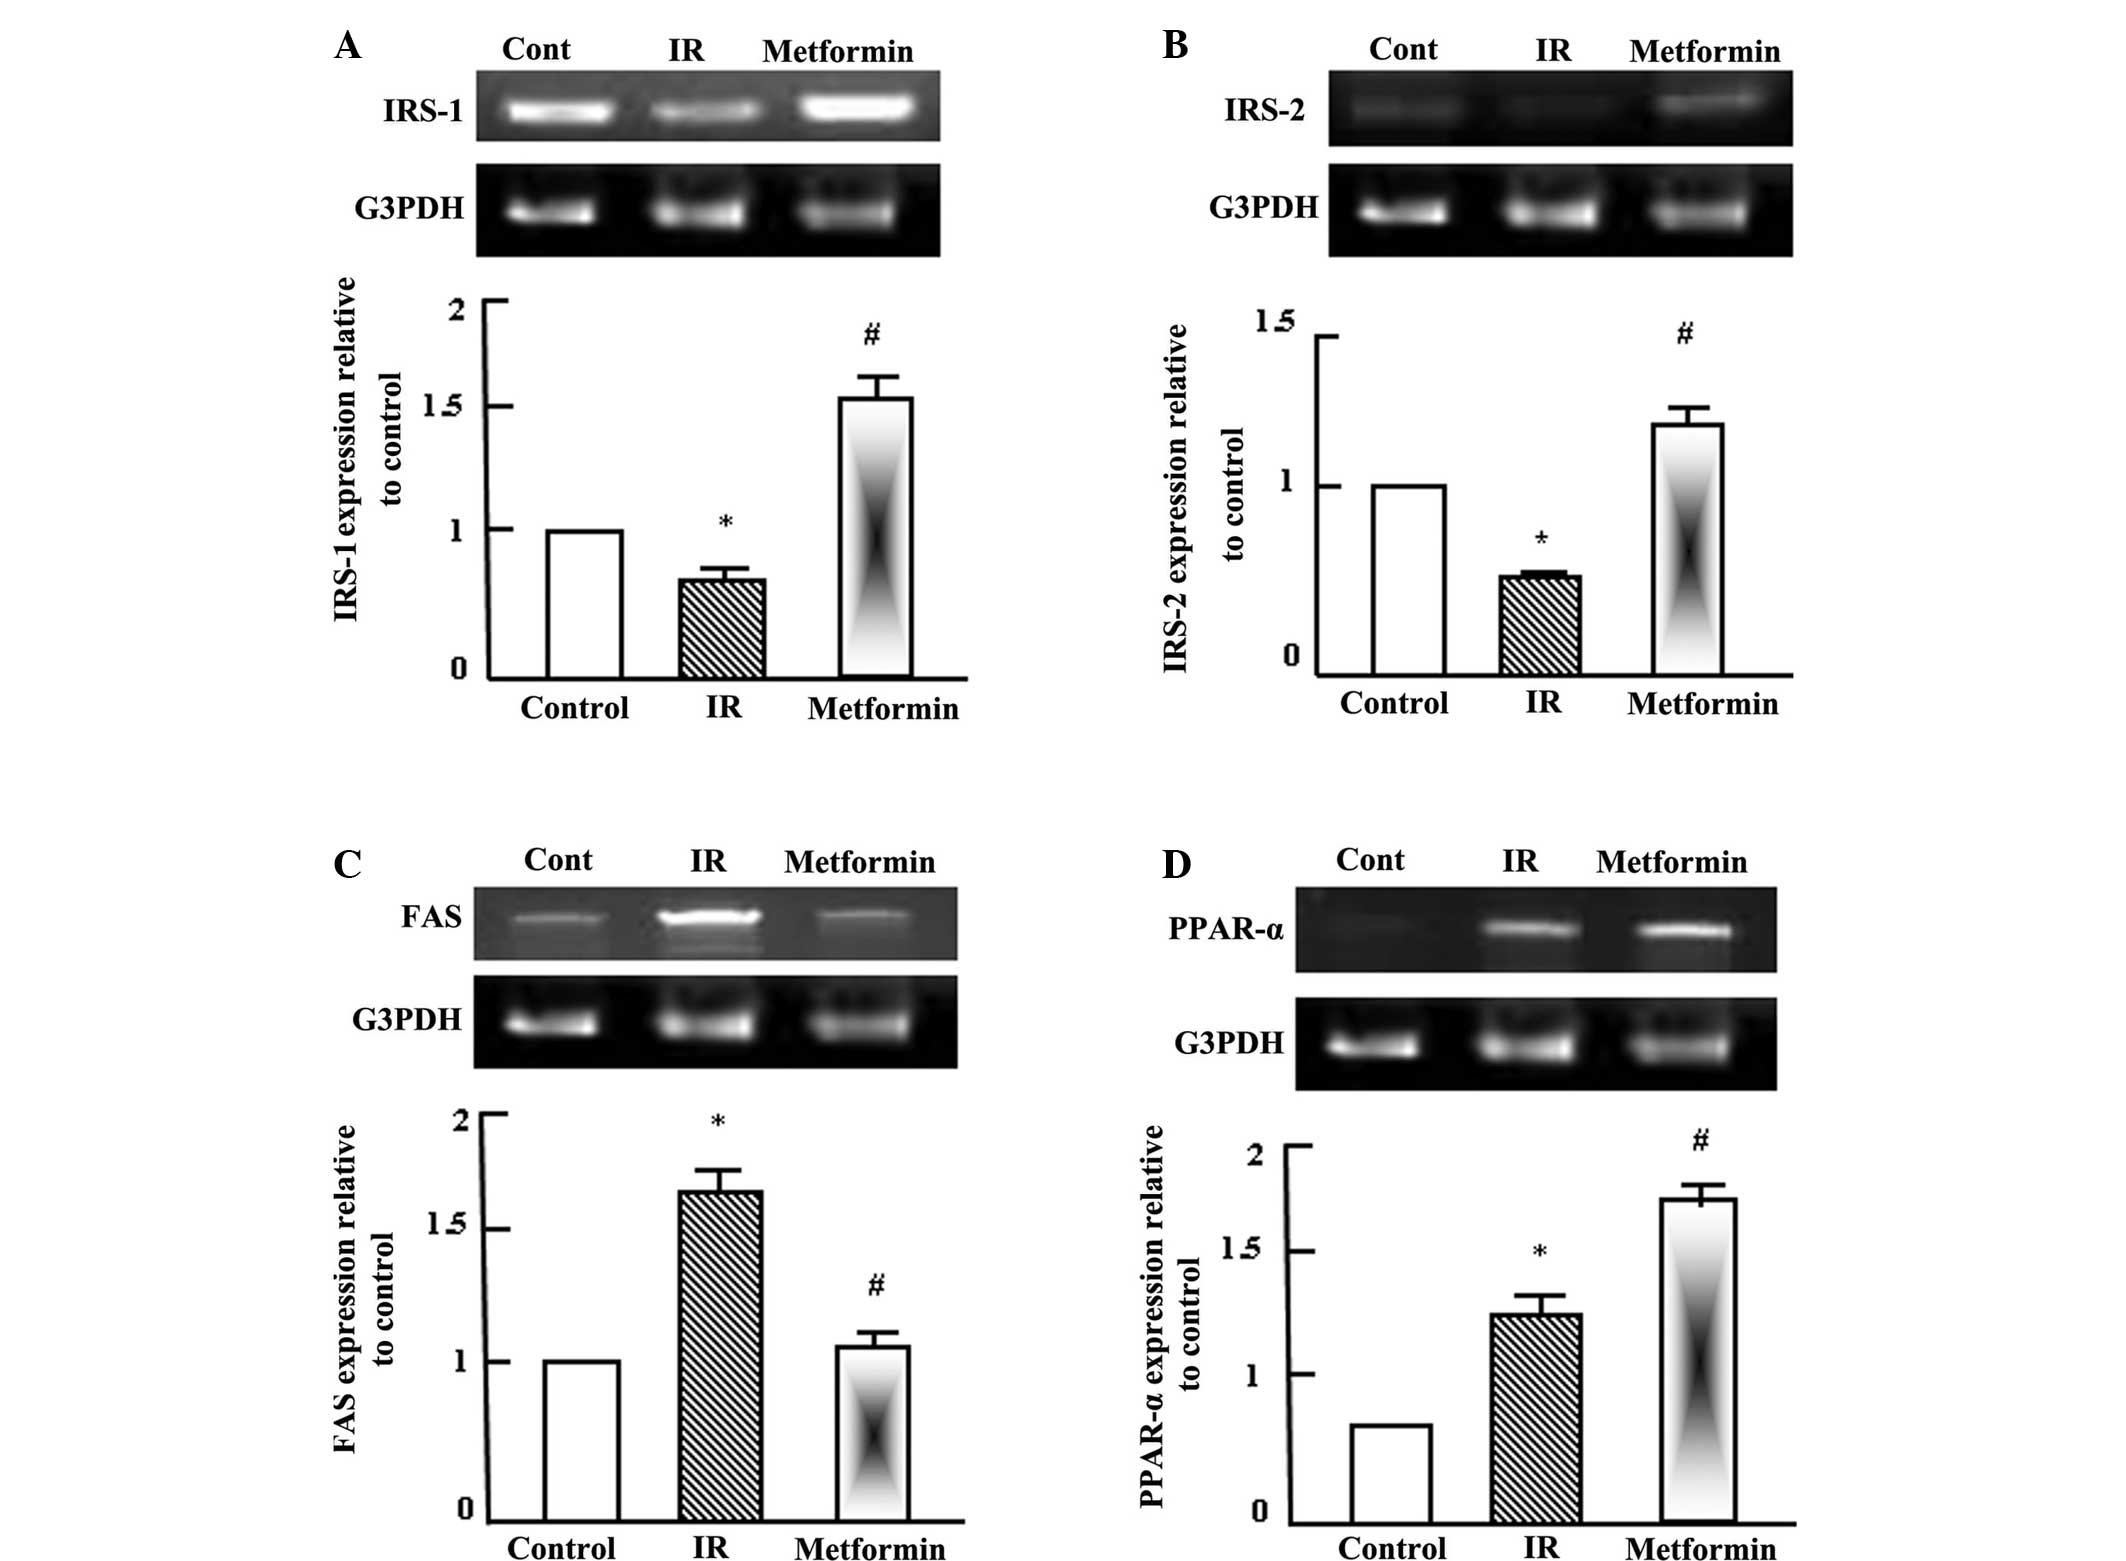 | Figure 2.Semi-quantitative reverse
transcription-polymerase chain reaction (RT-PCR) analysis of (A)
IRS-1, (B) IRS-2, (C) FAS and (D) PPAR-α expression in the liver
tissue of the control, IR and metformin-administered rats. RNA (1
mg) was extracted, reverse transcribed and RT-PCR analysis was
conducted to assess IRS-1, IRS-2, FAS and PPAR-α expression, as
described in the materials and methods. Densitometric analysis was
conducted for three independent experiments, and data are presented
as the mean ± standard error for the three independent experiments.
*P<0.05, vs. control; #P<0.05, vs. IR group. IR,
insulin resistance; IRS, insulin receptor substrate; FAS, fatty
acid synthetase; PPAR-, peroxisome proliferator activated receptor;
G3PDH, glyceraldehyde-3-phosphate dehydrogenase. |
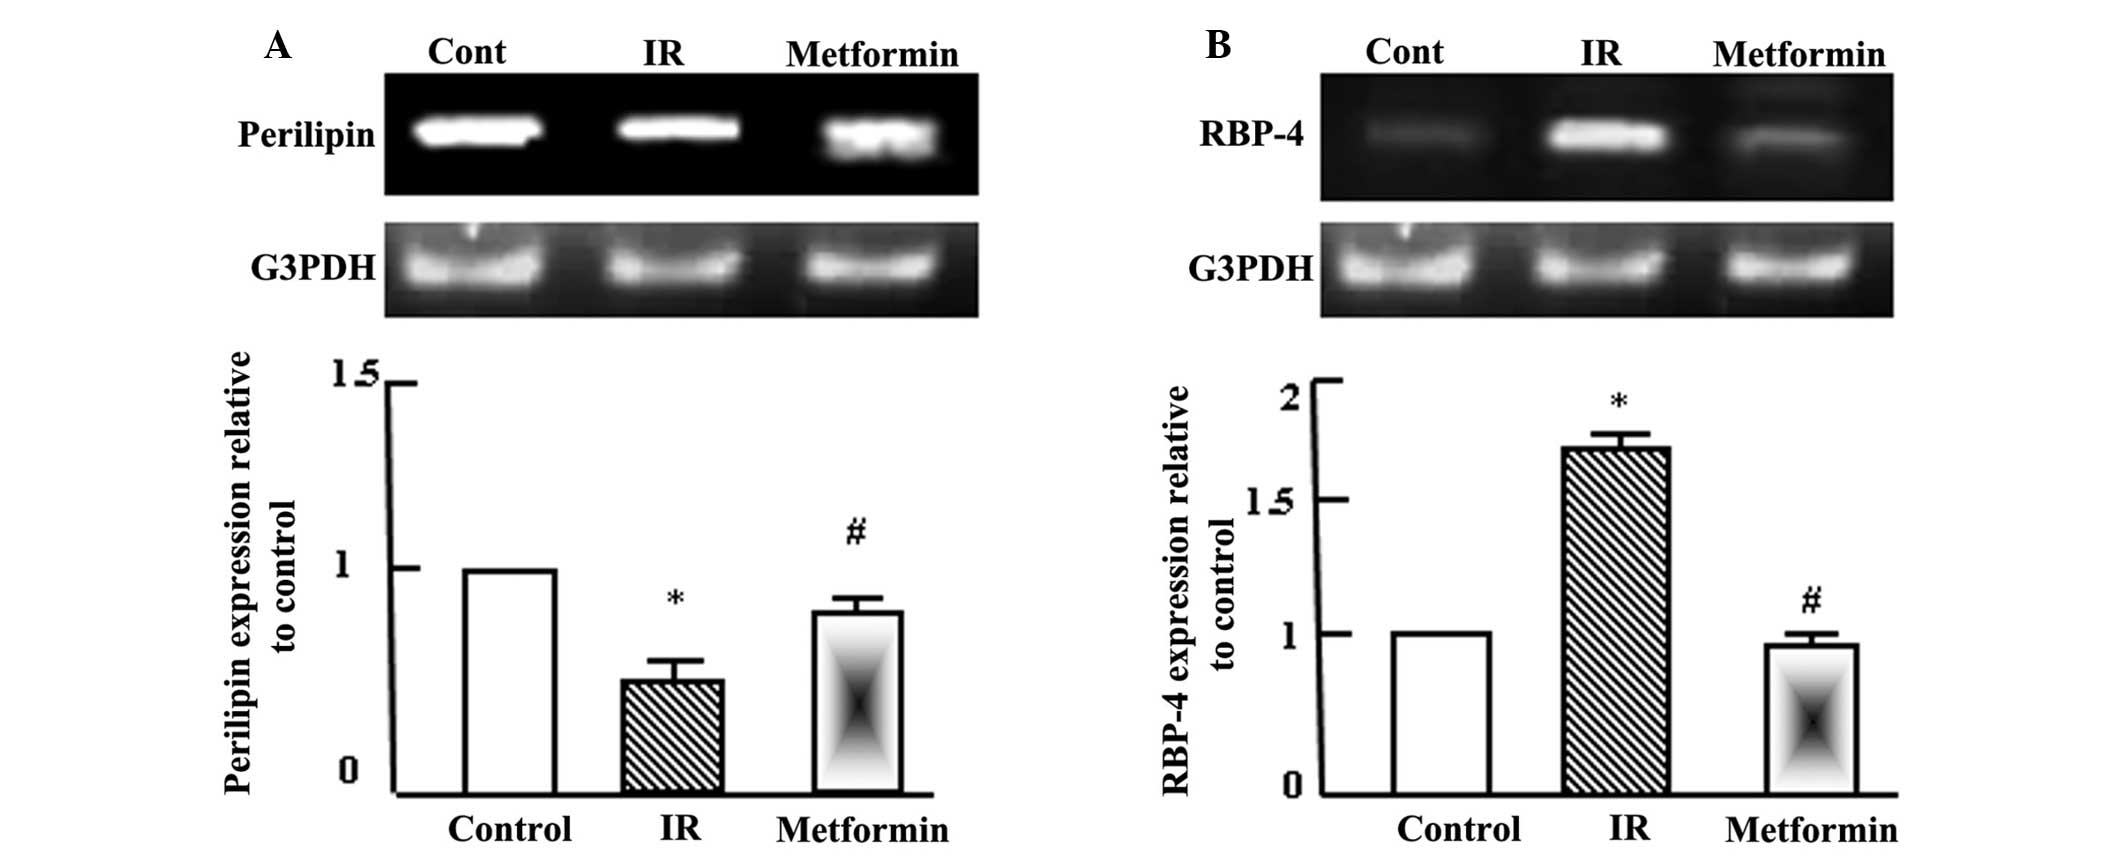
Metformin normalizes the expression
levels of perilipin and retinol binding protein-4 (RBP-4) in
adipose tissue
Semi-quantitative RT-PCR analysis was performed for
perilipin and RBP-4 in the adipose tissue of the normal control,
T2DM and T2DM + metformin rats. As shown in Fig. 3, perilipin expression levels
decreased significantly following the induction of T2DM and IR,
while RBP-4 expression levels increased. Administration of
metformin to the T2DM rats normalized the perilipin expression
levels, as compared with the normal control and T2DM rats, and
reduced RBP-4 expression after 4 weeks of administration.
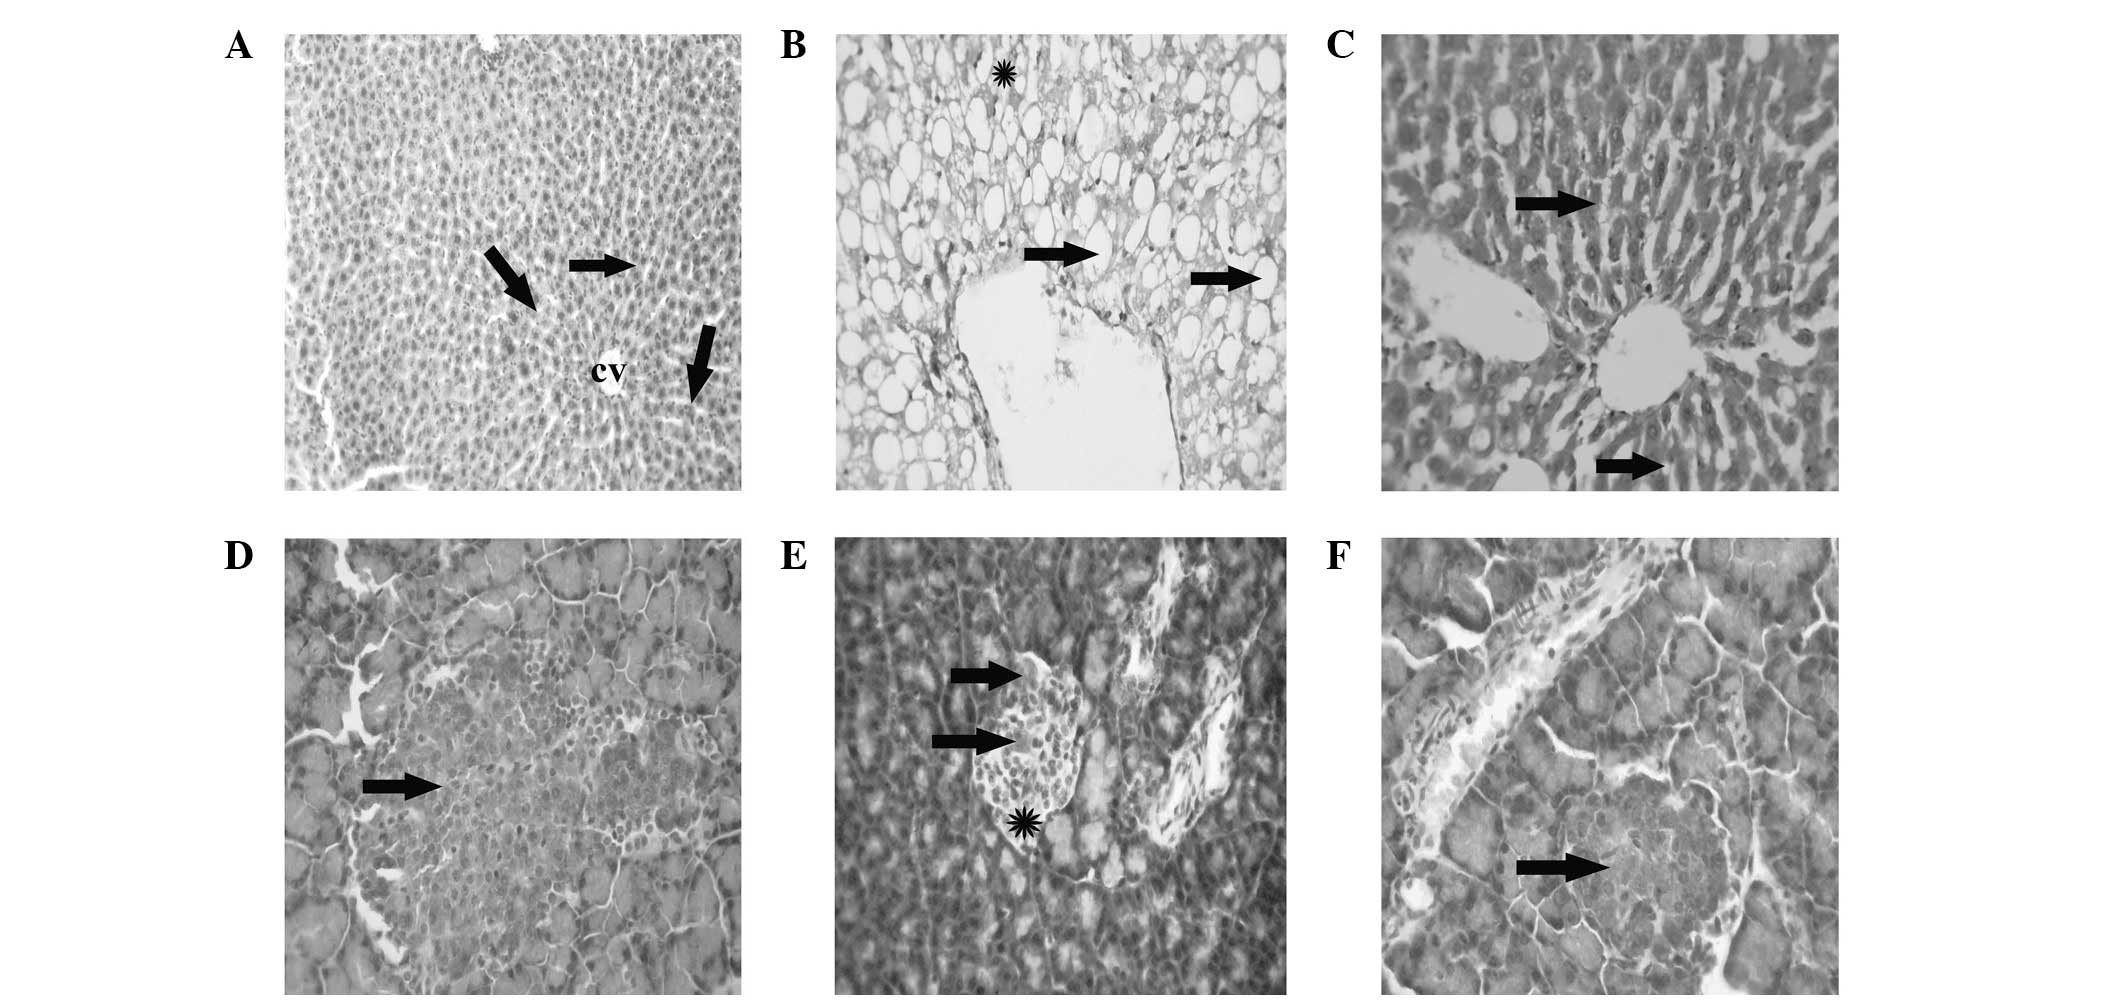
Hepatic histopathological and
pancreatic immunohistochemical changes in normal, T2DM and T2DM +
metformin rats
Liver tissue from the healthy control rats exhibited
a normal hepatic architecture, represented by normal hepatic
lobules with a thin walled central vein and hepatic cords radiating
towards the periphery, alternating with hepatic sinusoids (Fig. 4A). The liver tissue of the T2DM/IR
rats presented with signet-ring hepatocyte morphology due to the
extensive accumulation of fat replacing the hepatic cytoplasm or
appearing as numerous small fat droplets (Fig. 4B). However, the liver tissue
collected from the T2DM + metformin rats exhibited restoration of
the normal hepatic architecture, with a reduction in the degree of
fat droplet accumulation from the hepatocyte cytoplasm and
regeneration of the hepatic parenchyma (Fig. 1C). The pancreas of the healthy
control rats presented a normal architecture with normal insulin
expression in the pancreatic β cells (Fig. 4D). However, the pancreatic tissue
samples from the T2DM rats exhibited a reduction in the expression
of insulin, with mild atrophy of the pancreatic β cells (Fig. 4E). Finally, the pancreas of the T2DM
+ metformin rats exhibited regenerative restoration of normal
expression of insulin in the pancreatic β cells (Fig. 4F).
Discussion
In the present study, metformin was observed to
ameliorate a number of the alterations in the serum and gene
expression levels that occurred as a result of T2DM/IR. Metformin
ameliorated the alterations associated with IR, including lipid
profiles, insulin expression and glucose levels. Furthermore, the
T2DM-induced alterations in the expression levels of genes
associated with lipid metabolism were normalized following
metformin administration. The metabolic action of insulin in liver
tissue occurs in response to the activation of the phosphatidyl
inositol 3 kinase (PI3K) pathway, in which the insulin receptor is
activated by autophosphorylation after binding to insulin (21). The activated insulin receptor
subsequently phosphorylates selective tyrosine residues on IRS and
induces the binding of IRS-1 and IRS-2 to PI3K, phosphorylating
serine and activating protein kinase B (PKB). The activation of PKB
is crucial for various processes, including glucose transport in
the liver, muscle and adipose tissue, glycogen synthesis in the
liver and muscle tissue and lipogenesis in the adipose tissue
(22). The phosphorylation of IRS-1
by serine kinases disrupts the interaction between the insulin
receptor and IRS, thus preventing the tyrosine phosphorylation of
IRS (21). These previously observed
mechanisms are consistent with the results of the present study,
since IR was observed to downregulate insulin receptor signaling,
while metformin upregulated insulin receptor signaling and
mitigated the dyslipidemia associated with IR. In accordance,
Elmadhun et al (22)
demonstrated that metformin supplementation in a T2DM rat model
significantly altered the insulin signaling pathway. The insulin
signaling cascade is initiated by insulin binding to the insulin
receptor, resulting in tyrosine phosphorylation of IRS, which
activates IRS and allows binding to PI3K. Subsequently, PI3K
activates PKB, which initiates the translocation of intracellular
glucose transporter-4 (GLUT-4) vesicles to the plasma membrane
(23).
The administration of metformin has been previously
demonstrated to improve hepatic insulin sensitivity by modulating
the insulin signaling pathway in high fat-fructose diet (HFFD)-fed
IR rats (24). Consumption of a HFFD
resulted in hyperglycemia, hyperinsulinemia, increased
gluconeogenesis and the reduced tyrosine phosphorylation of insulin
receptor-β and IRS-1 (24). The
authors observed that the administration of metformin reversed all
the parameters altered by consumption of the HFFD. The present
study demonstrated that the improved insulin sensitivity induced as
a result of metformin treatment is mediated by enhanced tyrosine
phosphorylation of IRS-1 and IRS-2. Grisouard et al
(25) and unpublished data from the
current research group indicated that metformin increases the mRNA
expression levels of GLUT-4, and subsequently increases GLUT-4
protein levels in storage vesicles and the plasma membrane.
Notably, GLUT-4 levels are lower in the adipocytes of obese
patients and individuals with diminished glucose tolerance or T2DM
(26).
Numerous approaches have been investigated with the
aim to mitigate the damaging effects of IR by reducing the
accumulation of detrimental lipids in muscle and liver tissue.
Certain approaches have attempted to decrease the availability of
TG and non-esterified fatty acids in circulation, in which the
administration of PPAR-α agonists has been demonstrated to be
successful (27). PPAR-α is a
transcription factor that exerts notable effects on lipid
homeostasis by regulating the expression of genes involved in lipid
metabolism (27). The transcription
factor is primarily expressed in the liver, where it regulates the
transcription of genes involved in lipid uptake and oxidation, such
as acyl-CoA synthetase (ACS), ACO, CPT-1 and lipoprotein lipase
(LPL) (28). The activation of these
factors is hypothesized to result in the sequestration of lipid
into the liver for oxidation, which is demonstrated by the results
of the present study (Fig. 2D). This
activity putatively reduces the quantity of lipid available to the
skeletal muscle, which is the most prevalent insulin-sensitive
tissue type in humans (28).
Following activation, PPAR-α is able to heterodimerize with the
retinoid X receptor and bind with peroxisome proliferator response
elements, which are located in the promoter regions of various
genes, such as LPL (29), ACO
(30), ACS (31) and CPT-1 (32), the transcription of which is
activated by the complex. However, the expression of apo C-III is
suppressed by PPAR-α activation due to the competition for a
response element between the PPAR-α-retinoid X receptor heterodimer
and hepatocyte nuclear factor-4, a liver enriched transcriptional
activator (33).
The results of the present study indicate that
metformin administration reduces the hepatic mRNA expression of apo
C-III. Apo C-III inhibits the hydrolysing function of LPL, which is
consistent with the observed reduction in the hepatic expression
levels of apo C-III in the T2DM + metformin rats. The
metformin-induced elevation in the mRNA expression levels of CPT-1
in the hepatic tissue may account for the increased level of
β-oxidation in the liver tissue. Although metformin was not shown
to directly enhance the expression of PPAR-α, the drug was observed
to increase the mRNA expression levels of hepatic ACO, which is a
well-known marker of PPAR-α activation. In addition, similar to
typical PPAR-α activators, metformin reduced the mass of visceral
fat. These results indicate that metformin may function as a PPAR-α
agonist.
In a previous study, significant reductions were
observed in the plasma levels of TG, TC and insulin, body weight,
abdominal fat weight, hepatic lipid content and hepatic FAS
expression in laying hens with non-alcoholic fatty livers
administered metformin at 100 mg/kg body weight; however, a
significant increase was observed in the expression levels of CPT-1
(34). Collectively, these previous
findings and the results of the present study confirm the efficacy
of metformin for the treatment of IR. In addition to the induction
of lipolytic enzymes, metformin may also function as an activator
of adenosine monophosphate-activated protein kinase (AMPK)
(35). The activation of AMPK
phosphorylates acyl-CoA cyclase (ACC) and subsequently inhibits its
activity, which leads to a reduction in malonyl-CoA synthesis. This
reduction may in turn stimulate the transportation of fatty acids
into the mitochondria for β-oxidation via the upregulation of
CPT-1, a transporter of fatty acids (36). Furthermore, metformin increases the
phosphorylation of mitogen-activated protein kinase (MAPK) and ACC,
and the expression of CPT-1, which suggests that metformin enhances
fatty acid β-oxidation.
In addition to enhancing the rate of lipolysis and
fatty acid oxidation in mitochondria, metformin reduces the
expression of FAS, a lipogenic protein. FAS catalyzes the final
step in the fatty acid biosynthetic pathway and is crucial for
determining the maximum capacity of a tissue for synthesizing fatty
acids via the de novo pathway (37). The results of the present study
indicate that metformin may exert this lipid-reducing activity via
the concerted modulation of lipolysis and lipogenesis, in which the
expression levels of hepatic genes associated with lipid metabolism
are altered. These findings are consistent with those of a previous
clinical study, which indicated that a combination of insulin and
metformin reduced hepatic steatosis and TG levels in patients with
T2DM (38). In addition, Bhalla
et al (39) observed that
metformin reduced the mRNA and protein expression levels of a
number of lipogenic enzymes, such as FAS, which is consistent with
the results of the present study.
Fetuin-A is a 60 kDa glycoprotein that is secreted
by hepatocytes, and can be used as a biomarker of liver function
and inflammation. Fetuin-A modulates insulin signal transduction by
inhibiting the insulin receptor tyrosine kinase in the liver and
skeletal tissue, as well as inhibiting the autophosphorylation of
the insulin receptor in vitro and in vivo, which
ultimately results in IR (10).
Furthermore, increased fetuin-A levels have been associated with
obesity, IR, metabolic syndrome, liver fat accumulation and an
increased risk of T2DM (10). In the
present study, fetuin-A expression was shown to increase in the
T2DM rats, while treatment with metformin was able to restore
fetuin-A expression. Fetuin-A has been demonstrated to suppress the
generation of adiponectin in adipose tissue, and fetuin-A treatment
in wild-type mice may result in hypoadiponectinemia (10). In addition, reduced levels of
adiponectin may induce the accumulation of fat in the liver,
resulting in increased fetuin-A secretion (40). Therefore, elevated fetuin-A
expression may lead to reduced levels of adiponectin in obese
patients with T2DM, as indicated in a study by Mori et al
(10).
An additional lipid metabolism regulating gene is
perilipin, which has the function of coating the surface of
intracellular lipid droplets in adipocytes. Perilipin modulates
lipolysis (41) through limiting the
interaction between lipase and the TG core stored within the lipid
droplets (42). The results of the
present study demonstrated that metformin normalized the IR-induced
reduction in the expression of perilipin in the adipose tissue of
T2DM rats. In addition, the treatment of adipocytes with metformin
has been shown to attenuate lipolytic activity, stimulated by tumor
necrosis factor (TNF)-α, isoproterenol or a high dose of glucose
(43). The inhibitory effect of
metformin on TNF-α-stimulated lipolysis is accompanied by the
suppressed phosphorylation of extracellular signal-regulated
kinases 1/2 and the reversed downregulation of perilipin. These two
effects may primarily account for the molecular basis underlying
the antilipolytic function of metformin in TNF-α-stimulated
adipocytes.
A previous study revealed that RBP-4 is the only
specific transport protein for retinol (vitamin A) that is able to
deliver retinol to tissues from the blood (44). RBP-4 is highly expressed in adipose
tissue, as compared with liver tissue, and is strongly associated
with endothelial function (44).
Fischer et al (45) reported
that a reduction in RBP-4 secretion results in improved insulin
levels (44). Previously, RBP-4
serum levels appeared to be associated with insulin sensitivity,
and were increased in obese non-diabetic subjects (44) and patients with T2DM (46). Limited data is available with regard
to the exact role of RBP-4 in human metabolism. However, a previous
study reported a marked correlation between RBP-4 and IR in
non-diabetic subjects without a medical or family history of
diabetes (47).
Furthermore, a prior study demonstrated that high
secretion of RBP-4 by adipocytes reduced the expression of GLUT-4
in adipose tissue, which is commonly observed in patients with T2DM
(47). The results of the present
study are consistent with those of Tajtáková et al (48), since obese patients with T2DM treated
with metformin were shown to exhibit lower plasma RBP-4 levels
compared with obese patients, indicating that metformin may improve
total insulin sensitivity through RBP-4. Recently, the insulin
sensitizer, rosiglitazone, has been reported to significantly
decrease the RBP-4 levels, and thus, mitigate IR (49). Therefore, RBP-4 may be useful as a
clinical marker for identifying individuals at risk of developing
IR or T2DM. In addition, it is possible that metformin exerts its
effects via the regulation of RBP-4.
T2DM is characterized by progressive β cell
destruction, as a result of chronic IR and the loss of β cell mass
and function, as shown in Fig. 4E
and demonstrated by previous studies (50,51). The
primary mechanism underlying the reduction in β cell mass in
patients with T2DM is the apoptosis of β cells in all diabetic
patients. However, β cell mass is affected by numerous factors,
including cell size, rate of cell renewal or neogenesis and the
rate of apoptosis (51). In patients
with T2DM, pancreatic β cells are unable to secrete sufficient
quantities of insulin to compensate for the reduced insulin
sensitivity, which is primarily a result of insulin secretion
dysfunction and a marked reduction in the number of functional β
cells (Fig. 4E) (50–54).
Consistent with these findings, the present study observed similar
effects, as metformin administration participated in the
regeneration of the capacity of pancreatic β cells to secrete
insulin. In the T2DM + metformin group rats, restoration of normal
β cell mass was observed. Thus, the antidiabetic effects of
metformin may occur as a result of the reduction of hepatic
gluconeogenesis, the regeneration of hepatocytes (Fig. 4C), reduced glucose absorption and
increased insulin sensitivity (Fig.
4F), through the increase in glucose uptake and utilization
(55,56).
In conclusion, the results of the present study
demonstrated the beneficial effects of metformin in the treatment
of IR. Metformin was observed to normalize IR-associated
dyslipidemia. Furthermore, metformin was demonstrated to regulate
the expression of various genes associated with lipid metabolism.
Notably, close associations were observed between metformin and a
number of genes expressed in the liver and adipose tissue,
including fetuin-A, perilipin and RBP-4. However, further studies
are required to outline the molecular signaling pathways affected
by metformin in the amelioration of IR.
Acknowledgements
The study was supported by a grant from The Deans of
Scientific Affairs, Taif University (no. 2220-1-1434; Ta'if, Saudi
Arabia).
Abbreviations:
|
ACO
|
acyl-CoA oxidase
|
|
ACS
|
acyl-CoA synthetase
|
|
AMPK
|
adenosine monophosphate-activated
protein kinase
|
|
MAPK
|
mitogen-activated protein kinase
|
|
apo C-III
|
apolipoprotein C-III
|
|
CNS
|
central nervous system
|
|
CPT-1
|
carnitine palmitoyl transferase-1
|
|
FAS
|
fatty acid synthetase
|
|
GLUT-4
|
glucose transporter-4
|
|
HDL
|
high-density lipoprotein
|
|
HFD
|
high-fat diet
|
|
HFFD
|
high-fat fructose diet
|
|
IR
|
insulin resistance
|
|
IRS
|
insulin receptor substrates
|
|
LDL
|
low-density lipoprotein
|
|
LPL
|
lipoprotein lipase
|
|
PI3K
|
phosphatidyl inositol 3 kinase
|
|
PKB
|
protein kinase B
|
|
PPAR-α
|
peroxisome proliferator activated
receptor-α
|
|
PBS
|
phosphate-buffered saline
|
|
RT-PCR
|
reverse transcription-polymerase chain
reaction
|
|
RBP-4
|
retinol binding protein-4
|
|
STZ
|
streptozotocin
|
|
T2DM
|
type 2 diabetes mellitus
|
|
TC
|
total cholesterol
|
|
TG
|
triglycerides
|
|
VLDL
|
very low-density lipoprotein
|
|
ACC
|
acyl-CoA cyclase
|
|
TNF
|
tumor necrosis factor
|
References
|
1
|
Shaw JE, Sicree RA and Zimmet PZ: Global
estimates of the prevalence of diabetes for 2010 and 2030. Diabetes
Res Clin Pract. 87:4–14. 2010. View Article : Google Scholar : PubMed/NCBI
|
|
2
|
Roglic G and Unwin N: Mortality
attributable to diabetes: Estimates for the year 2010. Diabetes Res
Clin Pract. 87:15–19. 2010. View Article : Google Scholar : PubMed/NCBI
|
|
3
|
Stumvoll M, Goldstein BJ and van Haeften
TW: Type 2 diabetes: Principles of pathogenesis and therapy.
Lancet. 365:1333–1346. 2005. View Article : Google Scholar : PubMed/NCBI
|
|
4
|
Rewers M, Zaccaro D, D'Agostino R, Haffner
S, Saad MF, Selby JV, Bergman R and Savage P: Insulin Resistance
Atherosclerosis Study Investigators: Insulin sensitivity,
insulinemia and coronary artery disease: the Insulin Resistance
Atherosclerosis study. Diabetes Care. 27:781–787. 2004. View Article : Google Scholar : PubMed/NCBI
|
|
5
|
Myers MG Jr and Olson DP: Central nervous
system control of metabolism. Nature. 491:357–363. 2012. View Article : Google Scholar : PubMed/NCBI
|
|
6
|
Reaven GM: The insulin resistance
syndrome: Definition and dietary approaches to treatment. Annu Rev
Nutr. 25:391–406. 2005. View Article : Google Scholar : PubMed/NCBI
|
|
7
|
Bouche C, Lopez X, Fleischman A, Cypess
AM, O'Shea S, Stefanovski D, Bergman RN, Rogatsky E, Stein DT, Kahn
CR, et al: Insulin enhances glucose-stimulated insulin secretion in
healthy humans. Proc Natl Acad Sci USA. 107:4770–4775. 2010.
View Article : Google Scholar : PubMed/NCBI
|
|
8
|
Rhodes CJ, White MF, Leahy JL and Kahn SE:
Direct autocrine action of insulin on β-cells: Does it make
physiological sense? Diabetes. 62:2157–2163. 2013. View Article : Google Scholar : PubMed/NCBI
|
|
9
|
Jung TW, Youn BS, Choi HY, Lee SY, Hong
HC, Yang SJ, Yoo HJ, Kim BH, Baik SH and Choi KM: Salsalate and
adiponectin ameliorate hepatic steatosis by inhibition of the
hepatokine fetuin-A. Biochem Pharmacol. 86:960–969. 2013.
View Article : Google Scholar : PubMed/NCBI
|
|
10
|
Mori K, Emoto M and Inaba M: Fetuin-A: a
multifunctional protein. Recent Pat Endocr Metab Immune Drug
Discov. 5:124–146. 2011. View Article : Google Scholar : PubMed/NCBI
|
|
11
|
Syed Ikmal SI, Zaman Huri H, Vethakkan SR
and Wan Ahmad WA: Potential biomarkers of insulin resistance and
atherosclerosis in type 2 diabetes mellitus patients with coronary
artery disease. Int J Endocrinol. 2013:6985672013.PubMed/NCBI
|
|
12
|
Sztalryd C and Kimmel AR: Perilipins:
lipid droplet coat proteins adapted for tissue-specific energy
storage and utilization and lipid cytoprotection. Biochimie.
96:96–101. 2014. View Article : Google Scholar : PubMed/NCBI
|
|
13
|
Zhou G, Myers R, Li Y, Chen Y, et al: Role
of AMP-activated protein kinase in mechanism of metformin action. J
Clin Invest. 108:1167–1174. 2001. View Article : Google Scholar : PubMed/NCBI
|
|
14
|
Woods YL, Petrie JR and Sutherland C:
Dissecting insulin signaling pathways: Individualised therapeutic
targets for diagnosis and treatment of insulin resistant states.
Endocr Metab Immune Disord Drug Targets. 9:187–198. 2009.
View Article : Google Scholar : PubMed/NCBI
|
|
15
|
Radziuk J, Zhang Z, Wiernsperger N and Pye
S: Effects of metformin on lactate uptake and gluconeogenesis in
the perfused rat liver. Diabetes. 46:1406–1413. 1997. View Article : Google Scholar : PubMed/NCBI
|
|
16
|
Nathan DM, Buse JB, Davidson MB,
Ferrannini E, Holman RR, Sherwin R and Zinman B: American Diabetes
Association, European Association for Study of Diabetes: Medical
management of hyperglycemia in type 2 diabetes: A consensus
algorithm for the initiation and adjustment of therapy: A consensus
statement of the American Diabetes Association and the European
Association for the Study of Diabetes. Diabetes Care. 32:193–203.
2009. View Article : Google Scholar : PubMed/NCBI
|
|
17
|
Diamanti-Kandarakis E, Christakou CD,
Kandaraki E and Economou FN: Metformin: an old medication of new
fashion: evolving new molecular mechanisms and clinical
implications in polycystic ovary syndrome. Eur J Endocrinol.
162:193–212. 2010. View Article : Google Scholar : PubMed/NCBI
|
|
18
|
Hundal RS and Inzucchi SE: Metformin: new
understandings, new uses. Drugs. 63:1879–1894. 2003. View Article : Google Scholar : PubMed/NCBI
|
|
19
|
Srinivasan K, Viswanad B, Asrat L, Kaul CL
and Ramarao P: Combination of high-fat diet-fed and low-dose
streptozotocin-treated rat: A model for type 2 diabetes and
pharmacological screening. Pharmacol Res. 52:313–320. 2005.
View Article : Google Scholar : PubMed/NCBI
|
|
20
|
Bancroft JD and Gamble M: Theory and
Practice of Histological Techniques6th. Churchill Livingstone
Elsevier; Philadelphia, PA: pp. 126–127. 2008
|
|
21
|
Werner ED, Lee J, Hansen L, Yuan M and
Shoelson SE: Insulin resistance due to phosphorylation of insulin
receptor substrate-1 at serine 302. J Biol Chem. 279:35298–35305.
2004. View Article : Google Scholar : PubMed/NCBI
|
|
22
|
Elmadhun NY, Lassaletta AD, Chu LM and
Sellke FW: Metformin alters the insulin signaling pathway in
ischemic cardiac tissue in a swine model of metabolic syndrome. J
Thorac Cardiovasc Surg. 145:258–266. 2013. View Article : Google Scholar : PubMed/NCBI
|
|
23
|
Sykiotis GP and Papavassiliou AG: Serine
phosphorylation of insulin receptor substrate-1: A novel target for
the reversal of insulin resistance. Mol Endocrinol. 15:1864–1869.
2001. View Article : Google Scholar : PubMed/NCBI
|
|
24
|
Yogalakshmi B, Bhuvaneswari S, Sreeja S
and Anuradha CV: Grape seed proanthocyanidins and metformin act by
different mechanisms to promote insulin signaling in rats fed high
calorie diet. J Cell Commun Signal. 8:13–22. 2014. View Article : Google Scholar : PubMed/NCBI
|
|
25
|
Grisouard J, Timper K, Radimerski TM, Frey
DM, Peterli R, Kola B, Korbonits M, Herrmann P, Krähenbühl S,
Zulewski H, et al: Mechanisms of metformin action on glucose
transport and metabolism in human adipocytes. Biochem Pharmacol.
80:1736–1745. 2010. View Article : Google Scholar : PubMed/NCBI
|
|
26
|
Shepherd PR and Kahn BB: Glucose
transporters and insulin action - implications for insulin
resistance and diabetes mellitus. N Engl J Med. 341:248–257. 1999.
View Article : Google Scholar : PubMed/NCBI
|
|
27
|
Ye JM, Doyle PJ, Iglesias MA, Watson DG,
Cooney GJ and Kraegen EW: Peroxisome proliferator-activated
receptor (PPAR)-α activation lowers muscle lipids and improves
insulin sensitivity in high fat-fed rats: Comparison with PPAR-γ
activation. Diabetes. 50:411–417. 2001. View Article : Google Scholar : PubMed/NCBI
|
|
28
|
Escher P and Wahli W: Peroxisome
proliferator-activated receptors: Insight into multiple cellular
functions. Mutat Res. 448:121–138. 2000. View Article : Google Scholar : PubMed/NCBI
|
|
29
|
Schoonjans K, Peinado-Onsurbe J, Lefebvre
AM, Heyman RA, Briggs M, Deeb S, Staels B and Auwerx J: PPARα and
PPARγ activators direct a distinct tissue-specific transcriptional
response via a PPRE in the lipoprotein lipase gene. EMBO J.
15:5336–5348. 1996.PubMed/NCBI
|
|
30
|
Kliewer SA, Umesono K, Noonan DJ, Heyman
RA and Evans RM: Convergence of 9-cis retinoic acid and peroxisome
proliferator signalling pathways through heterodimer formation of
their receptors. Nature. 358:771–774. 1992. View Article : Google Scholar : PubMed/NCBI
|
|
31
|
Schoonjans K, Watanabe M, Suzuki H,
Mahfoudi A, Krey G, Wahli W, Grimaldi P, Staels B, Yamamoto T and
Auwerx J: Induction of the acyl-coenzyme A synthetase gene by
fibrates and fatty acids is mediated by a peroxisome proliferator
response element in the C promoter. J Biol Chem. 270:19269–19276.
1995. View Article : Google Scholar : PubMed/NCBI
|
|
32
|
Louet JF, Chatelain F, Decaux JF, Park EA,
Kohl C, Pineau T, Girard J and Pegorier JP: Long-chain fatty acids
regulate liver carnitine palmitoyltransferase 1 gene (L-CPT I)
expression through a peroxisome proliferator-activated receptor α
(PPARα)-independent pathway. Biochem J. 354:189–197. 2001.
View Article : Google Scholar : PubMed/NCBI
|
|
33
|
Hertz R, Bishara-Shieban J and Bar-Tana J:
Mode of action of peroxisome proliferators as hypolipidemic drugs.
Suppression of apolipoprotein C-III. J Biol Chem. 270:13470–13475.
1995. View Article : Google Scholar : PubMed/NCBI
|
|
34
|
Chen WL, Wei HW, Chiu WZ, Kang CH, Lin TH,
Hung CC, Chen MC, Shieh MS, Lee CC and Lee HM: Metformin regulates
hepatic lipid metabolism through activating AMP-activated protein
kinase and inducing ATGL in laying hens. Eur J Pharmacol.
671:107–112. 2011. View Article : Google Scholar : PubMed/NCBI
|
|
35
|
Musi N, Hirshman MF, Nygren J, Svanfeldt
M, Bavenholm P, Rooyackers O, Zhou G, Williamson JM, Ljunqvist O,
Efendic S, et al: Metformin increases AMP-activated protein kinase
activity in skeletal muscle of subjects with type 2 diabetes.
Diabetes. 51:2074–2081. 2002. View Article : Google Scholar : PubMed/NCBI
|
|
36
|
Schreurs M, Kuipers F and van der Leij FR:
Regulatory enzymes of mitochondrial beta-oxidation as targets for
treatment of the metabolic syndrome. Obes Rev. 11:380–388. 2010.
View Article : Google Scholar : PubMed/NCBI
|
|
37
|
Clarke SD and Jump DB: Regulation of gene
transcription by polyunsaturated fatty acids. Prog Lipid Res.
32:139–149. 1993. View Article : Google Scholar : PubMed/NCBI
|
|
38
|
Lingvay I, Raskin P and Szczepaniak LS:
Effect of insulin-metformin combination on hepatic steatosis in
patients with type 2 diabetes. J Diabetes Complications.
21:137–142. 2007. View Article : Google Scholar : PubMed/NCBI
|
|
39
|
Bhalla K, Hwang BJ, Dewi RE, Twaddel W,
Goloubeva OG, Wong KK, Saxena NK, Biswal S and Girnun GD: Metformin
prevents liver tumorigenesis by inhibiting pathways driving hepatic
lipogenesis. Cancer Prev Res (Phila). 5:544–552. 2012. View Article : Google Scholar : PubMed/NCBI
|
|
40
|
Roden M: Mechanisms of disease: Hepatic
steatosis in type 2 diabetes - pathogenesis and clinical relevance.
Nat Clin Pract Endocrinol Metab. 2:335–348. 2006. View Article : Google Scholar : PubMed/NCBI
|
|
41
|
He J, Jiang H, Tansey JT, Tang C, Pu S and
Xu G: Calyculin and okadaic acid promote perilipin phosphorylation
and increase lipolysis in primary rat adipocytes. Biochim Biophys
Acta. 1761:247–255. 2006. View Article : Google Scholar : PubMed/NCBI
|
|
42
|
Sztalryd C, Xu G, Dorward H, Tansey JT,
Contreras JA, Kimmel AR and Londos C: Perilipin A is essential for
the translocation of hormone-sensitive lipase during lipolytic
activation. J Cell Biol. 161:1093–1103. 2003. View Article : Google Scholar : PubMed/NCBI
|
|
43
|
Ren T, He J, Jiang H, Zu L, Pu S, Guo X
and Xu G: Metformin reduces lipolysis in primary rat adipocytes
stimulated by tumor necrosis factor-α or isoproterenol. J Mol
Endocrinol. 37:175–183. 2006. View Article : Google Scholar : PubMed/NCBI
|
|
44
|
Yang Q, Graham TE, Mody N, Preitner F,
Peroni OD, Zabolotny JM, Kotani K, Quadro L and Kahn BB: Serum
retinol binding protein 4 contributes to insulin resistance in
obesity and type 2 diabetes. Nature. 436:356–362. 2005. View Article : Google Scholar : PubMed/NCBI
|
|
45
|
Fischer CP, Perstrup LB, Berntsen A,
Eskildsen P and Pedersen BK: Elevated plasma interleukin-18 is a
marker of insulin-resistance in type 2 diabetic and non-diabetic
humans. Clin Immunol. 117:152–160. 2005. View Article : Google Scholar : PubMed/NCBI
|
|
46
|
Cho YM, Youn BS, Lee H, Lee N, Min SS,
Kwak SH, Lee HK and Park KS: Plasma retinol-binding protein-4
concentrations are elevated in human subjects with impaired glucose
tolerance and type 2 diabetes. Diabetes Care. 29:2457–2461. 2006.
View Article : Google Scholar : PubMed/NCBI
|
|
47
|
Gavi S, Stuart LM, Kelly P, Melendez MM,
Mynarcik DC, Gelato MC and McNurlan MA: Retinol-binding protein 4
is associated with insulin resistance and body fat distribution in
nonobese subjects without type 2 diabetes. J Clin Endocrinol Metab.
92:1886–1890. 2007. View Article : Google Scholar : PubMed/NCBI
|
|
48
|
Tajtáková M, Semanová Z, Ivancová G,
Petrovicová J, Donicová V and Zemberová E: Serum level of
retinol-binding protein 4 in obese patients with insulin resistance
and in patients with type 2 diabetes treated with metformin. Vnitr
Lek. 53:960–963. 2007.[(In Slovak)]. PubMed/NCBI
|
|
49
|
Fang P, Shi M, Yu M, Guo L, Bo P and Zhang
Z: Endogenous peptides as risk markers to assess the development of
insulin resistance. Peptides. 51:9–14. 2014. View Article : Google Scholar : PubMed/NCBI
|
|
50
|
Stoffers DA: The development of beta-cell
mass: Recent progress and potential role of GLP-1. Horm Metab Res.
36:811–821. 2004. View Article : Google Scholar : PubMed/NCBI
|
|
51
|
Butler AE, Janson J, Bonner-Weir S, Ritzel
R, Rizza RA and Butler PC: Beta-cell deficit and increased
beta-cell apoptosis in humans with type 2 diabetes. Diabetes.
52:102–110. 2003. View Article : Google Scholar : PubMed/NCBI
|
|
52
|
Cozar-Castellano I, Fiaschi-Taesch N,
Bigatel TA, Takane KK, Garcia-Ocaña A, Vasavada R and Stewart AF:
Molecular control of cell cycle progression in the pancreatic
beta-cell. Endocr Rev. 27:356–370. 2006. View Article : Google Scholar : PubMed/NCBI
|
|
53
|
Kahn SE, Hull RL and Utzschneider KM:
Mechanisms linking obesity to insulin resistance and type 2
diabetes. Nature. 444:840–846. 2006. View Article : Google Scholar : PubMed/NCBI
|
|
54
|
Marchetti P, Del Guerra S, Marselli L,
Lupi R, Masini M, Pollera M, Bugliani M, Boggi U, Vistoli F, Mosca
F and Del Prato S: Pancreatic islets from type 2 diabetic patients
have functional defects and increased apoptosis that are
ameliorated by metformin. J Clin Endocrinol Metab. 89:5535–5541.
2004. View Article : Google Scholar : PubMed/NCBI
|
|
55
|
Kral JG, Thung SN, Biron S, Hould FS,
Lebel S, Marceau S, Simard S and Marceau P: Effects of surgical
treatment of the metabolic syndrome on liver fibrosis and
cirrhosis. Surgery. 135:48–58. 2004. View Article : Google Scholar : PubMed/NCBI
|
|
56
|
Kirpichnikov D, McFarlane SI and Sowers
JR: Metformin: An update. Ann Intern Med. 137:25–33. 2002.
View Article : Google Scholar : PubMed/NCBI
|