Introduction
Diabetes is the most prevalent disease worldwide.
According to the World Health Organization, ~9.5% of the adult
population (~347 million individuals) were suffering from diabetes
in 2008, and the number is expected to double by 2030 (1). As one of the major complications of
diabetes, diabetic nephropathy (DN) is now the most common cause of
end-stage renal disease, particularly in Western countries
(2). Hypertension and poor glycemic
control are the major clinical associations that frequently precede
overt DN (3). In clinical terms, the
condition is characterized by the development of proteinuria,
specifically albuminuria, with a subsequent reduction in the
glomerular filtration rate. DN can progress over a period of 10–20
years; if left untreated, the resulting uremia is fatal (4). The histological characteristics of DN
include mesangial expansion, thickening of the glomerular basement
membrane and podocyte effacement, in addition to glomerular
sclerosis (5,6). DN is one of the direct causes of
mortality in diabetic patients. The db/db mouse is an obese
hyperinsulinemic model of genetic diabetes. This animal model
develops abnormalities in renal function and renal morphology that
parallel those in the nephropathy of patients with type 2 diabetes
(7); therefore, the db/db
mouse is a useful animal model for investigating the
pathophysiology of DN and exploring an effective therapy for the
disease.
During the past two decades, a novel class of
non-coding RNA, microRNAs (miRNAs), has been found to be expressed
in all tissues and to play essential roles in tissue homeostasis
and disease progression (8,9). miRNAs are endogenous, single-stranded
RNA molecules of ~22 nucleotides in length that regulate target
mRNAs at the post-transcriptional level via base-pairing to target
mRNAs. miRNAs are predicted to control the activity of >60% of
all protein-coding genes by repressing translation and/or bringing
about the deadenylation and subsequent degradation of target mRNAs
(10). Thus, miRNA deregulation
often causes impaired cellular function and disease development. An
enhanced understanding of the regulation and function of miRNAs in
renal pathology could highlight certain miRNAs as novel therapeutic
targets in kidney fibrosis and its associated diseases. In the
present study, a high-throughput technology, the miRNA microarray,
was utilized in order to identify DN-related miRNAs and determine
the role of selected miRNAs in the progression of DN, using
db/db DN mouse models.
Materials and methods
Animals
C57BL/KsJ-db/db mice and their littermate
db/m mice were purchased from the Model Animal Research
Center at Nanjing University (Nanjing, China) and housed in
accordance with the National Institutes of Health Guide for the
Care and Use of Laboratory Animals. The experimental protocols of
the present study were approved by the Animal Care Committee at
Hubei University of Medicine (Shiyan, China). The db/db mice
were determined to be diabetic on the basis of obesity and
hyperglycemia at ~4 weeks of age. The mice were subject to right
uninephrectomy under anesthesia at various time-points, depending
on the experiment design. Anesthesia was performed using
intraperitoneal injection of pentobarbital (90 mg/kg; Shanghai
Chemical Reagent Co., Ltd., Shanghai, China), and the mice were
sacrificed by cervical dislocation following anesthesia.
RNA isolation and miRNA microarray
analysis
Mouse kidney tissue (~100 mg), taken from the renal
cortices of DN or control mice, was added into 1 ml TRIzol® reagent
(Invitrogen Life Technologies, Carlsbad, CA, USA) in a 1.5-ml
Eppendorf tube. The tissue was homogenized by RNase-free pestles
followed by the addition of chloroform (400 µl). Total RNA was
extracted from the TRIzol-chloroform mixture using the miRNeasy
Mini kit (Qiagen, Valencia, CA, USA). Total RNA was eluted in 100
µl nuclease-free water, and the concentration was measured using
the NanoDrop™ 8000 spectrophotometer (Thermo Fisher Scientific,
Inc., Wilmington, DE, USA). Samples with an
A260/A280 ratio >1.8 were considered pure.
The RNA integrity was verified by rRNA visualization following
electrophoresis in an agarose gel.
miRNA microarray analysis
The differential expression profile of the miRNAs
was assayed using the miRMouse miRNA array (Exiqon miRCURY LNA™
miRNA; Exiqon A/S, Vedbaek, Denmark), which contained 1,181 capture
probes, in db/db DN mice and db/m controls. Following
RNA isolation from the samples, the microarray labeling and array
hybridization procedure were performed according to the
manufacturer's instructions. Upon the completion of the
hybridization procedure, the slides were produced and dried by
centrifugation. The slides were then scanned using a SureScan
Microarray Scanner (Agilent Technologies, Santa Clara, CA,
USA).
cDNA synthesis and quantitative
polymerase chain reaction (qPCR) analysis
qPCR was performed to validate the miRNA expression
profiles identified with the miRNA array. The first-strand cDNA was
synthesized using the PrimeScript Reverse Transcription reagent kit
(Clontech Laboratories, Inc., Mountain View, CA, USA) with
oligonucleotide dTs. The cDNA levels for each tested miRNA and
GAPDH gene transcripts were measured using a 7900HT Fast Real-Time
PCR system (Applied Biosystems, Foster City, CA, USA) according to
the manufacturer's instructions. Each amplification reaction was
performed in triplicate in separate tubes. The average calculated
from the three threshold cycles was used to determine the number of
transcripts in the sample. miRNA expression was quantitatively
expressed in arbitrary units as the ratio of the target sample
quantity to the calibrator or to the mean values of the control
samples. All values were normalized to the endogenous control
GAPDH. qPCR was also used to detect SMAD3/4 expression, with
primers provided by Sangon Biotech Co., Ltd. (Shanghai, China).
miR-346-bearing plasmid construction
and administration
The miR-346 expression vector was constructed
according to the miR-346 sequence (accession no. MI0000634;
http://www.mirbase.org/) using the SacI
cloning site of pGenesil-1. Recombinant pGenesil-miR-346 and
control pGenesil-1 were provided by Guangzhou RiboBio Co., Ltd.
(Guangzhou, China). Starting at week 8, three groups of
db/db DN mice (6 mice/group) were intravenously injected an
miR-346-bearing plasmid (pGenesil-miR-346, 30 mg/kg), a plasmid
control (pGenesil-1, 30 mg/kg) and an untreated control (same
volume of saline), respectively. The injection was administered
through the tail vein once a week until week 16. The urinary
protein content, body weight and blood glucose were dynamically
monitored. At week 16, all animals were sacrificed, and their renal
cortex tissues were sampled for molecular analysis and
morphological examinations.
Immunoblot analysis
Immunoblot analysis was used to detect SMAD3/4
expression in the renal tissues. The renal tissue samples were
harvested from miR-346-treated (pGenesil-miR-346), plasmid-treated
(pGenesil-1) and untreated control mice at week 16. The tissue
samples were homogenized with Kontes pellet pestle cordless motor
(Thermo Fisher Scientific, Inc.) and lysed with cell lysis solution
(Bio-Rad Laboratories, Inc., Hercules, CA, USA), and the tissue
lysates were subjected to an immunoblotting analysis as previously
described (11). The total protein
was quantified using Pierce BCA protein assay kit (Life
Technologies). Briefly, tissue lysates (50 µg) were separated
through 12% denaturing sodium dodecyl sulfate-polyacrylamide gel
electrophoresis and transferred to a nitrocellulose membrane. The
membrane was incubated overnight with rabbit anti-SMAD3/4
polyclonal antibodies (1:1,000; #9523; Cell Signaling Technology,
Inc., Boston, MA, USA). After three washes with Tris-buffered
saline/0.05% Tween-20, the membrane was incubated for 1 h with goat
anti-rabbit immunoglobulin G conjugated to horseradish peroxidase
(1:2,500; Santa Cruz Biotechnology, Inc., Santa Cruz, CA, USA).
Then, the membrane was washed three times with Tris-buffered
saline/0.05% Tween-20, followed by a final wash with Tris-buffered
saline without Tween-20. The blot was developed using enhanced
chemiluminescence detection (Beyotime Institute of Biotechnology,
Shanghai, China). β-actin was used as a loading control.
Renal tissue staining
The Periodic acid Schiff (PAS) protocol was used for
renal tissue staining. Tissue sections (~5 µm) were mounted on
slides and stained with a PAS staining kit (Sigma-Aldrich, St.
Louis, MO, USA), as per the manufacturer's instructions.
Statistical analysis
Scanned images from the microarray were imported
into miRCURY LNA software (Exiqon A/S) for grid alignment and data
extraction. Expressed data were normalized using median
normalization. The numerical results are expressed as the mean ±
standard error of the mean, with ‘n’ representing the number of
animals. Groups were compared using one-way analysis of variance
and subsequently using the Student-Newman-Keuls and Dunnett tests
for multiple comparisons. P<0.05 was considered to indicate a
statistically significant difference.
Results
Demonstration of DN in db/db mice
The blood glucose, body weight and urinary proteins
of the DN mice were dynamically observed for 16 weeks (Table I). Starting from week 4, the blood
glucose level and body weight of the db/db mice were
significantly higher than those of the db/m control mice
(P<0.05), thereby confirming the development of DN in the
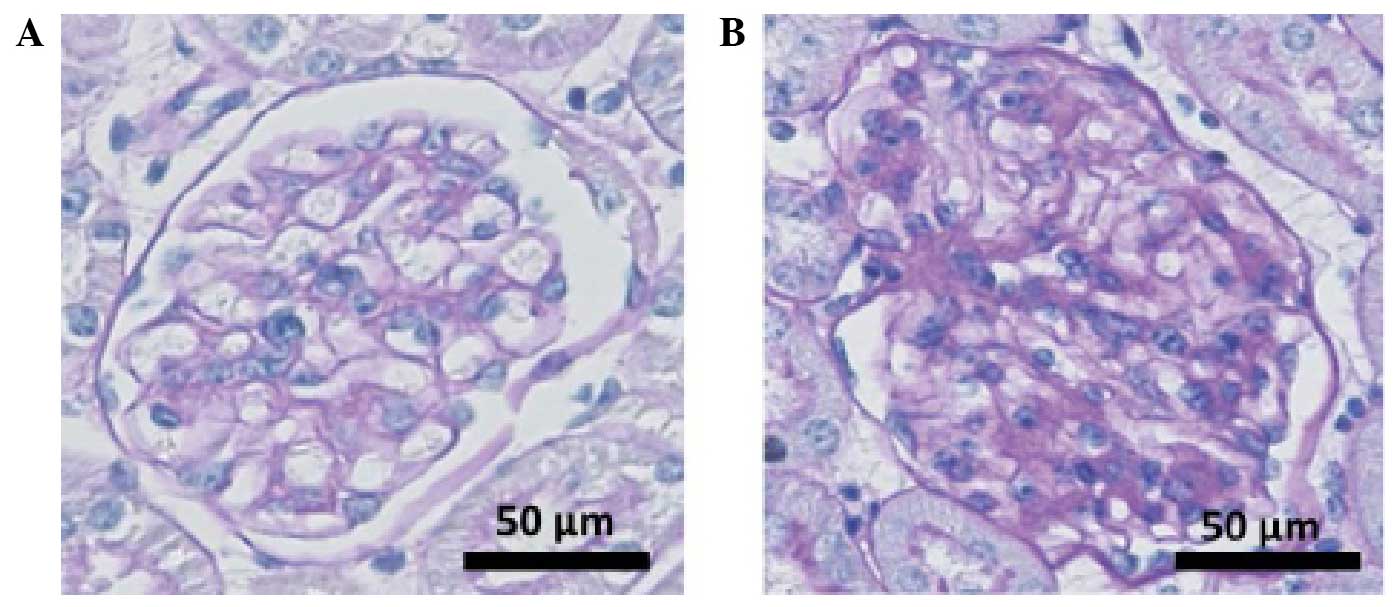
db/db mice. Fig. 1 shows the
glomerular pathologies of the db/db and db/m mice at
the end of the observation period (week 18). Typical DN changes
were observed in the db/db mouse kidney, including
glomerular hypertrophy, mesangial cell proliferation and matrix
accumulation. The results indicated the development of DN in the
db/db mice.
 | Table I.Dynamic observation of body weight,
blood glucose and proteinuria. |
Table I.
Dynamic observation of body weight,
blood glucose and proteinuria.
| Time-point | Body weight (g) | Blood glucose
(mmol/l) | Proteinuria (µg/24
h) |
|---|
| Week 4 |
|
|
|
|
Control |
15.11±1.64 |
6.45±0.75 |
8.76±2.01 |
| DN |
18.65±1.23a |
8.75±1.45a |
9.54±2.43 |
| Week 8 |
|
|
|
|
Control |
18.23±1.46 |
6.92±0.56 |
9.65±2.38 |
| DN |
37.38±1.94a |
26.45±3.12a |
89.13±12.64a |
| Week 12 |
|
|
|
|
Control |
21.71±1.92 |
7.75±1.46 |
10.01±2.48 |
| DN |
46.82±2.32a |
36.42±4.12a |
158.73±22.16a |
| Week 16 |
|
|
|
|
Control |
24.56±1.86 |
8.21±1.66 |
10.54±3.14 |
| DN |
50.12±2.75a |
40.98±4.77a |
209.72±22.88a |
miRNA profiling of the db/db mice
An miRNA microarray was used to identify the miRNA
profiles of the mouse DN model. To ensure the reliable performance
of the microarray and qPCR, RNA samples isolated from the renal
cortices of DN and control animals were verified prior to the miRNA
array being performed. The RNA purity was confirmed by a 260/280
optical density value of 1.8–2.0 in both DN (n=6) and
control groups (n=6). The RNA samples were also assessed for
degradation status by agarose gel electrophoresis. Three RNA
samples were randomly selected from the DN and control groups and
were subjected to subsequent Cy3 and Cy5 labeling and hybridization
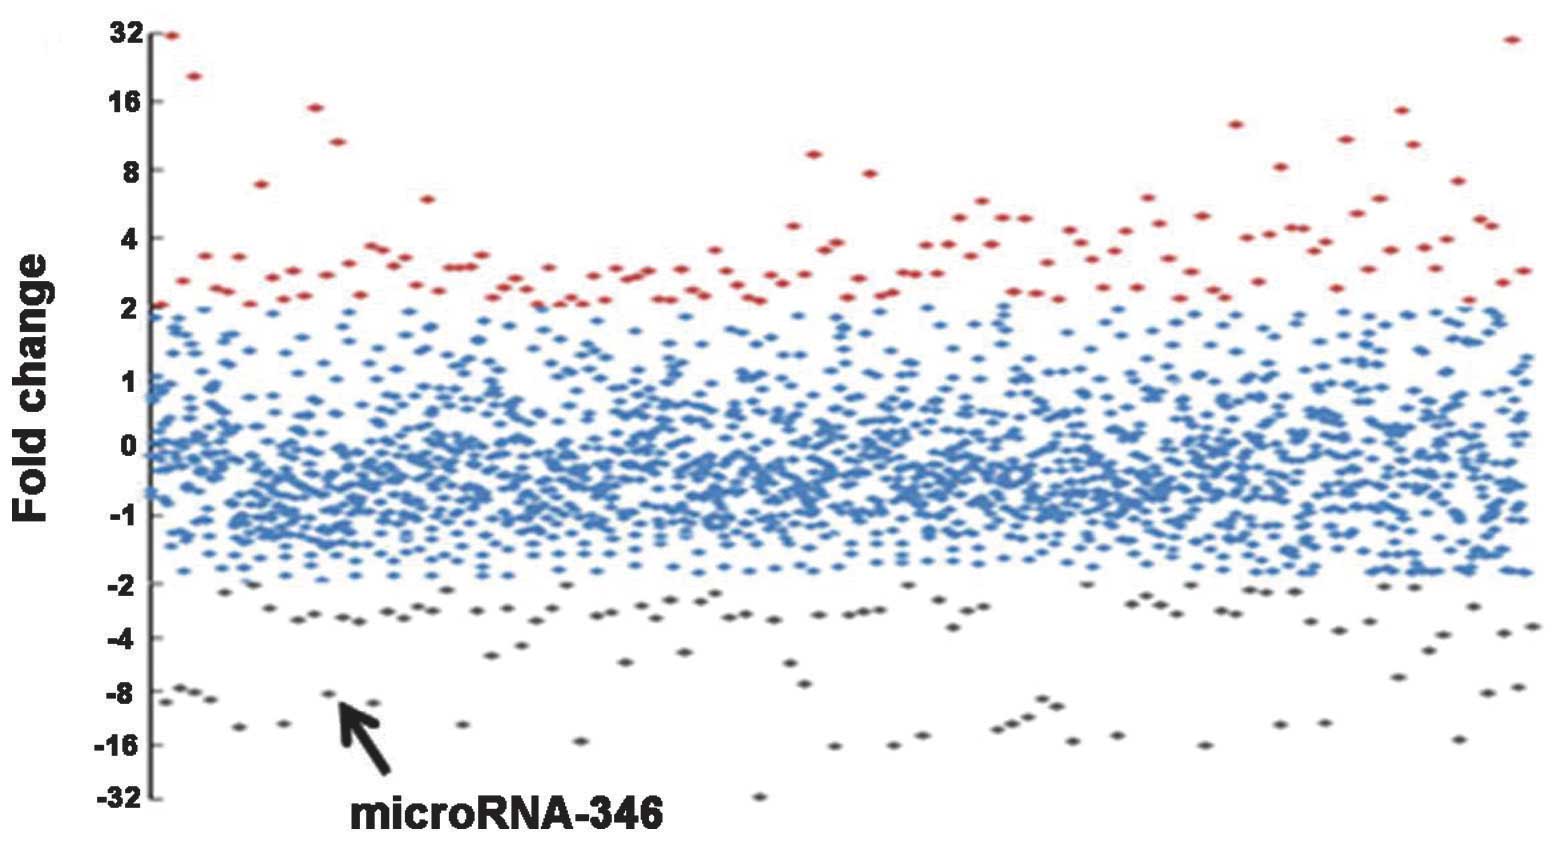
with the Exiqon miRNA array. The microarray data demonstrated that
the db/db DN mice had a significantly altered miRNA profile
compared with the db/m control mice. An overview of the
miRNA expression is shown in Fig. 2.
In total, 772 and 433 miRNAs were detected for expression in the DN
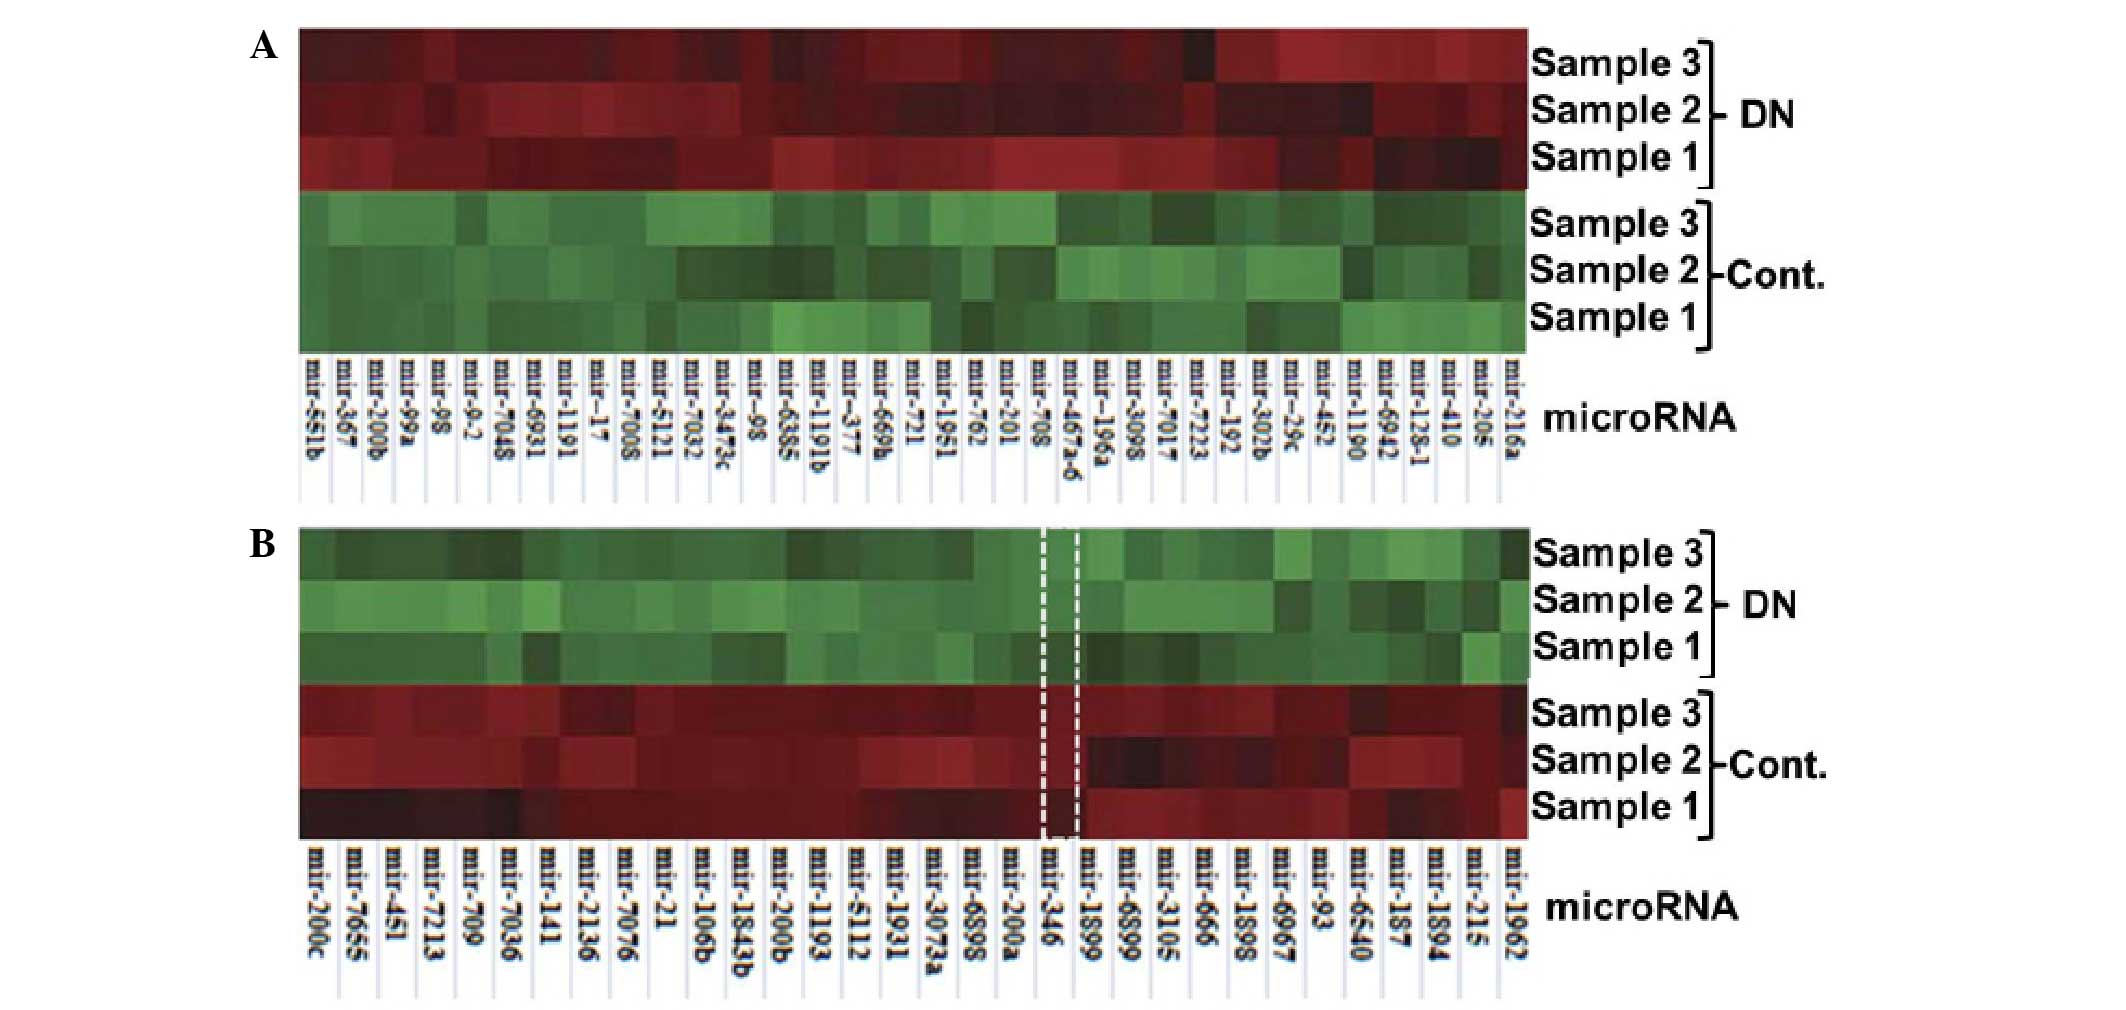
and control mice, respectively. Compared with the control, 219
miRNAs were differentially expressed by >2-fold, and 71 miRNAs
had a difference of >4-fold in the DN mice. Among these 71
miRNAs, 39 miRNAs were upregulated (Fig.
3A) and 31 miRNAs were downregulated (Fig. 3B).
To validate the expression profile obtained from the
miRNA microarray analysis, 10 downregulated miRNAs (miR-215,
miR-451, miR-200a, miR-200b, miR-200c, miR-141, miR-21, miR-346,
miR-709 and miR-187) and 8 upregulated miRNAs (miR-29c, miR-192,
miR-216a, miR-17, miR-377, miR-196a, miR-166 and miR-98) were
quantitatively examined using qPCR analysis. As shown in Table II, consistent fold changes were
observed between the qPCR and microarray for the selected miRNAs,
indicating the reliability of the miRNA microarray analysis under
the present experimental conditions.
| Table II.Fold changes in the miRNA expression
in DN mice, as determined by qPCR and microarray analyses. |
Table II.
Fold changes in the miRNA expression
in DN mice, as determined by qPCR and microarray analyses.
| miRNAs | qPCRa | miRNA
arrayb |
|---|
| Downregulated
miRNAs |
|
|
|
miRNA-215 | −4.23 | −5.11 |
|
miRNA-346 | −8.12 | −8.20 |
|
miRNA-200a | −12.32 | −13.76 |
|
miRNA-200b | −14.13 | −10.22 |
|
miRNA-200c | −13.11 | −7.75 |
|
miRNA-141 | −6.14 | −8.13 |
|
miRNA-21 | −2.55 | −4.76 |
|
miRNA-45 l | −1.89 | −4.12 |
|
miRNA-709 | −2.33 | −5.54 |
|
miRNA-187 | −7.32 | −6.93 |
| Upregulated
miRNAs |
|
|
|
miRNA-29c | 3.45 | 5.67 |
|
miRNA-192 | 2.11 | 4.35 |
|
miRNA-216a | 1.98 | 5.76 |
|
miRNA-166 | 10.12 | 8.20 |
|
miRNA-17 | 5.44 | 6.45 |
|
miRNA-377 | 7.88 | 10.12 |
|
miRNA-196a | 4.65 | 4.32 |
|
miRNA-98 | 2.35 | 4.03 |
miR-346 target prediction
Target predictions were based on the detected
expression profiles of the miRNAs. Considering glomerular fibrosis
as a major process during the pathogenesis of DN, the target
searching was focused on fibrosis-related mRNAs. As guided by Krek
et al (12), the PicTar
algorithm and the microRNA.org website (http://www.microrna.org/) were used to identify
potential mRNA targets of the miRNAs found to be differentially
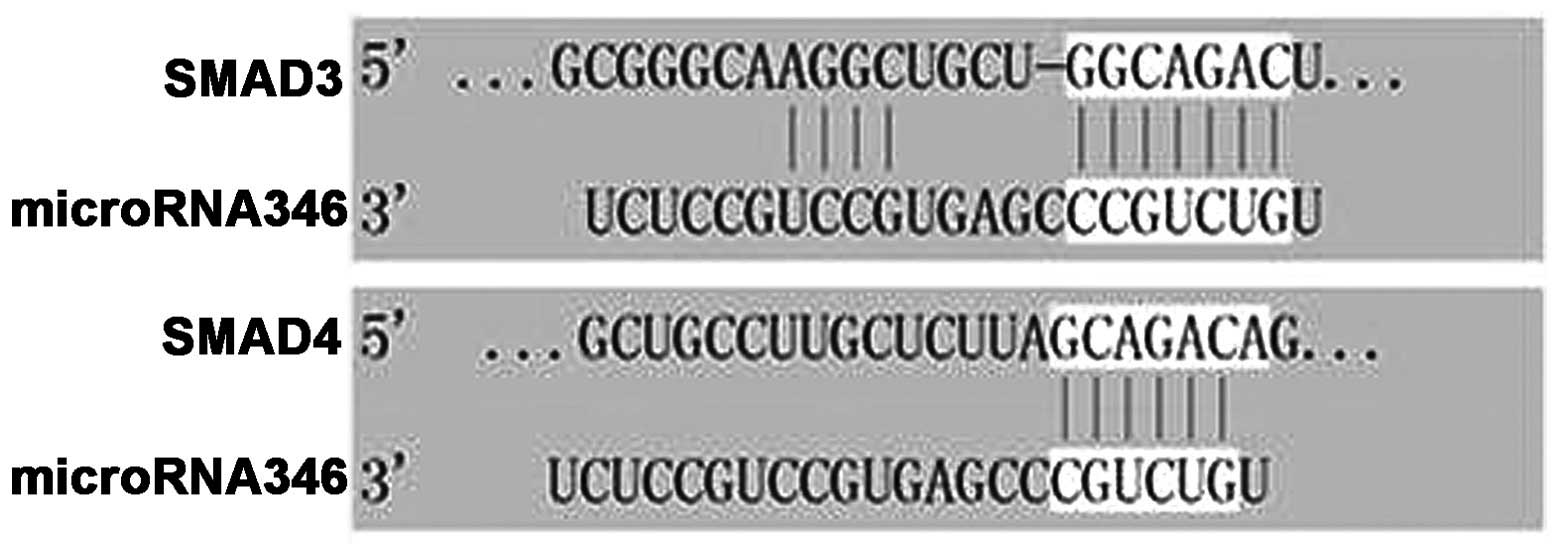
regulated in the DN mice. Among the 71 most differentially
expressed miRNAs, miR-346 was identified a SMAD family-related
miRNA that has not been well characterized in this regard. Of the
95 potential targets for miR-346, SMAD3 and SMAD4 were closely
associated with fibrogenesis. As shown in Fig. 4, miR-346 has 6–11 complementary
binding sites in the 3′-untranslated region (3′-UTR) of
SMAD3/4.
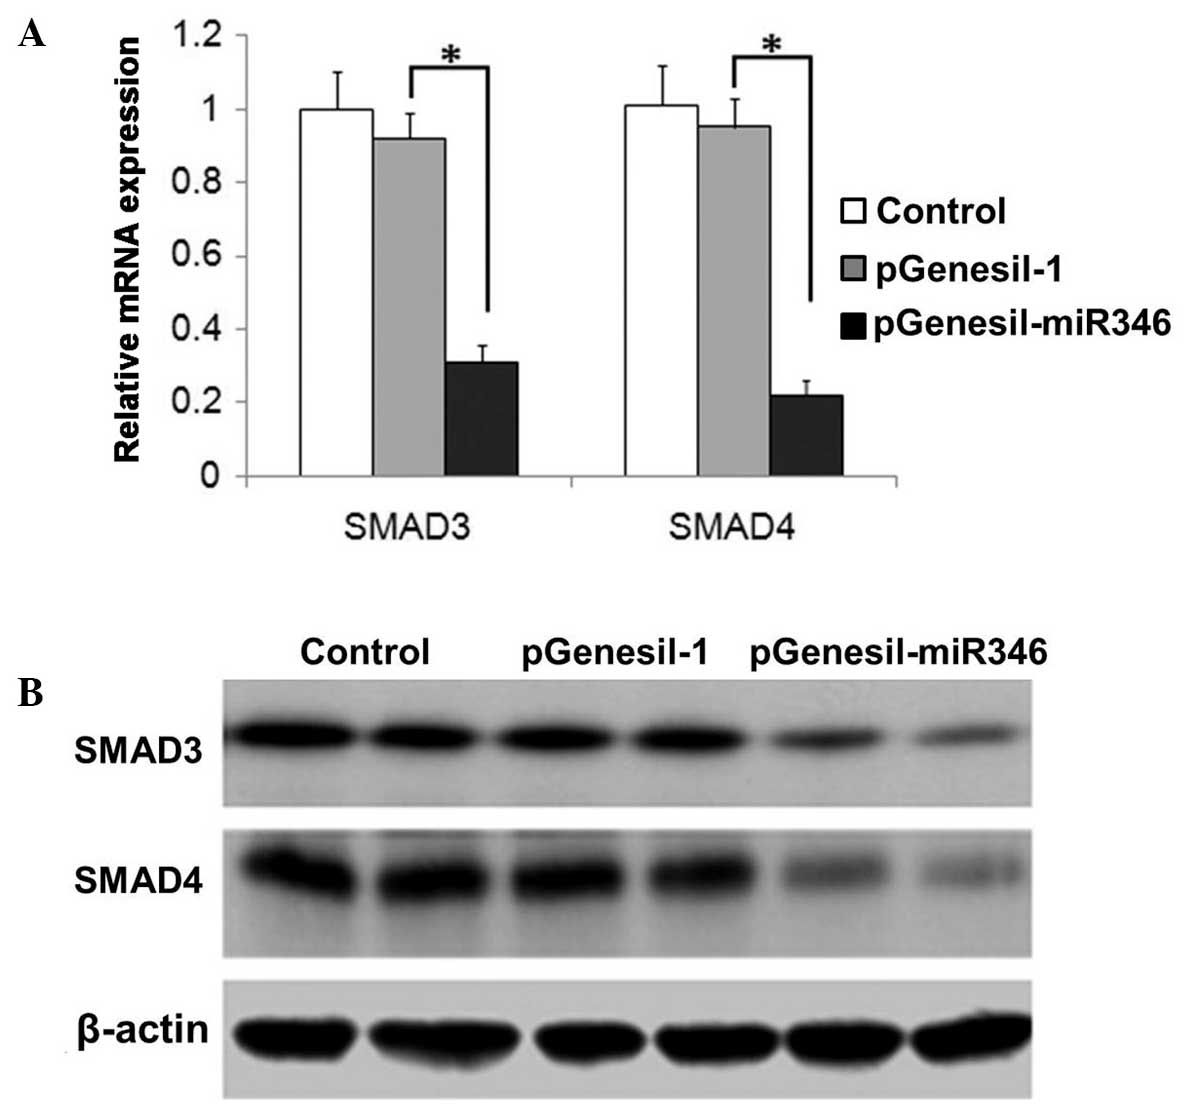
Effect of miR-346 on SMAD3/4
expression in the renal tissue of DN mice
As shown in Fig. 5A and
B, the expression of SMAD3/4 was significantly attenuated by
miR-346 administration, which was demonstrated in the analysis of
both mRNA and protein levels.
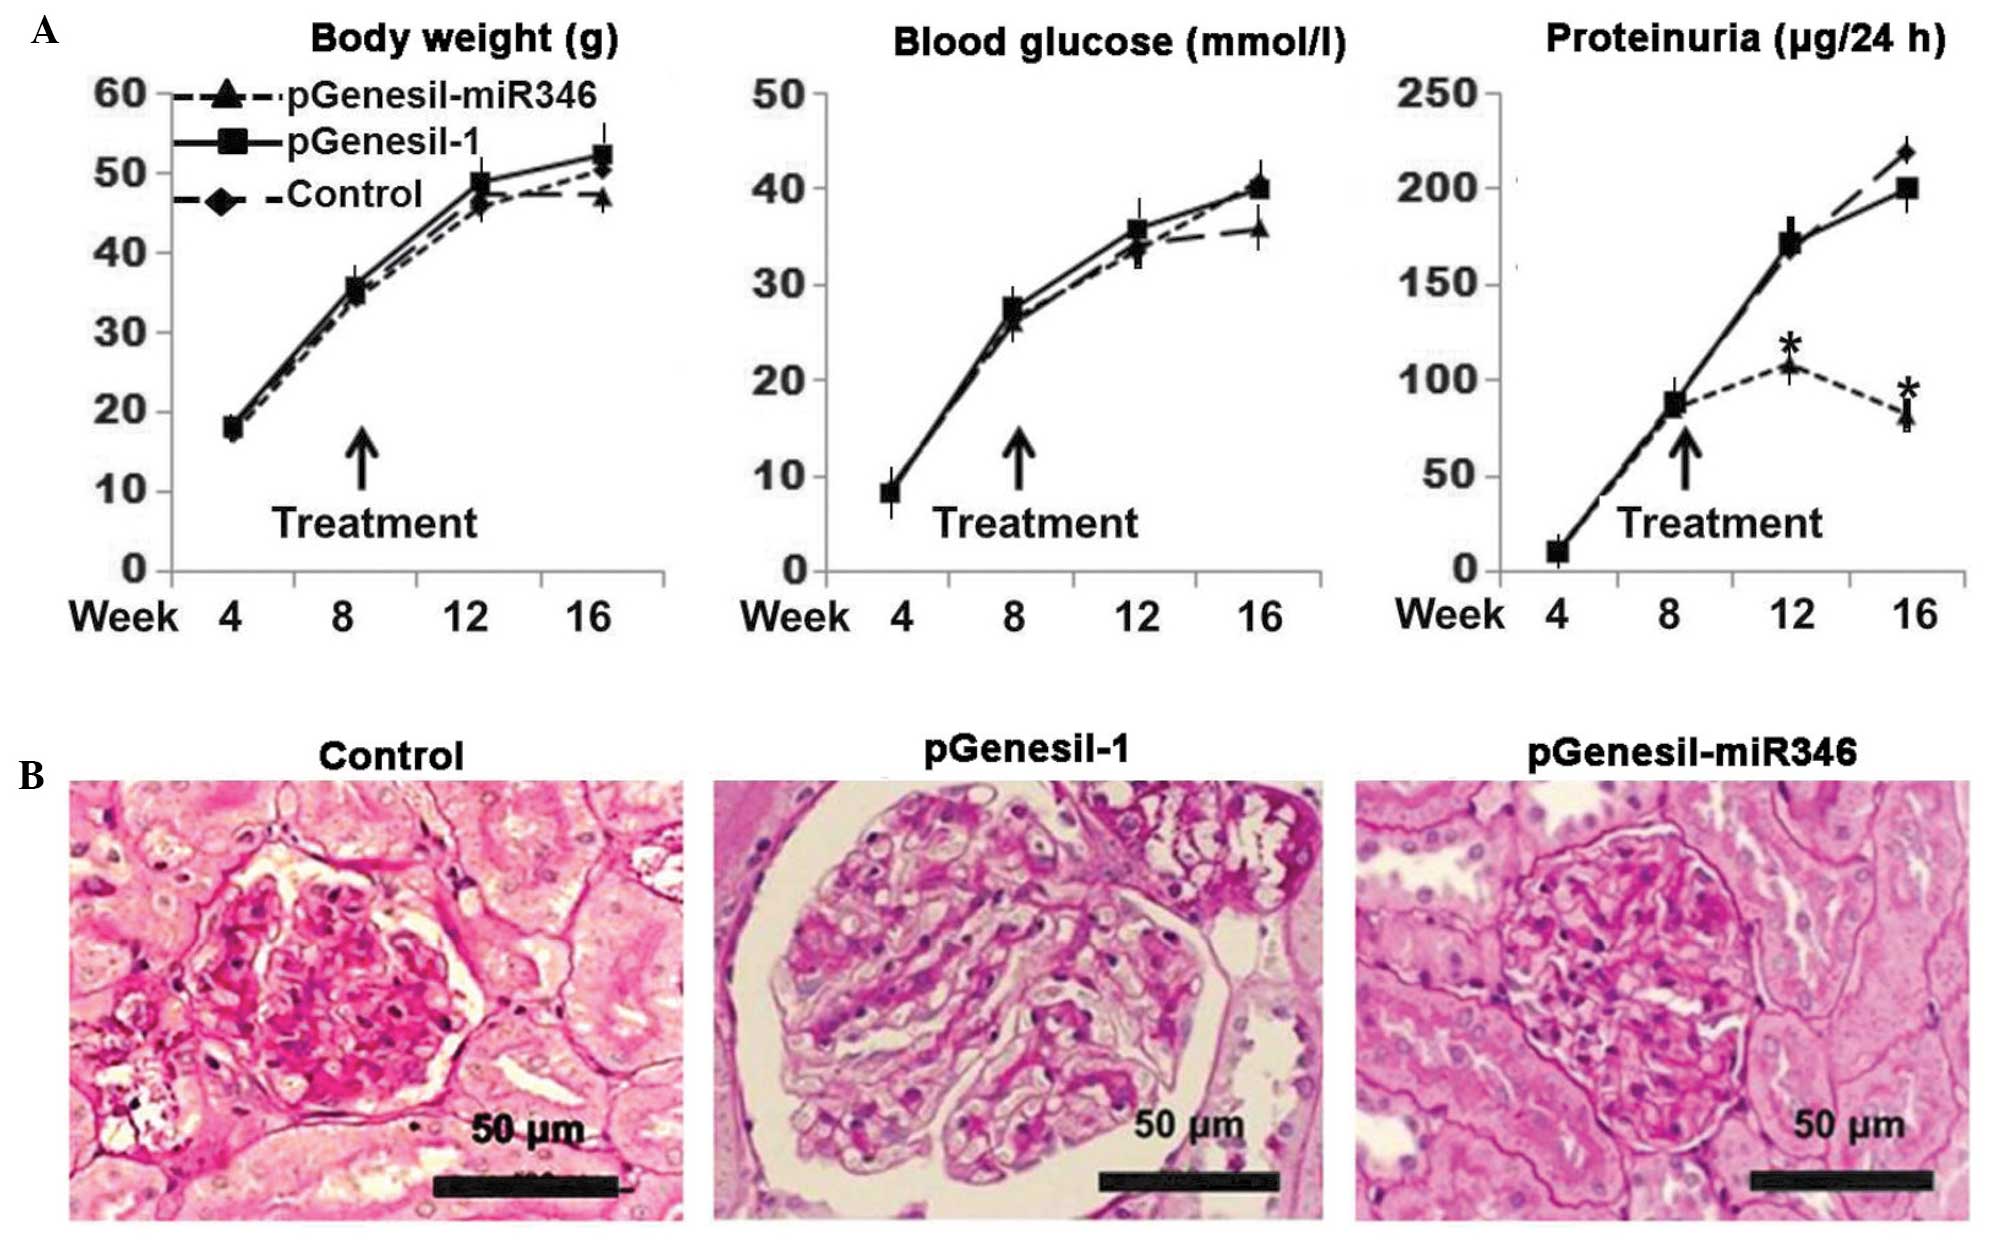
Therapeutic efficacy of miR-346 in
db/db DN mice
As shown in Fig. 6A,
a significant improvement in the proteinuria was observed with
pGenesil-miR-346 administration, although the changes in the body
weight and blood glucose level remained consistent with the
controls. As can be noted in Fig.
6B, typical DN glomerular alterations were present in both the
plasmid-treated and untreated controls, exhibiting matrix
accumulation, glomerular hypertrophy and mesangial cell
proliferation; however, the db/db mice treated with
pGenesil-miR-346 exhibited a normal glomerular histology.
Discussion
DN as a consequence of types 1 and 2 diabetes is the
major cause of end-stage renal disease worldwide. The glomerular
histology is characterized by mesangial expansion, glomerular
basement membrane thickening and glomerular sclerosis (13). Mesangial fibrogenesis plays an
important role during DN progression, and the SMAD signaling
pathway is widely recognized to be a major regulator responsible
for the fibrogenesis. Several miRNAs have been proven to be closely
associated with DN, and their pathophysiological effects in chronic
kidney disease have been studied, including miR-192 (14), miR-29a (15), miR-377 (16), miR-200a, miR-200b, miR-205, miR-141
and miR-429 (17). The
C57BL/KsJ-db/db (db/db) mouse is one of the most
widely used models for diabetes-induced nephropathy research. In
the present study, the expression of 772 miRNAs was detected in the
renal tissues of db/db DN mice, and 219 of the miRNAs were
differentially expressed >2-fold compared with the db/m
control mice (Fig. 2). The miRNA
microarray results were verified by confirmatory qPCR (Table II). Among the 71 most differentially
expressed miRNAs, miR-346 was identified as a SMAD family-related
miRNA that has not been well characterized. Through target
prediction analysis, SMAD3 and SMAD4 (SMAD3/4) were identified to
be in the list of 95 potential targets for miR-346. There existed
6–11 complementary binding sites in the 3′-UTR of SMAD3/4 (Fig. 4). To the best of our knowledge, this
is the first time that miR346 has been identified as a regulator of
SMAD3/4.
The regulatory action of miRNA is mainly achieved
through the competitive crosstalk between miRNA and the targeted
mRNA (18). The primary underlying
mechanism involves the interaction between the miRNAs and the
3′-UTR of protein-coding genes; this interaction typically results
in a decrease in protein output, either by mRNA degradation or by
translational repression, depending on the extent of the
complementary binding (19). As
demonstrated in Fig. 5, the
miR-346-induced inhibition of SMAD3/4 exhibited the same pattern in
both mRNA and protein levels, suggesting that miR-346-induced
SMAD3/4 mRNA degradation could be involved in the action. SMAD3/4
plays an important role in transforming growth factor
(TGF)-β-mediated fibrogenesis through SMAD3/4 interactions with the
promoter of the collagen type 1α2 gene (20,21).
TGF-β has been considered to be a key mediator in renal fibrosis,
predominantly through the activation of its downstream SMAD
signaling pathway. The emerging role of miRNAs in TGF-β-mediated
renal fibrosis has been documented in the past 5 years (22). TGF-β1-upregulated miRNAs include
miR-377, miR-21, miR-93, miR-216a and miR-192, whereas the miR-29
and miR-200 families are downregulated by TGF-β1. Notably, the
majority of this research has focused on miRNAs that target
molecules involved in renal fibrosis via effects elicited by TGF-β
(4); however, the interaction
between miR-346 and TGF-β has not been explored in the present
study.
In this study, an miR-346-bearing plasmid was used
to verify the therapeutic efficacy of miR-346 on DN in db/db
mice. During the period of treatment (up to 8 weeks) the blood
glucose level and body weight were not affected by the
administration of miR346 (Fig. 6A);
however, almost from the initiation of the treatment, the
proteinuria was significantly improved. At the end of the
experiment, the glomerular histology was almost completely restored
to normal (Fig. 6B). The results
confirmed the therapeutic efficacy of miR-346 on DN in this
particular animal model. Further mechanism-related studies may lead
to the development of effective therapies for clinical DN.
In conclusion, miR-346 was identified for the first
time, to the best of our knowledge, as a negative regulator of
SMAD3/4. SMAD3/4 was upregulated in the renal tissue of
db/db mice. The administration of miR-346 attenuated the
SMAD3/4 expression in the renal tissue and ameliorated the renal
function and glomerular histology in the DN mice. The
identification and therapeutic efficacy of miR-346 in a
db/db mouse model may pave the way for clinical studies of
miR-346 in DN.
Acknowledgements
This study was supported by Taihe Hospital
Foundation. The authors are grateful to James Dai (LJ Resources
Co., Ltd., Vancouver, Canada) for his assistance in preparing the
manuscript and English proofreading.
References
|
1
|
Danaei G, Finucane MM, Lu Y, et al: Global
Burden of Metabolic Risk Factors of Chronic Diseases Collaborating
Group (Blood Glucose): National, regional, and global trends in
fasting plasma glucose and diabetes prevalence since 1980:
Systematic analysis of health examination surveys and
epidemiological studies with 370 country-years and 2.7 million
participants. Lancet. 378:31–40. 2011. View Article : Google Scholar : PubMed/NCBI
|
|
2
|
Gilbertson DT, Liu J, Xue JL, et al:
Projecting the number of patients with end-stage renal disease in
the United States to the year 2015. J Am Soc Nephrol. 16:3736–3741.
2005. View Article : Google Scholar : PubMed/NCBI
|
|
3
|
Hagiwara S, McClelland A and Kantharidis
P: MicroRNA in diabetic nephropathy: Renin angiotensin, aGE/RAGE,
and oxidative stress pathway. J Diabetes Res. 2013:1737832013.
View Article : Google Scholar : PubMed/NCBI
|
|
4
|
Forbes JM and Cooper ME: Mechanisms of
diabetic complications. Physiol Rev. 93:137–188. 2013. View Article : Google Scholar : PubMed/NCBI
|
|
5
|
Adler S: Diabetic nephropathy: Linking
histology, cell biology, and genetics. Kidney Int. 66:2095–2106.
2004. View Article : Google Scholar : PubMed/NCBI
|
|
6
|
Susztak K, Raff AC, Schiffer M and
Böttinger EP: Glucose-induced reactive oxygen species cause
apoptosis of podocytes and podocyte depletion at the onset of
diabetic nephropathy. Diabetes. 55:225–233. 2006. View Article : Google Scholar : PubMed/NCBI
|
|
7
|
Sharma K, McCue P and Dunn SR: Diabetic
kidney disease in the db/db mouse. Am J Physiol Renal Physiol.
284:F1138–F1144. 2003. View Article : Google Scholar : PubMed/NCBI
|
|
8
|
Yates LA, Norbury CJ and Gilbert RJ: The
long and short of microRNA. Cell. 153:516–519. 2013. View Article : Google Scholar : PubMed/NCBI
|
|
9
|
Soifer HS, Rossi JJ and Saetrom P:
MicroRNAs in disease and potential therapeutic applications. Mol
Ther. 15:2070–2079. 2007. View Article : Google Scholar : PubMed/NCBI
|
|
10
|
Fabian MR, Sonenberg N and Filipowicz W:
Regulation of mRNA translation and stability by microRNAs. Annu Rev
Biochem. 79:351–379. 2010. View Article : Google Scholar : PubMed/NCBI
|
|
11
|
Yang ZS, Tang XJ, Guo XR, et al: Cancer
cell-oriented migration of mesenchymal stem cells engineered with
an anticancer gene (PTEN): An imaging demonstration. Onco Targets
Ther. 7:441–446. 2014.PubMed/NCBI
|
|
12
|
Krek A, Grün D, Poy MN, et al:
Combinatorial microRNA target predictions. Nat Genet. 37:495–500.
2005. View
Article : Google Scholar : PubMed/NCBI
|
|
13
|
Lorenzen JM, Haller H and Thum T:
MicroRNAs as mediators and therapeutic targets in chronic kidney
disease. Nat Rev Nephrol. 7:286–294. 2011. View Article : Google Scholar : PubMed/NCBI
|
|
14
|
Krupa A, Jenkins R, Luo DD, et al: Loss of
MicroRNA-192 promotes fibrogenesis in diabetic nephropathy. J Am
Soc Nephrol. 21:438–447. 2010. View Article : Google Scholar : PubMed/NCBI
|
|
15
|
Du B, Ma LM, Huang MB, Zhou H, Huang HL,
Shao P, Chen YQ and Qu LH: High glucose down-regulates miR-29a to
increase collagen IV production in HK-2 cells. FEBS Lett.
584:811–816. 2010. View Article : Google Scholar : PubMed/NCBI
|
|
16
|
Wang Q, Wang Y, Minto AW, et al:
MicroRNA-377 is up-regulated and can lead to increased fibronectin
production in diabetic nephropathy. FASEB J. 22:4126–4135. 2008.
View Article : Google Scholar : PubMed/NCBI
|
|
17
|
Wang G, Kwan BC, Lai FM, et al: Intrarenal
expression of miRNAs in patients with hypertensive nephrosclerosis.
Am J Hypertens. 23:78–84. 2010. View Article : Google Scholar : PubMed/NCBI
|
|
18
|
Tay Y, Rinn J and Pandolfi PP: The
multilayered complexity of ceRNA crosstalk and competition. Nature.
505:344–352. 2014. View Article : Google Scholar : PubMed/NCBI
|
|
19
|
Ling H, Fabbri M and Calin GA: MicroRNAs
and other non-coding RNAs as targets for anticancer drug
development. Nat Rev Drug Discov. 12:847–865. 2013. View Article : Google Scholar : PubMed/NCBI
|
|
20
|
Meng XM, Huang XR, Chung AC, et al: Smad2
protects against TGF-beta/Smad3-mediated renal fibrosis. J Am Soc
Nephrol. 21:1477–1487. 2010. View Article : Google Scholar : PubMed/NCBI
|
|
21
|
Meng XM, Chung AC and Lan HY: Role of the
TGF-β/BMP-7/Smad pathways in renal diseases. Clin Sci (Lond).
124:243–254. 2013. View Article : Google Scholar : PubMed/NCBI
|
|
22
|
Kantharidis P, Wang B, Carew RM and Lan
HY: Diabetes complications: The microRNA perspective. Diabetes.
60:1832–1837. 2011. View Article : Google Scholar : PubMed/NCBI
|