Introduction
In imaging using computed tomography (CT), optimal
liver enhancement is crucial for detecting parenchymal liver
lesions. Hepatic enhancement is affected by several radiologic
factors, for example, the dose (1),
concentration (2) and injection rate
of iodinated contrast media (3,4) and the
scan delay following the injection of contrast media (5,6). It is
also affected by patient-related factors, including body weight
(BW) (1,7) and cardiac output (8). BW is considered to be one of the most
important factors. At many CT scan centers, patients undergoing
abdominal CT receive a tailored dose of contrast media proportional
to their BW while other factors are kept stable. Patients with
increased body mass are often encountered in clinical practice. Fat
tissue has much less blood perfusion than muscle tissue and
parenchymal organs and contributes minimally to the extracellular
volume, that is, the distribution volume of contrast media
(9,10). Ho et al (11) reported that body fat proportion
affected hepatic enhancement greatly and that calculations of
contrast media dose on the basis of measured lean BW (BW without
fat tissue) marginally increased patient-to-patient uniformity with
respect to hepatic parenchyma and vascular enhancement. A tailored
dose of contrast media proportional to BW alone may be insufficient
and it is reasonable to measure the body fat proportion prior to
hepatic enhancement. Lean BW can be quantified by bioimpedance,
which is inconvenient in daily practice in the CT suite. In the
present study, abdominal fat ratio (AFR) at the umbilical level was
used as a marker of body fat proportion to evaluate its association
with hepatic CT enhancement. Other patient factors for both genders
were also analyzed.
Patients and methods
Patients
The review committee of Affiliated Hospital of
Shandong Academy of Medical Sciences (Jinan, China) approved this
study and that patient written informed consent could be waived if
patient privacy was strictly protected considering the
retrospective nature of this study. An electronic database of the
Department of Radiology of the Affiliated Hospital of Shandong
Academy of Medical Sciences was searched to identify all patients
who underwent a test bolus CT scan as part of their routine
abdominal CT imaging from June 2008 to June 2012. Patients included
were those who had undergone abdominal CT imaging for suspicious
abdominal disease, and had negative results or only slight
abnormalities such as small hemangiomas, hepatic cysts or adrenal
adenomas, which were considered to have no or little effect on
hepatic enhancement. These patients had no evidence of alcohol
abuse, viral hepatitis/liver cirrhosis, other causes of chronic
liver disease (for example, autoimmune conditions, metabolic
disorders, drug use or cholangiopathy) or other factors influencing
hepatic enhancement as identified by history taking, physical
examination, laboratory testing or Doppler sonography of the
liver.
Contrast media injection and scan
protocols
Patients who had fasted overnight lay supine on a
table for the test bolus CT scan with a 64-row multi-detector CT
scanner (Sensation 64; Siemens AG, Munich, Germany). Prior to the
scan, patients underwent an abdominal scan without contrast media
while holding their breath at the end of expiration (120 kV; 250
mA; slice thickness, 5 mm; cycle time, 1 sec; standard
reconstruction algorithm). A slice near the level of the hepatic
hilus was selected. Then, 15 ml contrast media (Iohexol, 300 mg
I/ml; Changfu Jiejing Pharmaceutical Co., Ltd., Shandong, China)
was administered at 2.3 ml/sec via a 20-gauge intravenous catheter
in the antecubital vein with a power injector (Medrad Stellant;
Bayer Medical Care, Inc., Indianola, PA, USA). To record the
hepatic enhancement change over time, test bolus scans involved
multiple-slice dynamic sequences lasting 96 sec at the selected
level 10 sec after injection of the contrast media. The test bolus
protocol involved 24 low-dose serial scans, for 96 images (120 kVp;
250 mA; slice thickness, 10 mm; scan time, 0.36 sec; circle time, 4
sec). The patients breathed normally during the test bolus scan.
Diagnostic scans were then performed according to the hepatic
enhancement characteristics acquired from test bolus scans.
Quantitative image analysis
After image acquisition, the data were transferred
to an image processing workstation (Syngo MMWP; Siemens AG). A 5-mm
slice at the umbilical level on the unenhanced transverse series
was selected, and the software integrated with the workstation was
used to measure the volume of total abdomen and fat tissue by a
semi-automatic segmentation technique, as previously described and
validated (12). A freehand region
of interest was manually traced outside the abdominal wall.
Abdominal fat tissue and total volume were defined as pixels within
a window of −190 to −30 and −190 to 1,000 Hounsfield units (HU),
respectively. AFR, calculated as the volume of abdominal fat
divided by the total abdominal volume, was used as a marker of body
fat.
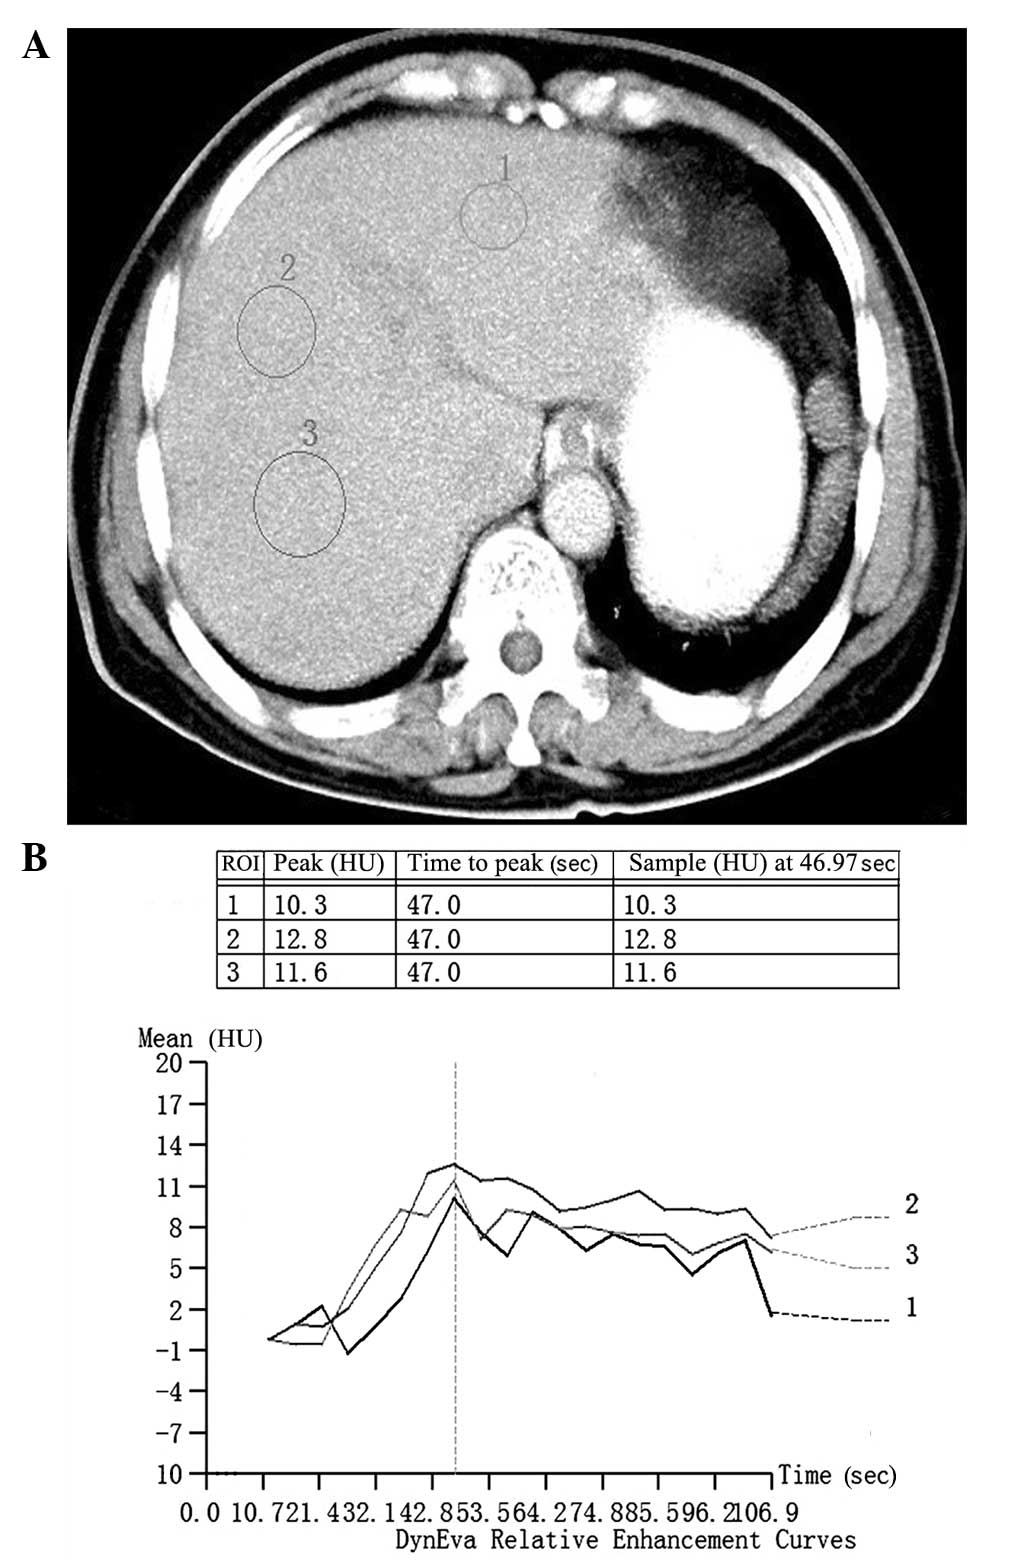
The software DynEva integrated with the workstation
was used to assess features of hepatic enhancement with the test
bolus series. One circular region of interest was set on the
hepatic parenchyma, avoiding blood vessels, liver margins and
possible lesions. The time-density curve of the region of interest
was then automatically generated, and the maximal hepatic
enhancement (MHE) was calculated by subtracting CT values on an
unenhanced image from peak CT values in HU (Fig. 1). The mean of 3 measurements was
used. Images with serious artifacts were excluded from assessment.
The parameter of adjusted MHE (aMHE) proposed by Heiken et
al (7) was calculated: aMHE =
MHE/(I/BW), where I/BW is the dose of iodine in g/kg BW. aMHE was
then analyzed by patient age and AFR.
Statistical analysis
All data analyses were conducted separately for men
and women. Data are expressed as mean ± standard deviation. Patient
AFR was correlated with BW via Pearson correlation coefficient.
Linear regression test was used to assess the association of
patient age and AFR with aMHE. P<0.05 was considered to indicate
a statistically significant difference. Data analysis was conducted
using SPSS software, version 16.0 (SPSS Inc., Chicago, IL,
USA).
Results
Patient information
The study included 87 patients: 47 men (mean age,
55.09±13.27 years; range, 34–78 years) and 40 women (mean age,
60.43±11.29 years; range, 37–77 years).
Correlation of patient age and AFR
with aMHE
The mean AFR, BW and aMHE were 40.26±7.45% (range,
26.00–54.09%), 63.64±10.90 kg (range, 42.90–94.70 kg) and
97.88±10.75 HU (range, 81.07–119.48 HU), respectively, for men and
38.97±9.80% (range, 20.50–60.40%), 60.60±8.79 kg (range,
41.50–74.80 kg) and 100.76±13.34 HU (range, 83.11–124.97 HU),
respectively, for women. AFR was not correlated with BW for men
(r=0.09, P>0.05) or women (r=0.08, P>0.05). aMHE was
positively correlated with AFR for men (r=0.48, P<0.01;
relational expression aMHE = 70.25 + 0.69 × AFR) and women (r=0.46,
P<0.01; relational expression aMHE = 76.26 + 0.63 × AFR) but not
patient age for men or women (r=-0.09 and −0.14, respectively, both
P>0.05).
Discussion
In this study, the association of AFR at the
umbilical level and other patient factors with hepatic enhancement
features on CT were evaluated. AFR at the umbilical level was found
to positively correlate with aMHE.
Fat tissue has much less blood perfusion than muscle
tissue and parenchymal organs. For example, the blood flow in a 70
kg resting human has been estimated to be 260 ml/min in fat tissue,
750 ml/min in muscles, and 1,450 ml/min in the liver (9). In addition, adipose tissue contributes
minimally to the extracellular volume, that is, the distribution
volume of contrast media (10).
According to our understanding, if the same volume of contrast
media is administered to patients with the same BW but different
amounts of body fat tissue, the use of contrast media per kilogram
of lean BW will be relatively higher and thus greater hepatic
enhancement will be achieved in patients with more body fat.
Therefore, obese patients have a tendency to receive unnecessarily
high doses of contrast media while muscular patients may receive
doses that are too low. The observation of an association between
abdominal fat and hepatic enhancement in the present study is
consistent with some previous observations (11,13). Ho
et al (11) reported that
body fat proportion affected hepatic enhancement greatly, and that
calculations of contrast media dose on the basis of measured lean
BW marginally increased patient-to-patient uniformity with respect
to hepatic parenchyma and vascular enhancement. Another study
(14) revealed that hepatic
enhancement was affected significantly by patient age; however,
this trend was not observed in the present study, perhaps because
of the small sample size.
The relational expressions between AFR and aMHE in
men and women were substituted into the formula of Heiken et
al (7): [aMHE = MHE/(I/BW)], and
two relational expressions were obtained: I/BW (men) = MHE/(70.25 +
0.69 × AFR) and I/BW (women) = MHE/(76.26 + 0.63 × AFR). With these
expressions, it is easy to determine the iodine dose needed per
kilogram of BW to produce a desired level of hepatic enhancement in
a patient of known BW and AFR. For example, the dose of iodine
required for desired enhancement levels of 50 HU in a man with an
AFR of 20% is ~0.59 g/kg, whereas that in a man with BFP of 40% is
~0.51 g/kg. These results indicate that determining an iodine dose
by proportion of fat in the human body is an optimal method for
maintaining a constant intensity of hepatic and vascular
enhancement constant and to reduce the intersubject variability in
enhancement intensity. The observation that the aMHE was higher in
patients with greater AFR suggests that less contrast media should
be administered to patients with the same BW but more body fat, to
increase patient-to-patient uniformity of hepatic enhancement. The
advantages of reducing the contrast media include a potential
reduction in nephrotoxicity, particularly in patients with
preexisting renal insufficiency or other risk factors associated
with obesity (15,16), and cost reduction.
There are several markers of the proportion of body
fat. Although anthropometric markers such as waist circumstance and
body mass index are conveniently measured, they are estimates and
are not accurate. Kondo et al (13) used body fat percentage to evaluate
the association between body fat and hepatic enhancement, and their
results indicated that the correlation with hepatic enhancement was
higher for body fat percentage than for other anthropometric
markers. However, the measurement of body fat percentage requires a
special instrument that is not always available. Fat measurement is
a basic and accurate function in almost every modern CT scanner,
and the measurement method is convenient and can be performed in
several minutes. Therefore, AFR was selected for assessment of its
association with hepatic enhancement in the present study.
To assess the characteristics of hepatic
enhancement, two imaging protocols, test bolus and bolus tracking,
are commonly used. The bolus tracking protocol monitors in real
time the enhancement of a preselected region of interest with
repetitive low-dose test scans following the injection of a
contrast medium; the diagnostic scan then automatically starts when
the enhancement of the region of interest reaches the preset
threshold. The test bolus protocol requires an additional test
injection of a small amount of contrast media prior to the
diagnostic scan, and then a series of repetitive low-dose scans at
a preselected level are performed to record the degree of hepatic
enhancement over time. A time-density curve is then generated to
guide the later diagnostic scans. As compared with the bolus
tracking protocol, the test bolus scans provide more accurate data
of hepatic enhancement features and have been performed routinely
in the Department of Radiology of Affiliated Hospital of Shandong
Academy of Medical Sciences. Therefore, data for patients who
underwent a test bolus scan as part of their abdominal CT imaging
were selected for analysis. However, the test bolus protocol
requires more contrast media and time; moreover, it impairs the
quality of subsequent diagnostic scans because the level of
enhancement masks parenchymal lesions. Therefore, it is seldom
performed now in clinical practice.
The present study has certain limitations. First,
some important factors influencing hepatic enhancement such as
heart rate and cardiac output were not investigated because these
data were not available for these patients. Second, since the
correlation coefficient between aMHE and AFR was as low as ~0.5,
the association between abdominal fat and hepatic enhancement
requires verification in further studies. Finally, the sample size
was relatively small.
Despite these limitations, the study revealed that
AFR was positively correlated with aMHE in test bolus CT scans. It
may be concluded that determining an iodine dose on the basis of
abdominal fat ratio might be a optimal way to maintain a constant
intensity of hepatic enhancement constant and to reduce the
intersubject variability when designing an abdominal CT
protocol.
Acknowledgements
The authors would like to thank Dr. Yue Ren,
Department of Radiology at Affiliated Hospital of Shandong Academy
of Medical Sciences, for assistance with performing the study.
References
|
1
|
Yamashita Y, Komohara Y, Takahashi M, et
al: Abdominal helical CT: Evaluation of optimal doses of
intravenous contrast material - a prospective randomized study.
Radiology. 216:718–723. 2000. View Article : Google Scholar : PubMed/NCBI
|
|
2
|
Awai K, Takada K, Onishi H and Hori S:
Aortic and hepatic enhancement and tumor-to-liver contrast:
Analysis of the effect of different concentrations of contrast
material at multi-detector row helical CT. Radiology. 224:757–763.
2002. View Article : Google Scholar : PubMed/NCBI
|
|
3
|
Foley WD, Hoffmann RG, Quiroz FA, Kahn CE
Jr and Perret RS: Hepatic helical CT: Contrast material injection
protocol. Radiology. 192:367–371. 1994. View Article : Google Scholar : PubMed/NCBI
|
|
4
|
Tublin ME, Tessler FN, Cheng SL, Peters TL
and McGovern PC: Effect of injection rate of contrast medium on
pancreatic and hepatic helical CT. Radiology. 210:97–101. 1999.
View Article : Google Scholar : PubMed/NCBI
|
|
5
|
Goshima S, Kanematsu M, Kondo H, et al:
MDCT of the liver and hypervascular hepatocellular carcinomas:
Optimizing scan delays for bolus-tracking techniques of hepatic
arterial and portal venous phases. AJR Am J Roentgenol.
187:W25–W32. 2006. View Article : Google Scholar : PubMed/NCBI
|
|
6
|
Kondo H, Kanematsu M, Goshima S, et al:
MDCT of the pancreas: Optimizing scanning delay with a
bolus-tracking technique for pancreatic, peripancreatic vascular,
and hepatic contrast enhancement. AJR Am J Roentgenol. 188:751–756.
2007. View Article : Google Scholar : PubMed/NCBI
|
|
7
|
Heiken JP, Brink JA, McClennan BL, Sagel
SS, Crowe TM and Gaines MV: Dynamic incremental CT: Effect of
volume and concentration of contrast material and patient weight on
hepatic enhancement. Radiology. 195:353–357. 1995. View Article : Google Scholar : PubMed/NCBI
|
|
8
|
Bae KT, Heiken JP and Brink JA: Aortic and
hepatic contrast medium enhancement at CT. Part II. Effect of
reduced cardiac output in a porcine model. Radiology. 207:657–662.
1998. View Article : Google Scholar : PubMed/NCBI
|
|
9
|
Davies B and Morris T: Physiological
parameters in laboratory animals and humans. Pharm Res.
10:1093–1095. 1993. View Article : Google Scholar : PubMed/NCBI
|
|
10
|
Morgan DJ and Bray KM: Lean body mass as a
predictor of drug dosage. Implications for drug therapy. Clin
Pharmacokinet. 26:292–307. 1994. View Article : Google Scholar : PubMed/NCBI
|
|
11
|
Ho LM, Nelson RC and Delong DM:
Determining contrast medium dose and rate on basis of lean body
weight: Does this strategy improve patient-to-patient uniformity of
hepatic enhancement during multi-detector row CT. Radiology.
243:431–437. 2007. View Article : Google Scholar : PubMed/NCBI
|
|
12
|
Yoshizumi T, Nakamura T, Yamane M, et al:
Abdominal fat: Standardized technique for measurement at CT.
Radiology. 211:283–286. 1999. View Article : Google Scholar : PubMed/NCBI
|
|
13
|
Kondo H, Kanematsu M, Goshima S, et al:
Abdominal multidetector CT in patients with varying body fat
percentages: Estimation of optimal contrast material dose.
Radiology. 249:872–877. 2008. View Article : Google Scholar : PubMed/NCBI
|
|
14
|
Itoh S, Ikeda M, Satake H, Ota T and
Ishigaki T: The effect of patient age on contrast enhancement
during CT of the pancreatobiliary region. AJR Am J Roentgenol.
187:505–510. 2006. View Article : Google Scholar : PubMed/NCBI
|
|
15
|
Lasser EC, Lyon SG and Berry CC: Reports
on contrast media reactions: Analysis of data from reports to the
U.S. Food and Drug Administration. Radiology. 203:605–610. 1997.
View Article : Google Scholar : PubMed/NCBI
|
|
16
|
Tublin ME, Murphy ME and Tessler FN:
Current concepts in contrast media-induced nephropathy. AJR Am J
Roentgenol. 171:933–939. 1998. View Article : Google Scholar : PubMed/NCBI
|