Introduction
Liver cirrhosis (LC) is a common global disease,
which causes serious damage to human health, and is the fifth main
cause of mortality in humans. Late-stage LC, with the exception of
liver transplantation, still lacks effective treatments. Hepatic
fibrosis (HF) is a variety of chronic liver disease which may
progress to an LC-inevitable stage although treatment of HF can
reverse the degradation of the liver (1,2). Since
effective prevention and control of HF may reduce the risk of LC
occurring, investigating the molecular mechanisms associated with
the condition and exploring effective methods for the treatment of
HF is an urgent requirement to solve the problem.
The receptor for advanced glycation end products
(RAGE) is widely present on a variety of cell surfaces, and is
closely associated with numerous diseases, including diabetes and
atherosclerosis (3,4). Previous studies have demonstrated that
RAGE-specific small interfering (si)RNA is able to inhibit the
expression of the RAGE gene in primary rat hepatic stellate cells
(HSCs), and may be able to inhibit the generation of profibrogenic
cytokines (5–7). Furthermore, high expression levels of
RAGE mRNA and protein have been observed in activated HSCs and
CCl4-induced HF rats. Transfection of a RAGE-specific
siRNA expression vector into the HSC-T6 cells or fibrotic rat liver
via the tail vein significantly inhibited the expression levels of
RAGE mRNA and protein, and reduced the activity of liver nuclear
factor-κB, the degree of hepatic fibrosis (8) and the levels of serum procollagen type
III, hyaluronic acid and laminin (9–11). To
the best of our knowledge, however, there are no studies concerning
the effect of RAGE-specific siRNA on the generation of
proinflammatory cytokines. Therefore, the present study aimed to
investigate the effect of RAGE-specific siRNA on the mRNA and
protein expression levels of the inflammatory cytokines tumor
necrosis factor (TNF)-α and interleukin (IL)-6 in primary HSCs and
HF rats.
Materials and methods
Vector construction
The RAGE-specific and non-specific siRNA recombinant
adeno-associated viral expression vectors (pAKD-GR126 and pAKD-NC,
respectively) were constructed by the Research Center of
Pharmaceutical Engineering and Process Chemistry, School of
Pharmacy, East China University of Science and Technology
(Shanghai, China).
Cell grouping and intervention
Three healthy male, 8-week-old, clean-grade Sprague
Dawley (SD) rats, weighing 400–500 g, were purchased from the
Experimental Animal Center of Nanjing Medical University (license
no. SCDK Su 2008-0004; Nanjing, China). Mouse desmin antibody and a
streptavidin peroxidase kit were purchased from Zymed Life
Technologies (Carlsbad, CA, USA) and used in the identification of
HSCs. Following the separation and cultivation of primary rat HSCs,
they were identified using inverted phase contrast microscopy
(TS100; Nikon, Tokyo, Japan) to observe the refraction in the cell
and the change of cell morphology in different training periods. It
was observed that the newly separated live primitive HSCs did not
stick to the wall, were spherical or round, bright, with a strong
refractive index, and they contained more fat droplets in the
cytoplasm. The primary HSCs were separated into the control,
pAKD-GR126 and pAKD-NC groups after five days of culture. Prior to
transfection, serum-free medium was used for the cell culture of
each group. All groups received 200 mg/l AGE-bovine serum albumin
(BioVision, Inc., Milpitas, CA, USA) for stimulation. The
pAKD-GR126 group was subsequently directly transfected with the
RAGE-specific siRNA expression vector pAKD-GR126, and the pAKD-NC
group with the non-specific siRNA expression vector pAKD-NC.
Preparation and treatment of the
animal model
In total, 108 male, 6-week-old SD rats, weighing
250–300 g, were purchased from the SIPPR-BK Laboratory Animal Co.,
Ltd. (license no. SCXK Hu 2008-0016; Shanghai, China). The rats
were separated at random into the normal control (n=18) or model
(n=90) groups. Rats in the normal control group were
intraperitoneally injected with refined olive oil (2 ml/kg), twice
a week for six weeks. Rats in the model group were
intraperitoneally injected with 50% CCl4 (2 ml/kg) mixed
with olive oil at a ratio of 1:1, twice a week for six weeks, to
establish the model of hepatic fibrosis. Once the model was
established, the rats were separated at random into the fibrotic
model (FM), pAKD-GR126 low-dose (LT), pAKD-GR126 medium-dose (MT),
pAKD-GR126 high-dose (HT) and pAKD-NC (NS) groups, with 18 rats per
group. The original normal control (NC) group was maintained as a
blank control group. The NC and FM group rats were high-power
injected with phosphate-buffered saline (2 ml/kg) via the tail vein
with a 1-ml syringe, as this is a fast method of introducing
material. Rats in the LT, MT and HT groups were high-power injected
with recombinant virus pAKD-GR126 at a dose of 6×10¹⁰,
3×10¹¹ or 1×10¹² particles, respectively, via
the tail vein. Rats in the NS group were high-power injected with
recombinant virus pAKD-NC at a dose of 1×10¹² particles
via the tail vein, twice a week for a total of six weeks. For all
groups, blood was extracted from the heart chamber three days after
the final tail vein injection, and the liver tissues were also
sampled for detection. The present study was conducted in
accordance with the recommendations of the Guide for the Care and
Use of Laboratory Animals of the National Institutes of Health. The
animal use protocol was approved by the Institutional Animal Care
and Use Committee of Southeast University (Nanjing, China).
Reverse transcription-quantitative
polymerase chain reaction analysis (RT-qPCR)
Type IV collagenase, pronase E and Nycodenz® were
purchased from Sigma-Aldrich (St. Louis, MO, USA). TRIzol® reagent
was purchased from Invitrogen Life Technologies (Carlsbad, CA,
USA). DNA enzyme I was purchased from Gibco Life Technologies
(Carlsbad, CA, USA). The total RNA of each group was extracted
using TRIzol according to the manufacturer's instructions, prior to
the purity and concentration of the RNA being calculated: Samples
of RNA (1.0 µl) with RNase-free diethyl pyrocarbonate water (1,000
µl) were blended together and the RNA concentration was measured
using a GeneQuant spectrophotometer (GE Healthcare Life Sciences,
Shanghai, China). The RNA was reverse transcribed into cDNA for the
qPCR analysis. The qPCR protocol was as follows: 94°C for 3 min; 40
cycles of 94°C for 1 min, 55°C for 1 min and 72°C for 1 min; and
finally 72°C for 5 min. The 2−ΔΔCt method was used to
calculate the relative inhibition rates. The gene primers for RAGE,
TNF-α, IL-6 and β-actin were synthesized by Sangon Biotech Co.,
Ltd. (Shanghai, China), and the specific sequences are presented in
Table I.
 | Table I.Polymerase chain reaction primer
sequences. |
Table I.
Polymerase chain reaction primer
sequences.
| Primer | Primer sequence | Amplified length
(bp) |
|---|
| RAGE | Forward:
5′-CCTCTGATTCCTGATGGCAA-3′ | 158 |
|
| Reverse:
5′-CTCCTACTCATGCCCTACCT-3′ |
|
| TNF-α | Forward:
5′-CACGCTCTTCTGTCTACTGA-3′ | 543 |
|
| Reverse:
5′-GGACTCCGTGATGTCTAAGT-3′ |
|
| IL-6 | Forward:
5′-GAAAGTCAACTCCATCTGCC-3′ | 681 |
|
| Reverse:
5′-CATAGCACACTAGGTTTGCC-3′ |
|
| β-actin | Forward:
5′-TGTTACCAACTGGGACGACA-3′ | 130 |
|
| Reverse:
5′-CTTTTCACGGTTGGCCTTAG-3′ |
|
Western blot analysis
The HSC lysate of each group was collected to
extract the proteins, and a bicinchoninic acid assay kit (Nanjing
KeyGen Biotech Co. Ltd., Nanjing, China) was used to detect the
concentrations of the protein samples. The protein samples were
then subjected to SDS-PAGE (10%), followed by transferal onto
polyvinylidene difluoride membranes. The membranes were blocked
with skimmed milk for 1 h, and then incubated overnight with a
rabbit monoclonal primary antibody to RAGE (cat. no, EPR12206;
Abcam, Cambridge, UK), which was diluted with Tris-buffered saline
and Tween 20 according to the manufacturer's instructions, at 4°C.
Following repeated washing, the membranes were incubated with a
horseradish peroxidase-labeled secondary antibody (Beijing ComWin
Biotech Co. Ltd., Beijing, China) at room temperature for 1 h and
washed again. An electrochemiluminescence assay was then performed
for sample visualization, and gel electrophoresis was performed for
scanning and optical density analysis. β-actin was used as a
control and the ratio of stripe density between experimental and
control groups was determined.
Liver tissue sampling
Following the sacrifice of the rats, the livers were
removed and rapidly frozen. Fluorescence microscopy was then used
to observe the green fluorescent protein (GFP)-labeled pAKD-GR126
and pAKD-NC expression in the liver sections. The remaining liver
tissues were fixed with 4% paraformaldehyde, paraffin-embedded and
processed into sections, followed by hematoxylin and eosin (HE) and
Masson's trichrome collagen staining. Two pathologists assessed the
images under double-blind conditions, and performed
inflammatory-activity grading and fibrosis staging of the liver
samples using the Scheuer modified scoring system (12).
Radioimmunoassay
Rats were anesthetized with ether, and then
subjected to cardiac chamber puncture to obtain sample blood, which
was centrifuged at 12,683 × g for 8 min at 4°C. The upper part of
the stratified serum was collected for the determination of TNF-α
and IL-6 concentrations in the HF rats by radioimmunoassay, in
accordance with the manufacturer's instructions. The TNF-α and IL-6
radioimmunoassay kits were obtained from the Naval Medical Research
Institute (Shanghai, China).
Statistical analysis
SPSS software, version 18.0 (SPSS, Inc., Chicago,
IL, USA) was used for the statistical analysis. Measurement data
met the normality and homogeneity of variance, and are expressed as
the mean ± standard deviation. Multiple data were compared using
analysis of variance, while pairwise comparisons used the
Student-Newman-Keuls method. Grading group data used the rank sum
test, with P<0.05 considered to indicate a statistically
significant difference.
Results
mRNA expression levels of RAGE, TNF-α
and IL-6
In the primary HSCs transfected with the
RAGE-specific siRNA expression vector pAKD-GR126, the RAGE mRNA
expression levels were reduced to 42.32±6.16 and 43.24±7.50% of the
values in the control and pAKD-NC groups, respectively (F=7.791;
P<0.05). The TNF-α mRNA expression levels were also reduced, to
38.68±4.11 and 39.50±3.29% of the values in the control and pAKD-NC
groups, respectively (F=474.568; P<0.05). Similarly, the IL-6
mRNA expression levels were reduced to 47.46±5.52 and 45.94±4.55%
of the values in the control and pAKD-NC groups, respectively
(F=203.463; P<0.05). The differences between the pAKD-GR126 and
control/pAKD-NC groups were statistically significant (P<0.05),
while no statistically significant difference was found between the
control and pAKD-NC groups (P>0.05). These results indicate that
the RAGE-specific siRNA expressed by pAKD-GR126 was able to inhibit
the mRNA expression of RAGE, TNF-α and IL-6 (Table II).
| Table II.Effect of specific siRNA on the mRNA
expression levels of RAGE, TNF-α and IL-6 in the primary HSCs
(2−ΔΔCt). |
Table II.
Effect of specific siRNA on the mRNA
expression levels of RAGE, TNF-α and IL-6 in the primary HSCs
(2−ΔΔCt).
|
| Group (n) |
|
|
|---|
|
|
|
|
|
|---|
| Index | Control (3) | pAKD-GR126 (3) | pAKD-NC (3) | F | P-value |
|---|
| RAGE | 2.58±0.63 |
1.07±0.09a | 2.55±0.68 |
7.791 | <0.05 |
| TNF-α | 2.95±0.04 |
1.14±0.12a | 2.88±0.06 | 474.568 | <0.05 |
| IL-6 | 1.97±0.06 |
0.93±0.10a | 2.03±0.05 | 203.463 | <0.05 |
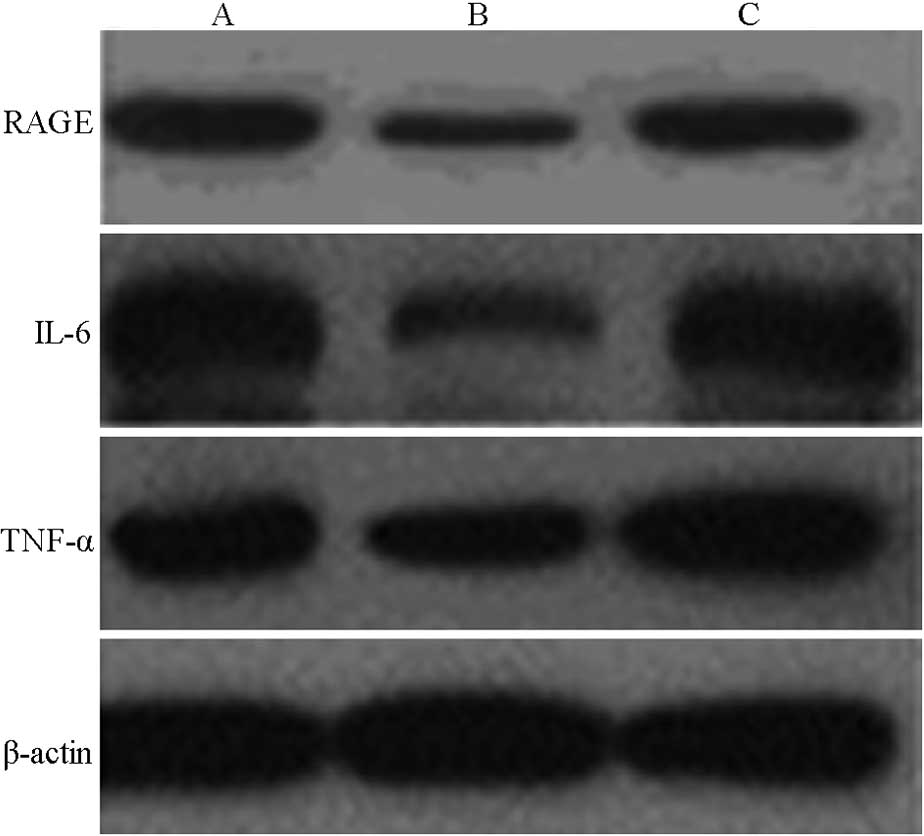
Protein expression levels of RAGE,
TNF-α and IL-6
Western blot analysis results revealed that,
following the transfection of the specific siRNA expression vector,
the protein expression levels of RAGE, TNF-α and IL-6 in the HSCs
were significantly reduced. RAGE protein expression levels were
reduced to 51.06±13.79 and 47.94±5.36% of the values in the control
and pAKD-NC groups, respectively (F=36.513; P<0.05); TNF-α
protein expression levels were reduced to 57.00±6.07 and
56.01±5.27% of the values in the control and pAKD-NC groups,
respectively (F=123.500; P<0.05); and IL-6 protein expression
levels were reduced to 48.30±3.26 and 50.50±3.61% of the values in
the control and pAKD-NC groups, respectively (F=320.555;
P<0.05). No statistically significant difference was found
between the control and pAKD-NC groups (P>0.05). These results
indicate that the RAGE-specific siRNA expressed by pAKD-GR126 was
able to inhibit the protein expression of RAGE, TNF-α and IL-6
(Table III and Fig. 1).
| Table III.Effect of specific siRNA on the
protein expression levels of RAGE, TNF-α and IL-6 in the primary
HSCs (/β-actin). |
Table III.
Effect of specific siRNA on the
protein expression levels of RAGE, TNF-α and IL-6 in the primary
HSCs (/β-actin).
|
| Group (n) |
|
|
|---|
|
|
|
|
|
|---|
| Index | Control (3) | pAKD-GR126 (3) | pAKD-NC (3) | F | P-value |
|---|
| RAGE | 2.25±0.29 |
1.12±0.15a | 2.34±0.07 |
36.513 | <0.05 |
| TNF-α | 2.35±0.10 |
1.34±0.10a | 2.39±0.08 | 123.500 | <0.05 |
| IL-6 | 2.35±0.06 |
1.13±0.05a | 2.25±0.08 | 320.555 | <0.05 |
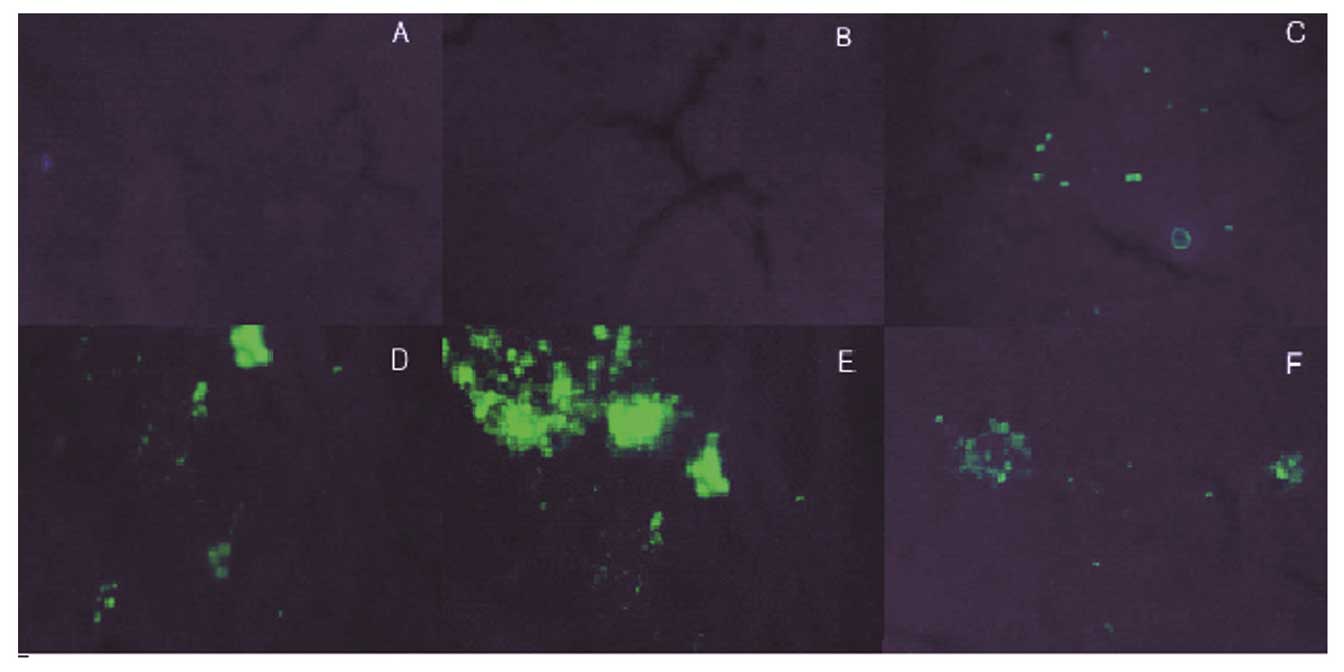
GFP expression
The expression vector pAKD-GR126 simultaneously
expressed the specific siRNA and GFP; therefore, observation of GFP
expression was used to determine the transfection efficiency of the
expression vector, in addition to the expression of specific siRNA.
Green fluorescence was observed in the LT, MT, HT and NS groups,
while the NC and FM groups exhibited no fluorescence. The results
therefore showed that the expression vector pAKD-GR126 was
successfully transfected into the rat liver cells and was able to
express the RAGE-specific siRNA (Fig.
2).
Serum TNF-α and IL-6
concentrations
Compared with the NC group, the serum TNF-α and IL-6
levels of the FM group were significantly increased by 175.27±5.48
and 292.32±1.62%, respectively (P<0.05); however, after six
weeks of treatment with RAGE-specific siRNA, the serum TNF-α levels
of the LT, MT and HT groups were reduced to 76.68±1.83, 69.00±2.36
and 62.29±2.44%, respectively, of the level in the FM group
(F=416.397; P<0.05), while the IL-6 levels were reduced to
81.23±1.38, 65.32±2.03 and 48.87±1.13%, respectively, of the level
in the FM group (F=1,716.659; P<0.05). The serum TNF-α and IL-6
levels in the FM and NS groups exhibited no significant difference
(P>0.05). These results indicate that the RAGE-specific siRNA
was able to effectively inhibit the generation of TNF-α and IL-6 in
the HF rats (Table IV).
| Table IV.Effect of specific siRNA on the serum
TNF-α and IL-6 concentrations in the HF rats. |
Table IV.
Effect of specific siRNA on the serum
TNF-α and IL-6 concentrations in the HF rats.
| Index | NC group | FM group | LT group | MT group | HT group | NS group |
|---|
| TNF-α (ng/ml) | 166.67±4.04 |
292.83±5.74a |
224.50±5.05a,b |
202.00±6.16a,b |
182.33±6.09a,b |
291.50±5.24a |
| IL-6 (ng/ml) | 173.00±3.61 |
505.83±5.42a |
410.83±6.18a,b |
330.33±8.62a,b |
247.17±5.42a,b |
503.67±6.06a |
Liver histology
The HE and Masson's trichrome staining of the liver
portal areas of the FM and NS groups revealed numerous regions of
spotty, flaky or bridge-like necrosis, inflammatory cell
infiltration, fibrous connective tissue proliferation and the
formation of false lobules. The NC group exhibited no liver tissue
necrosis, inflammatory cell infiltration or fibrosis. Compared with
the FM and NS groups, the inflammation and fibrotic proliferation
in the LT, MT and HT groups showed various degrees of improvement,
with the HT group exhibiting the most evident alleviation. The
Scheuer modified scoring system was used for the liver
inflammatory-activity grading and fibrosis staging of each group.
The liver inflammatory activity grade and fibrosis stage of each
treatment group was significantly reduced compared with that in the
FM and NS groups (χ2=28.825 and 31.318, respectively;
P<0.01). These results indicate that the RAGE-specific siRNA was
able to effectively improve the degree of liver inflammation and
fibrosis in the HF rats (Fig. 3 and
Table V).
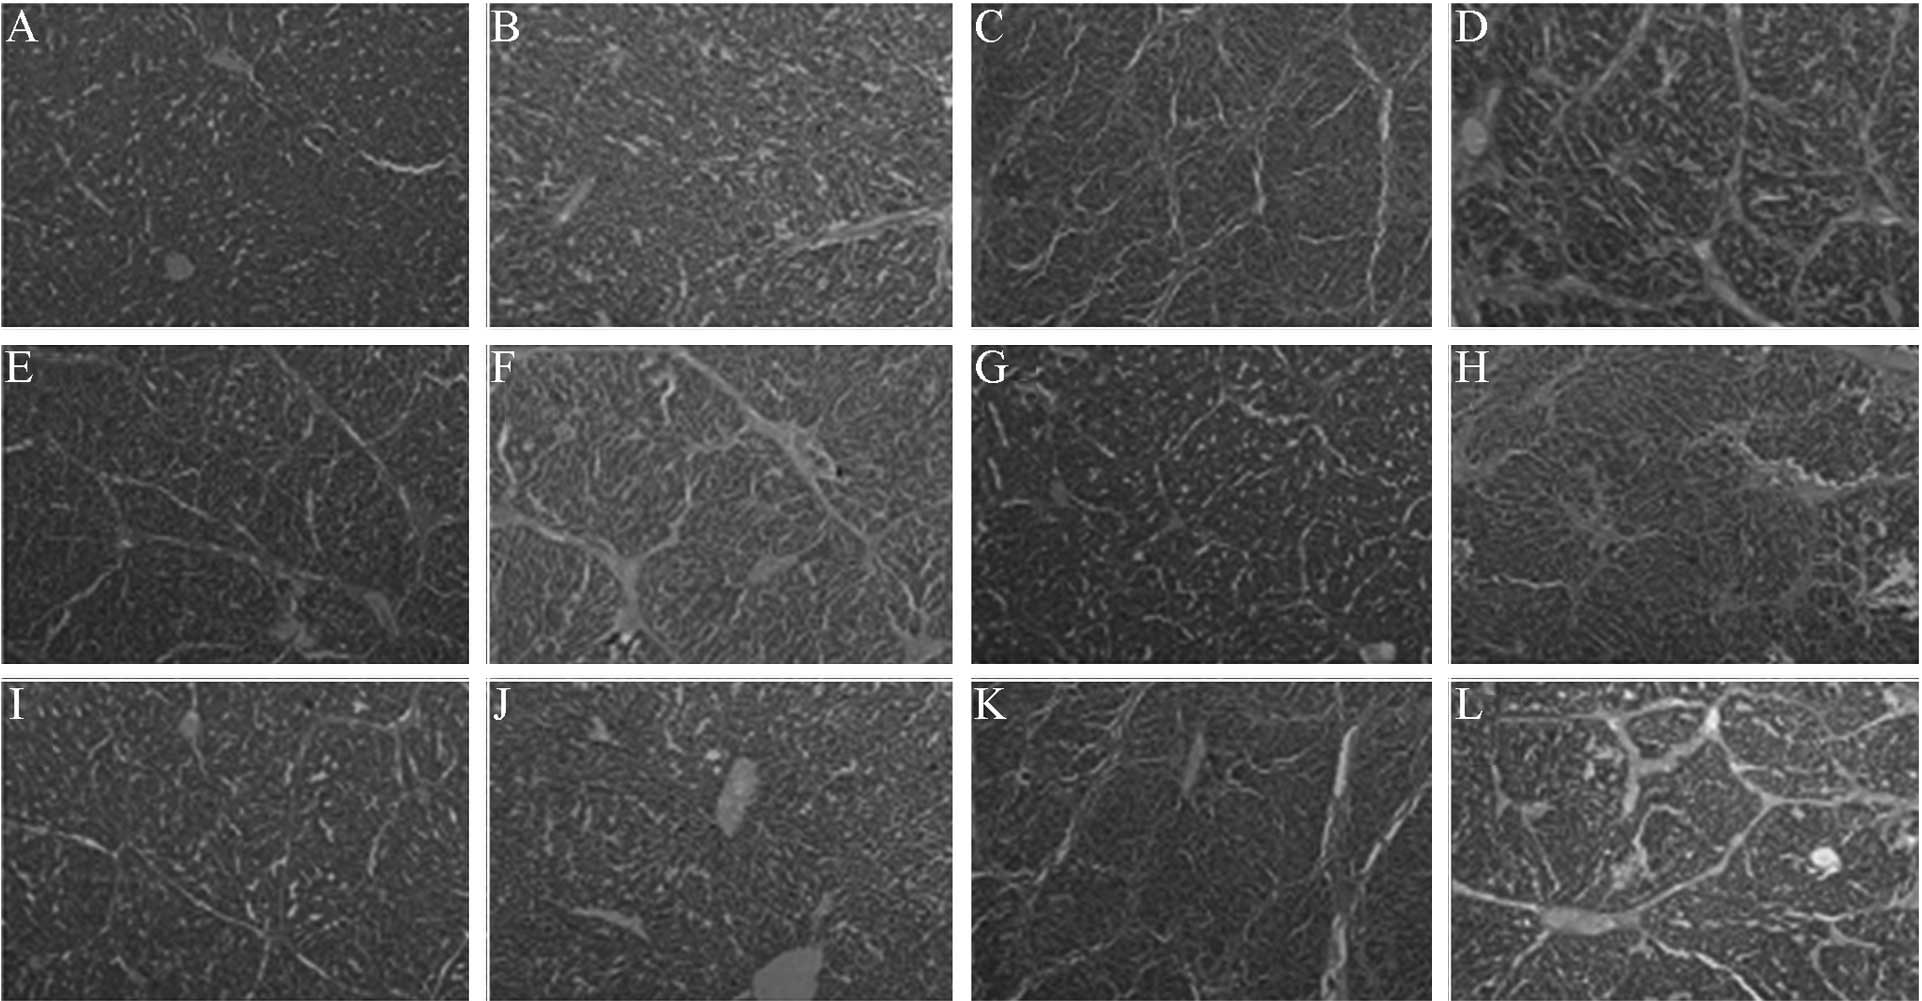 | Figure 3.Effect of specific small interfering
RNA on the liver histology of hepatic fibrotic rats. (A and B)
Normal control, (C and D) fibrotic model, (E and F) low-dose
pAKD-GR126, (G and H) medium-dose pAKD-GR126, (I and J) high-dose
pAKD-GR126 and (K and L) pAKD-NC groups. A, C, E, G, I and K were
stained with hematoxylin and eosin (HE; magnification, x40). B, D,
F, H, J and L were stained with Masson's trichrome (magnification,
x100). The HE and Masson's staining of the liver portal areas of
these groups indicate that the RAGE-specific siRNA was able to
effectively improve the degree of liver inflammation and fibrosis
in the hepatic fibrotic rats. RAGE, receptor for advanced glycation
end products. |
| Table V.Effect of specific siRNA on the liver
inflammatory activity and fibrosis grading of the HF rats. |
Table V.
Effect of specific siRNA on the liver
inflammatory activity and fibrosis grading of the HF rats.
|
| Liver inflammatory
activity grading |
| Fibrosis
grading |
|
|---|
|
|
|
|
|
|
|---|
| Group | 0 | I | II | III | IV | Mean rank | 0 | I | II | III | IV | Mean rank |
|---|
| NC | 6 | 0 | 0 | 0 | 0 | 4.00 | 6 | 0 | 0 | 0 | 0 | 3.50 |
| FM | 0 | 0 | 0 | 2 | 4 | 31.00a | 0 | 0 | 0 | 1 | 5 | 29.75a |
| LT | 0 | 2 | 3 | 1 | 0 | 18.33a,b | 0 | 1 | 3 | 2 | 0 | 18.58a,b |
| MT | 0 | 3 | 3 | 0 | 0 | 15.75a,b | 0 | 3 | 2 | 1 | 0 | 15.17a,b |
| HT | 1 | 3 | 2 | 0 | 0 | 13.08a,b | 0 | 4 | 2 | 0 | 0 | 13.00a,b |
| NS | 0 | 0 | 1 | 2 | 3 | 28.83a | 0 | 0 | 0 | 0 | 6 | 31.00a |
Discussion
As a signal transduction receptor, RAGE is able to
interact with its ligand, AGEs, on the cell surface, thus
generating oxidative stress (13)
and mediating the transformation of epithelial cells, mesothelial
cells and HSCs into myofibroblasts (MFs). This process in turn
promotes the release of profibrogenic growth factors and
proinflammatory cytokines, thus increasing inflammation, promoting
angiogenesis and collagen deposition and ultimately leading to a
range of pathologies and fibrosis in various tissues (14,15).
Fehrenbach et al (16)
confirmed that only HSCs and MFs in the liver are able to
specifically express RAGE mRNA. Furthermore, during the
transformation of cultured rat HSCs into MFs, the mRNA expression
levels of RAGE are upregulated, accompanied by an increase in RAGE
protein levels and transforming growth factor-β1 (TGF-β1) synthesis
(16). These findings indicate that
RAGE may be the primary receptor involved in the activation and
transformation of HSCs into MFs during the development of hepatic
fibrosis.
HSC activation plays a pivotal role in the onset and
development of hepatic fibrosis; the activated HSCs are able to
synthesize and secrete large quantities of extracellular matrix
(ECM), and release various cytokines, including TNF-α, IL-6 and
TGF-β1 (17–19). In the present study, the mRNA and
protein levels of RAGE, TNF-α and IL-6 were reduced in the primary
HSCs of the pAKD-GR126 group compared with those in the control and
NC groups. Furthermore, the serum TNF-α and IL-6 concentrations,
liver inflammatory activities and degree of fibrosis in the LT, MT
and HT groups were reduced and alleviated compared with those in
the FM and NS groups. These results indicated that the specific
siRNA expressed by pAKD-GR126 was able to effectively suppress the
generation of TNF-α and IL-6 in vitro and in vivo,
and thus improved the degree of liver inflammation and fibrosis in
rats.
Various cytokines are known to serve a crucial
function in liver cell damage and dysfunction, interacting via
autocrine or paracrine signaling to form a cytokine network and
co-regulate the onset and development of hepatic fibrosis. TNF-α
and IL-6, in particular, are associated with the development of
hepatic fibrosis (20,21). TNF-α and IL-6 not only mediate
inflammation, but also are able to promote ECM synthesis, thus
contributing to the development of hepatic fibrosis (22). TNF-α is able to directly contribute
to the proliferation of HSCs and rat hepatocytes by synthesizing
collagen and proteoglycans, while IL-6 promotes the proliferation
of fibroblasts and the mRNA expression of types I and III collagen.
Furthermore, IL-6 can induce the mRNA expression of tissue
inhibitor of matrix metalloproteinase-1, promote α2-macroglobulin
expression and inhibit collagenase activity, thereby reducing ECM
decomposition. In addition, as inflammatory cytokines, TNF-α and
IL-6 are able to stimulate Kupffer cells to release increased
quantities of cytokines, such as TGF-β1 and platelet-derived growth
factor, thus resulting in positive feedback amplification and
further ECM production (23).
Hepatic fibrosis is a characteristic feature of the
development of various chronic liver diseases, including viral
hepatitis, chronic alcoholism, genetic and metabolic disorders,
chemical poisoning or drug toxicity, liver congestion, parasites
and fatty liver, into cirrhosis. Furthermore, hepatic fibrosis
represents a critical stage for the reversible treatment of liver
cirrhosis, and the effective prevention of hepatic fibrosis may
limit the occurrence of cirrhosis, thus improving the prognosis of
patients with chronic liver disease and reducing the risk of
cirrhosis. In the present study, a specific siRNA was used to
inhibit the generation of TNF-α and IL-6 in vitro and in
vivo. The results indicated that the specific siRNA suppressed
hepatic fibrosis by inhibiting the expression of TNF-α and IL-6,
which could therefore become a novel target for future anti-HF gene
therapy.
Acknowledgements
This study was supported by a grant from the Natural
Science Foundation of Jiangsu Province (no. BK2009284).
References
|
1
|
Mansoor S, Yerian L, Kohli R, Xanthakos S,
Angulo P, Ling S, Lopez R, Christine CK, Feldstein AE and Alkhouri
N: The evaluation of hepatic fibrosis scores in children with
nonalcoholic fatty liver disease. Dig Dis Sci. 60:1440–1447. 2015.
View Article : Google Scholar : PubMed/NCBI
|
|
2
|
Roy S, Benz F, Luedde T and Roderburg C:
The role of miRNAs in the regulation of inflammatory processes
during hepatofibrogenesis. Hepatobiliary Surg Nutr. 4:24–33.
2015.PubMed/NCBI
|
|
3
|
Hegab Z, Gibbons S, Neyses L and Mamas MA:
Role of advanced glycation end products in cardiovascular disease.
World J Cardiol. 4:90–102. 2012. View Article : Google Scholar : PubMed/NCBI
|
|
4
|
Barlovic DP, Soro-Paavonen A and
Jandeleit-Dahm KA: RAGE biology, atherosclerosis and diabetes. Clin
Sci (Lond). 121:43–55. 2011. View Article : Google Scholar : PubMed/NCBI
|
|
5
|
Lee UE and Friedman SL: Mechanisms of
hepatic fibrogenesis. Best Pract Res Clin Gastroenterol.
25:195–206. 2011. View Article : Google Scholar : PubMed/NCBI
|
|
6
|
Lohwasser C, Neureiter D, Popov Y, Bauer M
and Schuppan D: Role of the receptor for advanced glycation end
products in hepatic fibrosis. World J Gastroenterol. 15:5789–5798.
2009. View Article : Google Scholar : PubMed/NCBI
|
|
7
|
Guimarães EL, Empsen C, Geerts A and van
Grunsven LA: Advanced glycation end products induce production of
reactive oxygen species via the activation of NADPH oxidase in
murine hepatic stellate cells. J Hepatol. 52:389–397. 2010.
View Article : Google Scholar : PubMed/NCBI
|
|
8
|
Xia JR, Liu NF and Zhu NX: Specific siRNA
targeting the receptor for advanced glycation end products inhibits
experimental hepatic fibrosis in rats. Int J Mol Sci. 9:638–661.
2008. View Article : Google Scholar : PubMed/NCBI
|
|
9
|
Lin J, Tang Y, Kang Q, Feng Y and Chen A:
Curcumin inhibits gene expression of receptor for advanced
glycation end-products (RAGE) in hepatic stellate cells in vitro by
elevating PPARγ activity and attenuating oxidative stress. Br J
Pharmacol. 166:2212–2227. 2012. View Article : Google Scholar : PubMed/NCBI
|
|
10
|
Goodwin M, Herath C, Jia Z, Leung C,
Coughlan MT, Forbes J and Angus P: Advanced glycation end products
augment experimental hepatic fibrosis. J Gastroenterol Hepatol.
28:369–376. 2013. View Article : Google Scholar : PubMed/NCBI
|
|
11
|
Hsu WH, Lee BH, Hsu YW and Pan TM:
Peroxisome proliferator-activated receptor-γ activators monascin
and rosiglitazone attenuate carboxymethyllysine-induced fibrosis in
hepatic stellate cells through regulating the oxidative stress
pathway but independent of the receptor for advanced glycation end
products signaling. J Agric Food Chem. 61:6873–6879. 2013.
View Article : Google Scholar : PubMed/NCBI
|
|
12
|
Scheuer PJ: Classification of chronic
viral hepatitis: A need for reassessment. J Hepatol. 13:372–374.
1991. View Article : Google Scholar : PubMed/NCBI
|
|
13
|
Hyogo H and Yamagishi S: Advanced
glycation end products (AGEs) and their involvement in liver
disease. Curr Pharm Des. 14:969–972. 2008. View Article : Google Scholar : PubMed/NCBI
|
|
14
|
Pusterla T, Nèmeth J, Stein I, Wiechert L,
Knigin D, Marhenke S, Longerich T, Kumar V, Arnold B, Vogel A, et
al: Receptor for advanced glycation endproducts (RAGE) is a key
regulator of oval cell activation and inflammation-associated liver
carcinogenesis in mice. Hepatology. 58:363–373. 2013. View Article : Google Scholar : PubMed/NCBI
|
|
15
|
Watson AM, Gray SP, Jiaze L, Soro-Paavonen
A, Wong B, Cooper ME, Bierhaus A, Pickering R, Tikellis C, Tsorotes
D, et al: Alagebrium reduces glomerular fibrogenesis and
inflammation beyond preventing RAGE activation in diabetic
apolipoprotein E knockout mice. Diabetes. 61:2105–2113. 2012.
View Article : Google Scholar : PubMed/NCBI
|
|
16
|
Fehrenbach H, Weiskirchen R, Kasper M and
Gressner AM: Up-regulated expression of the receptor for advanced
glycation end products in cultured rat hepatic stellate cells
during transdifferentiation to myofibroblasts. Hepatology.
34:943–952. 2001. View Article : Google Scholar : PubMed/NCBI
|
|
17
|
Zhang SC, Zheng YH, Yu PP, Min TH, Yu FX,
Ye C, Xie YK and Zhang QY: Lentiviral vector-mediated
down-regulation of IL-17A receptor in hepatic stellate cells
results in decreased secretion of IL-6. World J Gastroenterol.
18:3696–3704. 2012. View Article : Google Scholar : PubMed/NCBI
|
|
18
|
Lee BH, Hsu WH, Hsu YW and Pan TM:
Suppression of dimerumic acid on hepatic fibrosis caused from
carboxymethyl-lysine (CML) by attenuating oxidative stress depends
on Nrf2 activation in hepatic stellate cells (HSCs). Food Chem
Toxicol. 62:413–419. 2013. View Article : Google Scholar : PubMed/NCBI
|
|
19
|
Tang Y and Chen A: Curcumin eliminates the
effect of advanced glycation end-products (AGEs) on the divergent
regulation of gene expression of receptors of AGEs by interrupting
leptin signaling. Lab Invest. 94:503–516. 2014. View Article : Google Scholar : PubMed/NCBI
|
|
20
|
Klironomos S, Notas G, Sfakianaki O,
Kiagiadaki F, Xidakis C and Kouroumalis E: Octreotide modulates the
effects on fibrosis of TNF-α, TGF-β and PDGF in activated rat
hepatic stellate cells. Regul Pept. 188:5–12. 2014. View Article : Google Scholar : PubMed/NCBI
|
|
21
|
Ming-Ju H, Yih-Shou H, Tzy-Yen C and
Hui-Ling C: Hepatitis C virus E2 protein induce reactive oxygen
species (ROS)-related fibrogenesis in the HSC-T6 hepatic stellate
cell line. J Cell Biochem. 112:233–243. 2011. View Article : Google Scholar : PubMed/NCBI
|
|
22
|
Radwan MI, Pasha HF, Mohamed RH, Hussien
HI and El-Khshab MN: Influence of transforming growth factor-β1 and
tumor necrosis factor-α genes polymorphisms on the development of
cirrhosis and hepatocellular carcinoma in chronic hepatitis C
patients. Cytokine. 60:271–276. 2012. View Article : Google Scholar : PubMed/NCBI
|
|
23
|
Yang YY, Liu RS, Lee PC, et al: Anti-VEGFR
agents ameliorate hepatic venous dysregulation/microcirculatory
dysfunction, splanchnic venous pooling and ascites of
NASH-cirrhotic rat. Liver Int. 34:521–534. 2014. View Article : Google Scholar : PubMed/NCBI
|