Introduction
Chronic viral hepatitis infection is a major cause
of liver cirrhosis. The incidence rate of viral hepatitis is high
in China. Precise methods for assessing the stage of liver fibrosis
are required to improve prognosis, monitoring and treatment choice
for patients with chronic viral hepatitis. To date, liver biopsy
remains the most effective approach for the assessment of liver
fibrosis. However, a biopsy is an invasive procedure, which often
results in patient discomfort and bleeding, and may in certain
cases lead to serious complications. In addition, the accuracy of
liver biopsy may be compromised by intra- and interobserver
variability and sample errors (1).
Furthermore, liver biopsies are difficult to conduct repeatedly, in
the cases of patients who require follow-up, due to the
invasiveness of the procedure (1).
Thus, numerous studies have aimed to evaluate noninvasive methods
for the assessment of liver fibrosis (2). These methods include routine
hematological and biochemical testing for fibrosis biomarkers, such
as type IV collagen and hyaluronic acid, aspartate
transaminase-to-platelet ratio index and elastographic methods,
including transient elastography, acoustic radiation force impulse
(ARFI), two-dimensional Shear wave elastography (2D-SWE) and
real-time elastography (RTE) (2).
RTE is a relatively new method for measuring tissue
elasticity, which was initially developed by Hitachi Medical
Systems. In conventional ultrasound scanners, the objects under
observation are physically compressed, while the echo signals of
this displacement are captured and analyzed in real time. A strain
image is obtained, which is color-coded according to the relative
displacement, and is displayed simultaneously against a
conventional 2D image. Thus, the anatomy between the tissue
elasticity image and the conventional B-mode image may be
determined. This technology is capable of calculating the relative
stiffness of tissue (3). On the
color-coded strain image, red indicates that tissue is soft, while
blue indicates hard tissue, such as fibrotic tissue (3). Hence, the higher the ratio of blue area
(%AREA) the stiffer the liver parenchyma and the higher the grade
of liver fibrosis. The liver fibrosis (LF) index may be
subsequently quantified by performing multiple regression analysis
with numerous quantitative image parameters. Previous studies have
applied RTE for the diagnosis of focal lesions in breast (3), thyroid (4) and prostate gland tissues.
In 2007, Friedrich-Rust et al (5) first used RTE technology for the
noninvasive assessment of liver fibrosis in patients with chronic
viral hepatitis. The examinations were performed using freehand
compression and the elasticity score was calculated using a
specific formula. Initially, the intra- and interobserver
variability of RTE were criticized in certain studies (6,7).
Freehand compression may result in liver stiffness values that
differ between observers, and between separate examinations
conducted by a single observer (8).
Furthermore, the parameters for the assessment of liver stiffness
using RTE were not previously standardized. The elasticity score,
which was presented on a scale of 0–5, evaluated the degree of
liver hardness using color on the RTE images; however, the scoring
was subjective. RTE was observed to exhibit poor diagnostic
performance in cases examining the differentiation of liver
fibrosis (9). Since the absolute
value of liver stiffness in RTE was variable, the ‘Strain Ratio’
parameter was constructed. The strain ratio was calculated using
strain values from two regions of interest (ROI). A number of
studies established different procedures for calculating strain
ratios, which used various elastographic signals as references.
Kanamoto et al (10) and Xie
et al (11) used signals from
the intercostal muscle as a reference, while others employed the
small hepatic veins (8,12) and diaphragm (13) as references. However, the strain
ratio is based on a semi-quantitative technique.
Improved RTE results have been reported in numerous
studies (8–18) (Table
I) due to the development of heartbeat-based compression
techniques, as opposed to freehand operation, and the development
of software for the calculation of elasticity parameters by Hitachi
Medical Systems (Tokyo, Japan). Tatsumi et al (14) first used quantitative parameters to
evaluate liver fibrosis with a EUB-8500 digital ultrasound scanner
(Hitachi Medical Systems). Values for nine quantitative imaging
parameters were acquired, which were used to calculate the LF index
with prototype quantitative analysis software. The displacement of
tissue was induced by the heartbeat, as opposed to a freehand
operation. In a later study, Wang et al (16) applied a similar quantitative
technique using a HI VISION Preirus scanner (Hitachi Medical
Systems), and obtained values for 11 parameters that characterized
the stiffness of the liver parenchyma. However, the convex probe
used in this study exhibited lower resolution compared with linear
array probes. In addition, the method employed for calculating the
elastic index with an integrative function formula was overly
complicated and inconvenient for clinical application.
 | Table I.Devices, compression technology,
elastic parameters and results of real-time elastography in
previous studies. |
Table I.
Devices, compression technology,
elastic parameters and results of real-time elastography in
previous studies.
| References | Patients (n) | Device | Compression
method | Elastographic
parameters | Results |
|---|
| Friedrich-Rust (2007)
(5) | 59 | EUB-8500 | Freehand | Elasticity score
(calculated using special formula) | AUROC: 0.75 (F≥F2),
0.73 (F≥F3) and 0.69 (F=F4) |
| Kanamoto (2009)
(10) | 41 | EUB-8500 | Freehand | Elastic ratio (liver
parenchyma/intercostal muscle) | AUROC: 0.951
(F≥F3) |
| Tatsumi (2010)
(14) | 44 | EUB-8500 | Heartbeat | Liver fibrosis
index | Significant
differences were observed between F1/F2, F2/F3 and F2/F3 |
| Morikawa (2011)
(15) | 101 | EUB-8500 | Heartbeat | Four image features
(mean, SD, area and complexity) | AUROC for cirrhosis:
mean, 0.91; SD, 0.84; area, 0.91; and complexity, 0.93 |
| Koizumi (2011)
(8) | 70 | EUB-7500 | Heartbeat | Elastic ratio
(intrahepatic vessel/liver parenchyma) | AUROC: 0.89 (F≥F2),
0.94 (F≥F3) and 0.95 (F=F4) |
| Wang (2012) (16) | 75 | HI VISION
Preirus | Heartbeat | Eleven parameters,
including elastic index | AUROC: 0.93 (F≥F1)
0.92 (F≥F2), 0.84 (F≥F3) and 0.66 (F=F4) |
| Ochi (2012) (12) | 187 | EUB-7500 | Heartbeat | Elastic ratio
(intrahepatic vessel/liver parenchyma) | Diagnostic accuracy:
82.6–96.0% |
| Xie (2012) (11) | 71 | HV-900 | Freehand | Elastic ratio (liver
parenchyma/intercostal muscle) | AUROC: 0.863 (F≥F2)
and 0.797 (F=F4) |
| Ferraioli (2012)
(17) | 130 | EUB-8500 | Heartbeat | Liver fibrosis index
(calculated by special formula) | AUROC: 0.74 (F≥F2),
0.80 (F≥F3) and 0.80 (F=F4) |
| Yada (2013) (18) | 245 | HI VISION
Preirus | Heartbeat | Liver fibrosis
index | AUROC: 0.865
(F≥F3) |
| Chung (2013)
(9) | 74 | HI VISION
Preirus | Not mentioned | Elasticity score
(0–5) | AUROC: 0.507 (F≥F2)
and 0.767 (F=F4) |
| Paparo (2013)
(13) | 60 | MyLab Twice | Freehand | Elastic ratio
(diaphragm/liver parenchyma) | AUROC: 0.86 (F≥F2)
and 0.909 (F≥F3) |
In the present study, the new HI VISION Avius
quantitative ultrasound scanner (Hitachi Medical Systems), which
included an updated version of Liver-Elasto software, was used to
evaluate the liver fibrosis stage in patients with chronic
hepatitis. The software automatically calculated a total of 12
quantitative parameters, of which the LF index and %AREA were the
two most important parameters for determining the degree of liver
fibrosis. The present study aimed to investigate the optimal
diagnosis cut-off value for the LF index and %AREA in the
differential diagnosis of liver cirrhosis and fibrosis stage, and
to compare the efficacy of the two parameters.
Materials and methods
Patients
Between January 2011 and February 2013, 120 patients
(male, 87 male; female, 33; mean age, 44.1±9 years) with chronic
hepatitis were recruited from Tongji University Hospital (Shanghai,
China). The study population consisted of 111 patients with
hepatitis B and nine patients with hepatitis C. All patients
underwent a liver biopsy. The study criteria excluded patients with
other chronic diseases that may have influenced the hepatic
parenchyma and the degree of liver stiffness, including congestive
heart disease, chronic renal disease, hematonosis, biliary
obstructive disease and fatty liver (6). The study was conducted in accordance
with the Declaration of Helsinki and with approval from the
Institutional Ethics Committee of Tongji University Hospital.
Written consent was obtained from all participants.
Liver histology
Following the elastography examination, liver biopsy
samples were obtained from the right liver lobe via the right
intercostal space under ultrasonographic guidance. Biopsy specimens
were fixed in 4% formalin, and stained with hematoxylin. Liver
fibrosis stages were evaluated semi-quantitatively, according to
the METAVIR scoring system (19).
The degree of liver fibrosis was staged on a F0-F4 scale: F0, no
fibrosis; F1, portal fibrosis without septa; F2, portal fibrosis
with few septa; F3, numerous septa without cirrhosis; and F4,
cirrhosis. In accordance with the METAVIR scoring system, the
stages of liver fibrosis were defined as non-liver fibrosis (F0),
liver fibrosis (F1-F4), non-cirrhosis (F0-F3) and liver cirrhosis
(F4).
RTE examination
RTE was performed using a HI VISION Avius scanner,
equipped with a EUP-L52 linear probe with a central frequency of
3–7 MHz and quantitative analysis software. Patients were examined
while in the supine position with the right arm elevated above the
head. The probe was placed in the 5–8 intercostal space between the
anterior axillary line and mid-axillary line, in order to display
the liver parenchyma of the right anterior lobe. In this section,
the right branch of the portal vein was visible, while the main
portal vein was not. The probe was slightly inclined towards the
direction of the heartbeat. As there were multiple reflection
echoes from the liver capsule, the upper edge of the ROI (area,
2.5×2.5 cm) was set 1 cm below the liver capsule. The ROI was
selected in accordance with the following guidelines: i) Avoid the
main pipeline structures or vessels in the liver parenchyma; ii)
avoid the rib acoustic shadow; iii) avoid sampling deep in the
liver parenchyma, which may not result in clear elastic images.
Blue-green-red elastic images were formed while
subjects held their breath, using the subjects heartbeat rhythm to
induce the displacement of tissue. The valley of one of five stable
waves was selected to form the stable static elastic image, after
which quantitative analysis was initiated. An area within the ROI
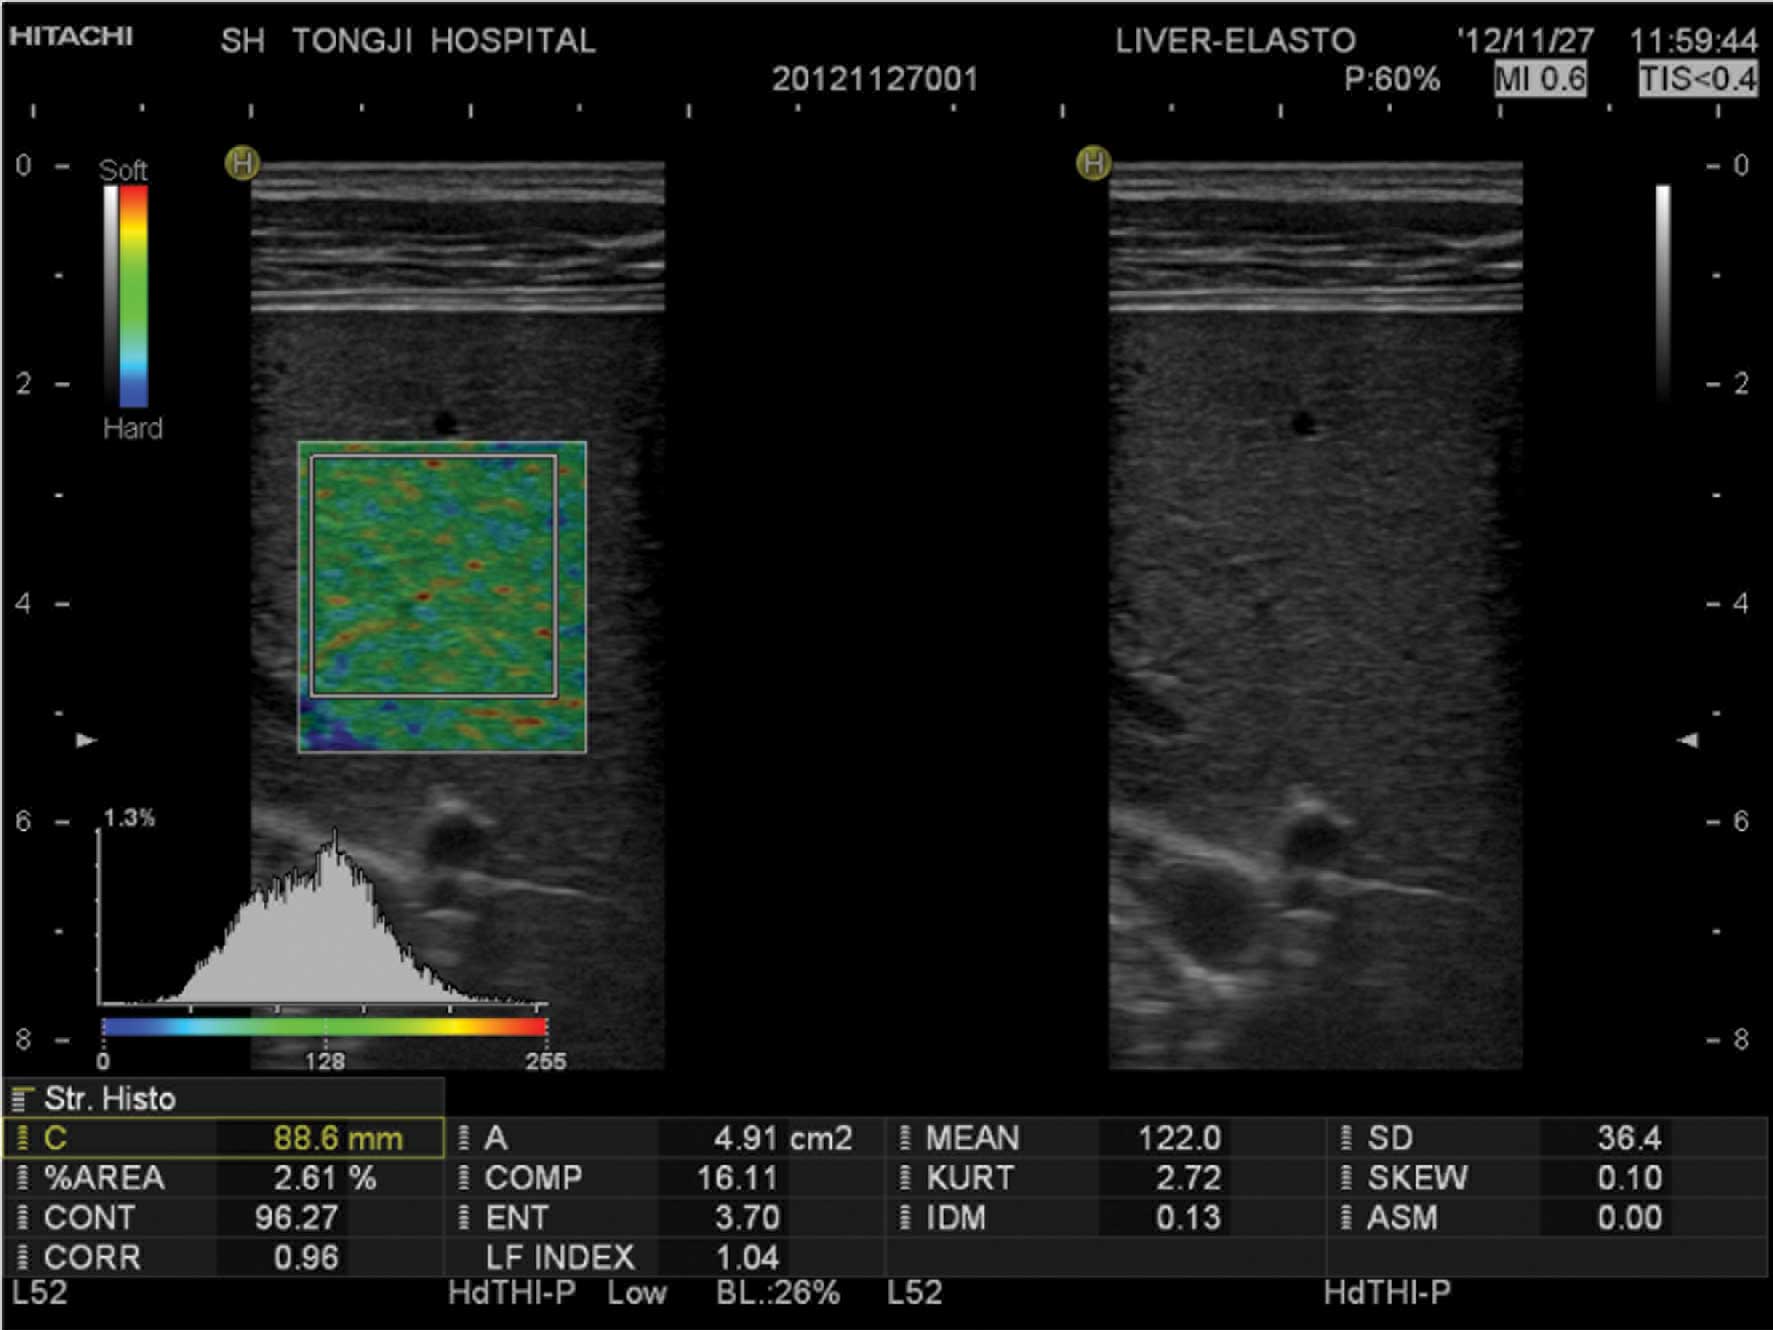
of ≥3 cm2 was selected as the analysis region. Values
for the following 12 quantitative elastic imaging parameters were
subsequently obtained: Mean relative strain value, standard
deviation of relative strain value, %AREA, complexity of blue area,
skewness of strain histogram, kurtosis of strain histogram,
contrast, entropy, inverse difference moment, angular second
moment, correlation and the LF index (Fig. 1). The procedure was repeated three
times and the mean value was calculated as the final result.
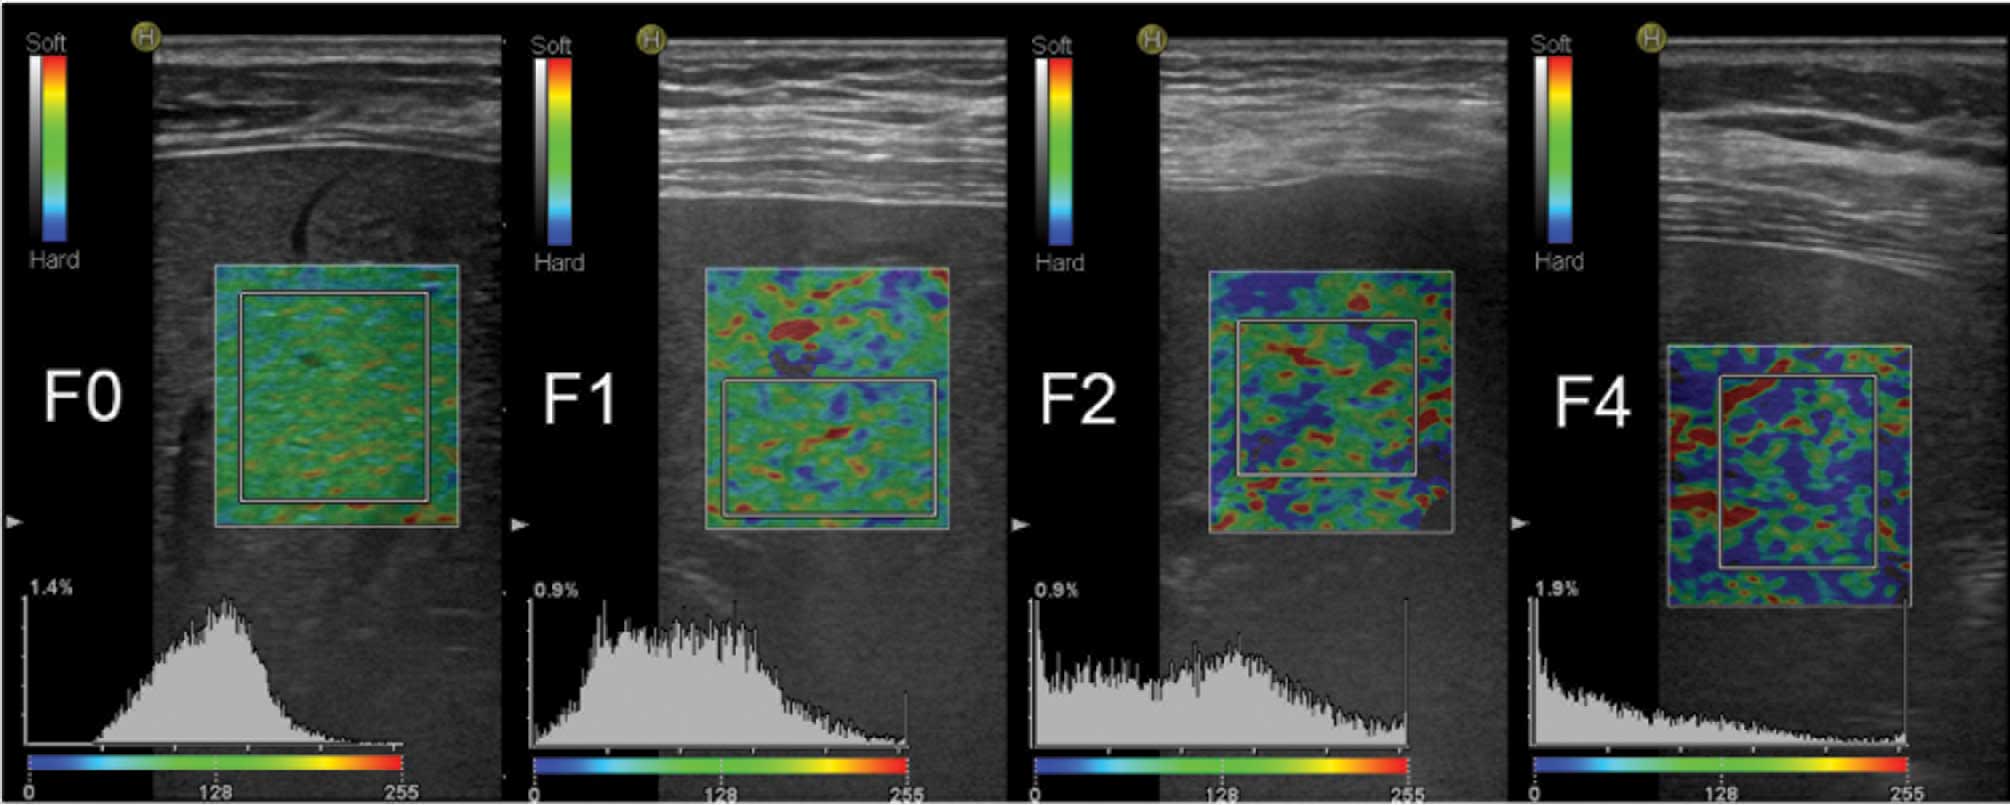
Definitions of the elastic image and quantitative
parameters were as follows: In the 2D elastic image of the ROI,
green coding represented tissue of average stiffness, red coding
represented a lower than average stiffness and the blue coding
represented harder than average stiffness. The elastic parameters
were calculated automatically using Liver-Elasto software without
post-processing. The %AREA represented the relative percentage of
pixels in the ROI with a lower than average deformation. The more
advanced the stage of liver fibrosis, the stiffer the liver
parenchyma. Therefore, the larger the relative area with lower than
average deformation, the larger the blue area in the ROI (Fig. 2). The LF index was calculated using a
multiple linear regression equation involving 11 parameters, which
represented the degree of liver fibrosis. The higher the LF index,
the greater the degree of liver fibrosis.
Statistical analysis
SPSS software, version 20.0 (IBM SPSS, Armonk, NY,
USA) was used for statistical analysis. The liver biopsy result was
used as the reference for diagnosis comparison. Measurement data
are expressed as the mean ± standard deviation. Spearmans
correlation analysis was conducted to assess the correlation
between the quantitative parameters and the liver fibrosis grade.
The LF index and %AREA of the four groups (non-hepatic fibrosis,
hepatic fibrosis, non-cirrhosis and liver cirrhosis stages) were
analyzed for normality using the Kolmogorov-Smirnov test.
Comparison of the mean values between two normal distribution
groups was performed using a two-sample Students t-test. In cases
of heterogeneity of variance, the nonparametric Mann-Whitney U test
was used. The diagnostic performances of the LF index and %AREA for
early cirrhosis and liver fibrosis stage were assessed using
receiver operating characteristic (ROC) curves. The area under the
curve (AUC) was calculated and compared using the Z test. The
maximum Youden's index was calculated to identify the optimal
cut-off value for the diagnosis of early cirrhosis and liver
fibrosis, and to calculate the sensitivity, specificity, accuracy
and positive predictive values. P<0.05 was considered to
indicate a statistically significant difference.
Results
Correlation analysis
Spearmans rank correlation analysis was performed
using SPSS software. A good correlation was observed between the LF
index and the %AREA with the pathological stage; the correlation
coefficient values were 0.711 (P<0.001) and 0.632 (P<0.001),
respectively. Of the 120 patients with chronic hepatitis, 33 were
classified as stage F0, 27 had stage F1, 21 were classified as
stage F2, 18 had stage F3 and 21 exhibited stage F4. The
statistical values of the two main elastic quantitative parameters
for each liver fibrosis stage are presented in Table II.
| Table II.Values of the elastic quantitative
parameters for each stage of liver fibrosis. |
Table II.
Values of the elastic quantitative
parameters for each stage of liver fibrosis.
| Parameters | F0 stage
(n=33) | F1 stage
(n=27) | F2 stage
(n=21) | F3 stage
(n=18) | F4 stage
(n=21) |
|---|
| %AREA |
15.20±7.97 |
18.76±8.63 |
23.67±13.63 |
24.75±8.38 |
44.42±7.35 |
| LF index |
2.03±0.54 |
2.26±0.53 |
2.48±0.78 |
2.97±0.35 |
4.10±0.49 |
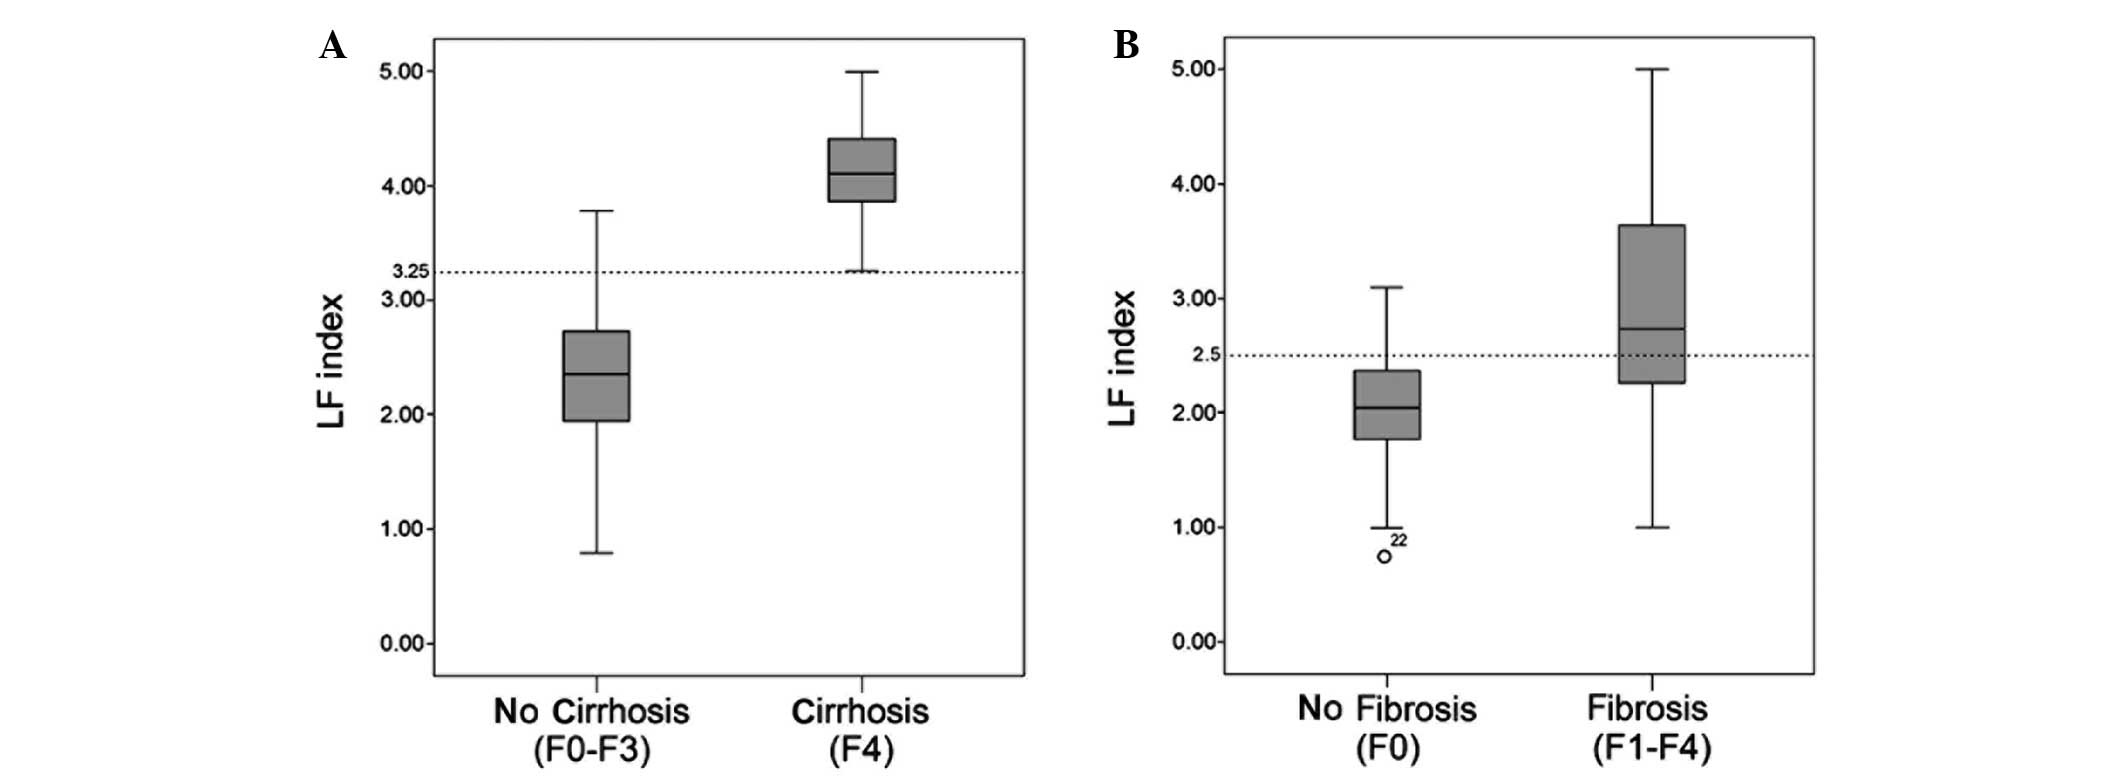
Comparison of RTE parameters
In the no liver cirrhosis stages (F0-F3; n=99), the
LF index was 2.36±0.65, while for the early cirrhosis stage (F4;
n=21), the LF index was 4.10±0.49. The LF index of the two groups
showed normal distribution, and statistically significant
differences were observed in the LF index between the two groups
(P<0.001). The LF index values for the no hepatic fibrosis (F0;
n=33) and hepatic fibrosis stages (F1-F4; n=87) were 2.03±0.54 and
2.91±0.90, respectively. The LF index of the two groups exhibited
normal distribution. However, due to the presence of heterogeneity
of variance, two independent samples nonparametric tests and the
Mann-Whitney U test were performed, and statistically significant
differences in LF index were identified between the two groups
(P<0.001; Fig. 3).
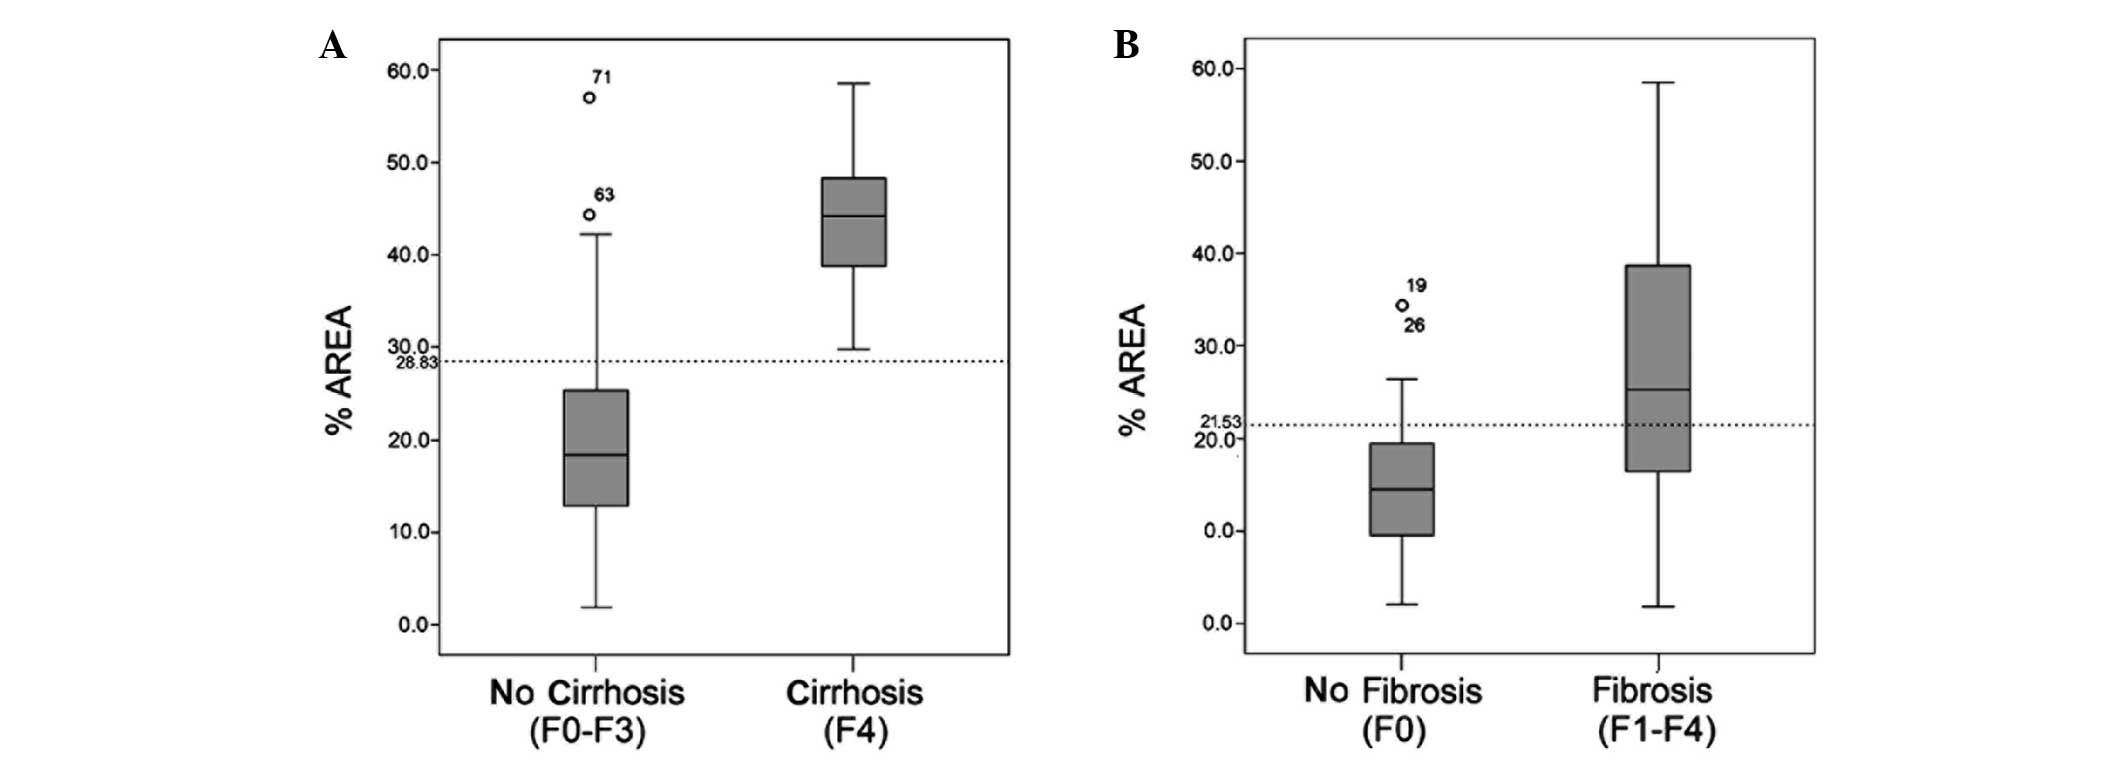
The %AREA values for the early liver cirrhosis (F4;
n=21) and no liver cirrhosis (F0-F3; n=99) groups were 19.70±10.28
and 44.42±7.35, respectively. The %AREA of the two groups exhibited
a normal distribution and a statistically significant difference
was observed in the %AREA between the two groups (P<0.001). The
%AREA values for the no hepatic fibrosis (F0; n=33) and hepatic
fibrosis (F1-F4; n=87) stages were 15.20±7.97 and 27.38±13.83,
respectively. The %AREA values of the two groups exhibited normal
distribution; however, due to the presence of heterogeneity of
variance, two independent samples nonparametric tests and the
Mann-Whitney U test were performed. A statistically significant
difference in the %AREA was observed between the two groups
(P<0.001; Fig. 4).
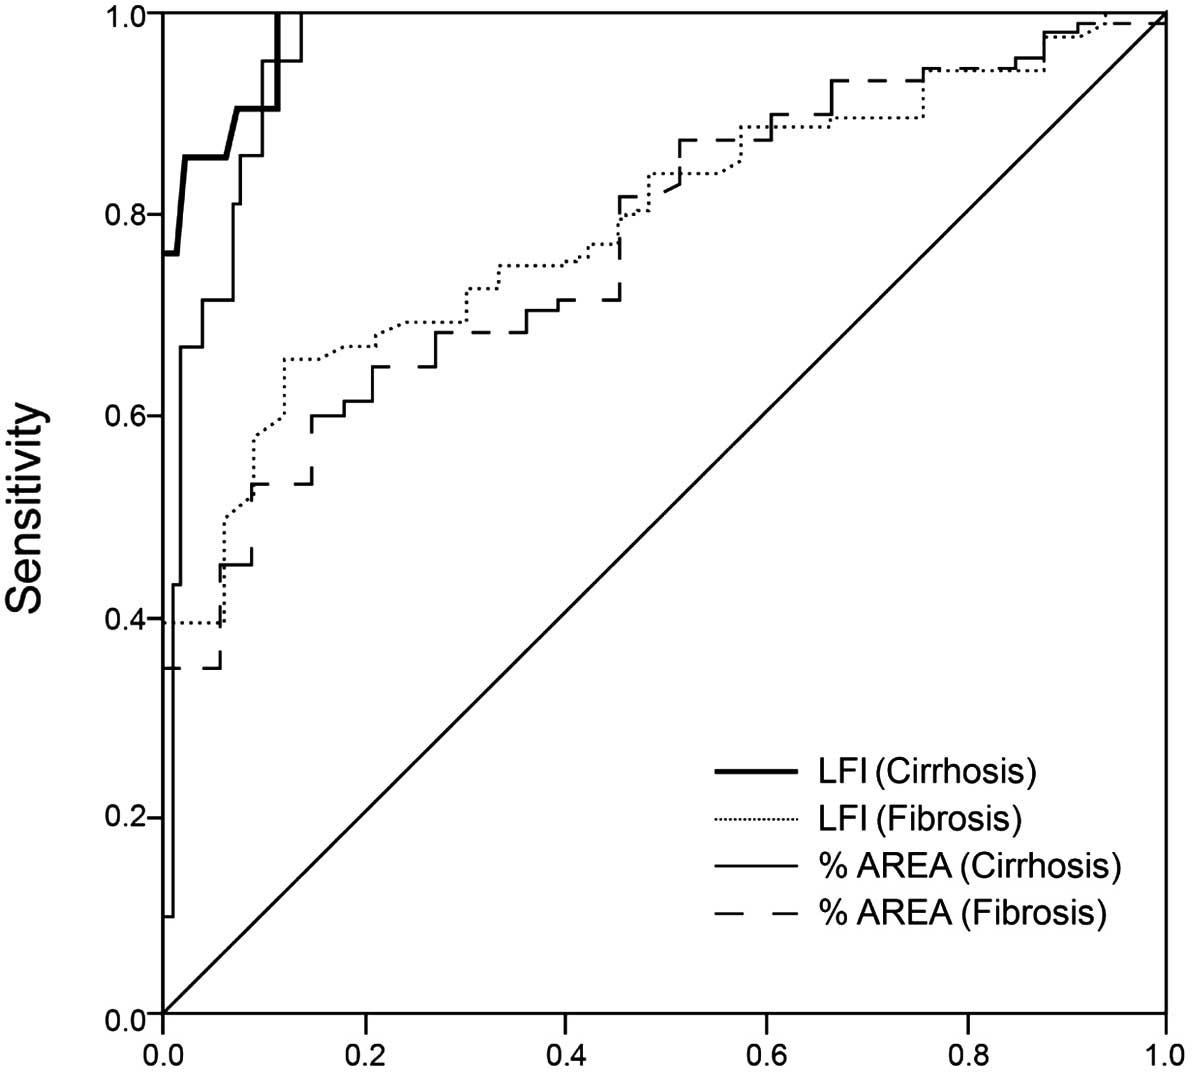
ROC curve analysis
ROC curves were produced for the LF index and %AREA
in diagnosing liver cirrhosis and fibrosis stage (Fig. 5). AUC values for the diagnosis of
liver cirrhosis and fibrosis using the LF index were 0.985 and
0.790, respectively, while using the %AREA, the AUC values were
0.963 and 0.770, respectively. According to the maximum Youdens
index, the optimal LF index values for the diagnosis of liver
cirrhosis and fibrosis stage were 3.25 and 2.5, respectively. The
sensitivity of an LF index of >3.25 in the diagnosis of
cirrhosis stage was 100%, the specificity was 88.9%, the accuracy
was 90.8%, the positive predictive value was 65.6% and the Youdens
index value was 88.9%. The sensitivity of an LF index of >2.5 in
the diagnosis of liver fibrosis stage was 65.5%, the specificity
was 87.9%, the accuracy was 71.7%, the positive predictive value
was 93.4% and the Youdens index value was 53.4%. According to the
maximum Youdens index, the optimal %AREA values for the diagnosis
of liver cirrhosis and liver fibrosis stage were 28.83 and 21.53%,
respectively. The sensitivity of a %AREA of >28.83 in the
diagnosis of cirrhosis stage was 100%, the specificity was 85.9%,
the accuracy was 88.3%, the positive predictive value was 60% and
the Youdens index value was 85.9%. The sensitivity of a %AREA of
>21.53 in the diagnosis of liver fibrosis stage was 59.8%, the
specificity was 84.8%, the accuracy was 66.7%, the positive
predictive value was 91.2% and the Youdens index value was 44.6%
(Fig. 5).
The AUC values of the four groups were compared
using the Z-test. No statistically significant difference was
observed in the ROC curve between the LF index and %AREA for the
diagnosis of early cirrhosis (Z=1.20; P=0.23). Furthermore, no
statistically significant difference was identified in the ROC
curve between the LF index and %AREA for the diagnosis of liver
fibrosis (Z=0.33; P=0.74). These results indicated that the LF
index and %AREA parameters possess a similar efficacy in the
diagnosis of early liver cirrhosis and fibrosis.
However, a statistically significant difference was
observed in the AUC values for the LF index between the diagnosis
of early liver cirrhosis and fibrosis (Z=4.65; P<0.001). In
addition, a statistically significant difference in the AUC values
for the %AREA was identified between the diagnosis of early liver
cirrhosis and fibrosis (Z=4.12; P<0.001). These findings
indicated that the efficacy of the LF index and %AREA was higher
for the diagnosis of liver cirrhosis compared with the diagnosis of
liver fibrosis.
Discussion
Numerous studies have investigated novel noninvasive
methods for diagnosing liver cirrhosis and fibrosis with the
potential to replace liver biopsy. Two primary noninvasive methods
exist for the diagnosis the liver fibrosis. One method is based on
blood serum markers or indices comprising different combinations of
serum markers, such as the FibroTest® (APHP Assistance Publique,
Paris, France), while the other method, elastography, is based on
the measurement of tissue elasticity. Elastography was initially
proposed by Ophir et al in 1991 (20) and gradually developed into a
relatively mature imaging tool. Elastography techniques include
transient elastography (FibroScan®; Echosens, Paris, France), ARFI
(Siemens AG, Munich, Germany), 2D-SWE (Aixplorer®, SuperSonic
Imagine (SSI), France) and RTE (Hitachi Medical Systems,).
In 2007, Frederich-Rust et al (5) reported the preliminary clinical
application of RTE for the assessment of liver fibrosis. The
authors established a quantitative elasticity score, calculated by
assessing color-coded strain images using the Matlab computer
program (MathWorks, Inc., Natick, MA, USA). Freehand compression of
the probe was employed and a scale of 0–6 arbitrary units was
applied for pressure measurement. However, the inter- and
intraobserver variability of RTE was criticized. The freehand
method of applying compression was an influential factor that may
vary significantly and be difficult to standardize. Observers with
different levels of experience and training may affect the results
of the RTE examination by applying varying levels of freehand
pressure. However, RTE technology is continuously improving and
developing. For example, the compression required for generating
elastic deformation of the ROI, initially induced by a freehand
operation (5,10,11), may
now be supplied by the regular cardiovascular pulsation of the
patient (8,12,14–18),
which reduces the subjective error inherent in the manual
application of pressure. Furthermore, the elastic parameters have
progressed from the initial qualitative elasticity scores (0–5)
(9) to a semi-quantitative strain
rate ratio method (8,10–12), and
finally to the quantitative parameters currently available, such as
the elastic index (14–18). In addition, elastic parameters are
now generated using a number of static color-coded images or video
clips, which are analyzed by computer software, rather than a
single static image captured selectively by observers. As the
examiner may intentionally select the best images from a dynamic
clip, selection bias is usually high during analysis of a single
static image (5,15,21,22).
Previous studies have demonstrated that RTE imaging is not
constrained by ascites (23),
distance (23) or by the position of
the liver lobes (8), in addition to
exhibiting good repeatability for different operators between and
within groups (8,22). In 2010, Tatsumi et al
(14) first evaluated a prototype
quantitative RTE technique using an EUB-8500 ultrasound scanner.
Six RTE images were collected per patient and analyzed using the
included software to calculate nine image parameters, including the
ratio of blue area, complexity of blue area and the mean relative
strain value. Multiple regression analysis was performed on the
nine image parameters to quantify the LF index. In order to
overcome the problems of freehand operation, newer RTE modules were
designed to produce elastograms generated by the heartbeat of the
patient. In the present study, a new generation RTE technique,
developed by Hitachi Medical Systems, was employed. The technique
utilized RTE quantitative analysis software, relying on the
patients own cardiovascular pulsation to produce compression. A
total of 12 quantitative parameters were calculated automatically
using the updated software integrated in the HI VISION Avius
ultrasound scanner.
Previous animal models (24) and clinical studies (16–18) have
suggested that the LF index is an effective parameter for
evaluating the degree of liver fibrosis. The LF index has been
demonstrated to correlate well with the histological grade, and may
be clinically applicable for the diagnosis of liver cirrhosis and
fibrosis. In the present study, the diagnostic value of the LF
index and %AREA were simultaneously evaluated. A good correlation
was observed between the LF index and the stage of liver fibrosis,
which was superior compared with the correlation with %AREA. The
higher the value of the %AREA and LF index parameters, the higher
the indicated degree of liver fibrosis. Whether using the LF index
or the %AREA, the values of the two groups exhibited increased
overlap when discriminating between cases with and without liver
fibrosis. These results suggested that the differential ability in
distinguishing between patients with and without liver fibrosis was
reduced. This conclusion was additionally confirmed by the size of
the AUC for the two quantitative parameters (0.790 and 0.770,
respectively), which were lower than those in distinguishing
between patients with or without liver cirrhosis (0.985 and 0.963,
respectively). The two quantitative parameters exhibited less
overlap in distinguishing a diagnosis between those with and
without cirrhosis. The specificity, sensitivity and accuracy values
for the LF index and %AREA in the diagnosis of cirrhosis stage were
higher compared with those for the diagnosis of liver fibrosis,
indicating that the LF index and %AREA had a higher reliability in
the diagnosis of early liver cirrhosis compared with the diagnosis
of liver fibrosis. However, during the simultaneous diagnosis of
early liver cirrhosis and fibrosis, no statistically significant
difference was identified in the AUC between the LF index and
%AREA, which indicated that the two quantitative parameters
possessed a similar efficacy.
An additional problem with assessing the efficacy of
RTE parameters is that the placement of the ROI in liver
elastography differs between studies. Friedrich-Rust et al
(5) and Tatsumi et al
(14) set the elastography ROI
entirely inside the liver parenchyma. Alternative studies (6,11) have
criticized this placement. These studies suggest that the ROI for
elastography should include the targeted liver parenchyma and the
surrounding tissues, which have a mixed strain that contains soft
tissue (subcutaneous adipose tissue) and harder tissue (diaphragm
and intercostal muscles). Since the average strain inside the ROI
is computed relatively in RTE, placement of the ROI inside the
liver may lead to technical errors. Authors who suggested this
hypothesis considered that the surrounding tissues possessed
similar elasticity in all patients, regardless of the stage of
their condition. However, in the present study, placing the ROI
entirely inside the liver did not reduce the accuracy of the
experiment.
However, there remain a number of factors that
influence the results of RTE imaging. Firstly, the breathing
cooperation of patients is crucial, and the patient is required to
hold their breath during the inspection process to exclude the
liver displacement caused by breathing. Certain patients exhibit
poor compliance and are unable to hold their breath, which may
waste time and energy, and affect the stability and analysis
results of the elastic image. Secondly, the generation of the
elastic images no longer depends on the operator to apply
compression. Tissue compression may now be induced by the rhythmic
beats of the heart on the ROI, which limits human error to a
certain extent and improves the reliability and reproducibility of
data. However, different patients exhibit different heart rates,
which are difficult to subject to quantized control. The effects of
heart rate variation on the efficacy of RTE examination and
subsequent quantitative analysis require further study. Thirdly,
with regard to the results of the present study, the efficacy of
RTE for the differential diagnosis of liver cirrhosis and fibrosis
requires confirmation in further studies with an enlarged sample
population and multicentric design. In addition, the intra-observer
variability of this novel technology requires further study.
Therefore, future prospective studies with blinded comparisons are
required to compare the efficacy of RTE with alternative
elastography techniques, including transient elastography and ARFI,
for the assessment of liver fibrosis.
In conclusion, RTE imaging is an effective method
for the noninvasive assessment of liver fibrosis. The LF index and
%AREA are two key parameters that may aid in the early clinical
diagnosis of liver cirrhosis.
References
|
1
|
Sumida Y, Nakajima A and Itoh Y:
Limitations of liver biopsy and non-invasive diagnostic tests for
the diagnosis of nonalcoholic fatty liver disease/nonalcoholic
steatohepatitis. World J Gastroenterol. 20:475–485. 2014.
View Article : Google Scholar : PubMed/NCBI
|
|
2
|
Frulio N and Trillaud H: Ultrasound
elastography in liver. Diagn Interv Imaging. 94:515–534. 2013.
View Article : Google Scholar : PubMed/NCBI
|
|
3
|
Itoh A, Ueno E, Tohno E, et al: Breast
disease: clinical application of US elastography for diagnosis.
Radiology. 239:341–350. 2006. View Article : Google Scholar : PubMed/NCBI
|
|
4
|
Rago T, Santini F, Scutari M, et al:
Elastography: new developments in ultrasound for predicting
malignancy in thyroid nodules. J Clin Endocrinol Metab.
92:2917–2922. 2007. View Article : Google Scholar : PubMed/NCBI
|
|
5
|
Friedrich-Rust M, Ong MF, Herrmann E, et
al: Real-time elastography for noninvasive assessment of liver
fibrosis in chronic viral hepatitis. AJR Am J Roentgenol.
188:758–764. 2007. View Article : Google Scholar : PubMed/NCBI
|
|
6
|
Sãftoiu A, Gheonea DI and Ciurea T: Hue
histogram analysis of real-time elastography images for noninvasive
assessment of liver fibrosis. AJR Am J Roentgenol. 189:W232–W233.
2007. View Article : Google Scholar : PubMed/NCBI
|
|
7
|
Ferraioli G, Gulizia R and Filice C:
Real-time elastography in the assessment of liver fibrosis. AJR Am
J Roentgenol. 189:W1702007. View Article : Google Scholar : PubMed/NCBI
|
|
8
|
Koizumi Y, Hirooka M, Kisaka Y, et al:
Liver fibrosis in patients with chronic hepatitis C: noninvasive
diagnosis by means of real-time tissue elastography - establishment
of the method for measurement. Radiology. 258:610–617. 2011.
View Article : Google Scholar : PubMed/NCBI
|
|
9
|
Chung JH, Ahn HS, Kim SG, et al: The
usefulness of transient elastography, acoustic-radiation-force
impulse elastography, and real-time elastography for the evaluation
of liver fibrosis. Clin Mol Hepatol. 19:156–164. 2013. View Article : Google Scholar : PubMed/NCBI
|
|
10
|
Kanamoto M, Shimada M, Ikegami T, et al:
Real time elastography for noninvasive diagnosis of liver fibrosis.
J Hepatobiliary Pancreat Surg. 16:463–467. 2009. View Article : Google Scholar : PubMed/NCBI
|
|
11
|
Xie L, Chen X, Guo Q, et al: Real-time
elastography for diagnosis of liver fibrosis in chronic hepatitis
B. J Ultrasound Med. 31:1053–1060. 2012.PubMed/NCBI
|
|
12
|
Ochi H, Hirooka M, Koizumi Y, et al:
Real-time tissue elastography for evaluation of hepatic fibrosis
and portal hypertension in nonalcoholic fatty liver diseases.
Hepatology. 56:1271–1278. 2012. View Article : Google Scholar : PubMed/NCBI
|
|
13
|
Paparo F, Cevasco L, Zefiro D, et al:
Diagnostic value of real-time elastography in the assessment of
hepatic fibrosis in patients with liver iron overload. Eur J
Radiol. 82:e755–e761. 2013. View Article : Google Scholar : PubMed/NCBI
|
|
14
|
Tatsumi C, Kudo M, Ueshima K, et al:
Non-invasive evaluation of hepatic fibrosis for type C chronic
hepatitis. Intervirology. 53:76–81. 2010. View Article : Google Scholar : PubMed/NCBI
|
|
15
|
Morikawa H, Fukuda K, Kobayashi S, et al:
Real-time tissue elastography as a tool for the noninvasive
assessment of liver stiffness in patients with chronic hepatitis C.
J Gastroenterol. 46:350–358. 2011. View Article : Google Scholar : PubMed/NCBI
|
|
16
|
Wang J, Guo L, Shi X, Pan W, Bai Y and Ai
H: Real-time elastography with a novel quantitative technology for
assessment of liver fibrosis in chronic hepatitis B. Eur J Radiol.
81:e31–e36. 2012. View Article : Google Scholar : PubMed/NCBI
|
|
17
|
Ferraioli G, Tinelli C, Malfitano A, et
al: Performance of real-time strain elastography, transient
elastography, and aspartate-to-platelet ratio index in the
assessment of fibrosis in chronic hepatitis C. AJR Am J Roentgenol.
199:19–25. 2012. View Article : Google Scholar : PubMed/NCBI
|
|
18
|
Yada N, Kudo M, Morikawa H, et al:
Assessment of liver fibrosis with real-time tissue elastography in
chronic viral hepatitis. Oncology. 84 (Suppl 1):13–20. 2013.
View Article : Google Scholar : PubMed/NCBI
|
|
19
|
Bedossa P and Poynard T: An algorithm for
the grading of activity in chronic hepatitis C. The METAVIR
Cooperative Study Group. Hepatology. 24:289–293. 1996. View Article : Google Scholar : PubMed/NCBI
|
|
20
|
Ophir J, Céspedes I, Ponnekanti H, Yazdi Y
and Li X: Elastography: A quantitative method for imaging the
elasticity of biological tissues. Ultrason Imaging. 13:111–134.
1991. View Article : Google Scholar : PubMed/NCBI
|
|
21
|
Fiorini E, Cipriano V, De Molo C, et al:
Real-time elastography as a noninvasive technique for
quantification of fibrosis in patients with chronic viral liver
disease: Preliminary findings. J Ultrasound. 15:220–225. 2012.
View Article : Google Scholar : PubMed/NCBI
|
|
22
|
Gheonea DI, Săftoiu A, Ciurea T, et al:
Real-time sono-elastography in the diagnosis of diffuse liver
diseases. World J Gastroenterol. 116:1720–1726. 2010. View Article : Google Scholar
|
|
23
|
Hirooka M, Koizumi Y, Hiasa Y, et al:
Hepatic elasticity in patients with ascites: Evaluation with
real-time tissue elastography. AJR Am J Roentgenol. 196:W766–W771.
2011. View Article : Google Scholar : PubMed/NCBI
|
|
24
|
Lin SH, Ding H, Mao F, et al: Non-invasive
assessment of liver fibrosis in a rat model: Shear wave elasticity
imaging versus real-time elastography. Ultrasound Med Biol.
39:1215–1222. 2013. View Article : Google Scholar : PubMed/NCBI
|