Introduction
Glioblastoma multiforme is the most common and
severe type of brain tumor, which presents unique challenges to
therapy due to its location, aggressive biological behavior and
diffuse infiltrative growth. The survival times of patients with a
glioblastoma are very short. Even with combined treatment including
complete surgery, radiotherapy and chemotherapy, the survival time
is estimated to be between 12 and 18 months following diagnosis
(1). Chemotherapy is often used as a
secondary treatment method for glioblastomas following the removal
of the tumor by surgery, in order to prevent tumor recurrence
(2). Since a curative outcome is
unable to be achieved by surgery only, chemotherapy has become an
essential adjuvant therapy for glioblastomas following surgery.
Thus, the key to successfully achieving remission in glioma cases
is to target the remaining tumor cells, including glioma stem cells
(GSCs), by thorough chemotherapy following surgery.
The existence of drug resistance to chemotherapy in
glioma cases has led to the inefficiency of chemotherapeutic drugs
and the increased risk of tumor recurrence following treatment
(3). In recent years, the
establishment of the ‘cancer stem cell theory’ and the further
study of multidrug resistance-associated protein (MRP)1 and 3 genes
have provided a new research direction for glioma chemotherapy drug
resistance. Compared with normal glioma cells, a stronger drug
resistance to chemotherapy can be observed in the stem cells
isolated from gliomas (4). The main
reason underlying the chemotherapy drug resistance of glioma is the
ability of GSCs to generate strong chemotherapeutic drug
resistance, resulting in the patient becoming resistant to
chemotherapy drugs and ultimately leading to tumor recurrence
(5). According to the cancer stem
cell hypothesis, the key to completely removing cancer cells is not
only targeting the remaining glioma cells, but also targeting the
cancer stem cells. Thus, GSCs have become increasingly studied with
regard to chemotherapy drug resistance.
Livin (also known as KIAP or ML-IAP) is a member of
the apoptosis protein suppressor (inhibitor of apoptosis protein;
IAP) family. Among the eight members of the IAP family, only Livin
has two subunits with α and β structures; which are combined to
exert a stronger antiapoptotic function compared with the other
members of the IAP family (6). Livin
has been shown to play a key role in cell apoptosis, cell
proliferation and the cell cycle (7). Previous studies demonstrated that Livin
was overexpressed in glioblastoma, and that a correlation existed
between Livin and chemotherapy drug resistance (8,9). Thus,
the present study assessed Livin as a target, and conducted
lentiviral transfection of siRNA-Livin in order to investigate the
effect of Livin on chemotherapy drug resistance in a glioma U251
cell line and U251 CD133+ stem cells.
Materials and methods
Chemicals and reagents
Dulbecco's modified Eagle's medium/nutrient mixture
F-12 Ham's (DMEM/F12) with high glucose medium was purchased from
GE Healthcare (HyClone; Logan, UT, USA). Fetal bovine serum (FBS),
trypsin, streptomycin, benzopenicillin and B-27 (1X) serum-free
Supplement were purchased from Gibco Life Technologies (Grand
Island, NY, USA). Epidermal growth factor (EGF), basic fibroblast
growth factor (bFGF) and leukemia inhibitory factor (LIF) were
obtained from Peprotech (Rocky Hill, NJ, USA). A CD133 cell
isolation kit (magnetic-activated cell sorting method) was
purchased from Miltenyi Biotec GmbH (Bergisch Gladbach, Germany),
while the lentivirus was provided by Shanghai GeneChem Co., Ltd.
(Shanghai, China). The Cell Counting Kit-8 (CCK-8) was obtained
from Dojindo Molecular Technologies, Inc. (Kumamoto, Japan), while
temozolomide (TMZ) was purchased from Tasly Pharmaceutical Co.,
Ltd. (Tianjin, China). SYBR Green I fluorochrome was purchased from
Biotium, Inc. (Hayward, CA, USA) and MMLV Reverse Transcriptase was
purchased from Aidlab Biotechnologies, Co., Ltd. (Beijing,
China).
Glioma cell line culture
A glioma U251 cell line was purchased from the China
Center for Typical Culture Collection (Wuhan, China). The cell line
was cultured in DMEM/F12, containing 10% FBS, 100 µg/ml
streptomycin and 100 U/ml benzylpenicillin, under conditions of
37°C, 5% CO2 and saturated humidity.
Isolation, identification and
cultivation of CD133+ GSCs
The isolation and identification of
CD133+ GSCs was performed according to previous studies
(10,11). In brief, the U251 cells were
collected and cultivated in serum-free medium [neural stem cell
(NSC) medium], containing DMEM/F12 with high glucose medium, 20
ng/ml EGF, 20 ng/ml bFGF, 10 ng/ml LIF and B-27 (1X) Supplement,
under conditions of 37°C, 5% CO2 and saturated humidity. The medium
was replaced every 3–4 days. After 8–10 days of cultivation, a
large number of neurospheres was observed. The neurospheres were
collected and the CD133+ cells were separated from the
spheres using a magnetic-activated cell sorting technique. The
sorting processes were performed according to the instructions of
the CD133 cell isolation kit. Following cell sorting, the
CD133+ cells were cultivated in NSC medium.
Immunofluorescence staining
Well-grown cell spheres were selected for growing on
slides coated with polylysine. After drying at 37°C, the slides
were washed with phosphate-buffered saline (PBS) three times. The
cells were fixed with paraform for 30 min at room temperature, then
washed with PBS a further three times. After blocking with 5% goat
serum at 37°C for 30 min, primary monoclonal rabbit anti-human
nestin (1:30; BA1289, Boster, Wuhan, China) diluted in 1% BSA was
added and the cells were placed in a wet box overnight.
Subsequently, the cells were washed with PBS, then secondary
monoclonal goat anti-rabbit IgG-fluorescein isothiocyanate antibody
(1:50; BA1105, Boster) diluted in 1% BSA was added for incubation
for 30 min at 37°C. In addition, a negative control in which PBS
was used instead of the primary antibody was performed. The slides
were observed using an Olympus BX51 fluorescence microscope
(Olympus Corporation, Tokyo, Japan). Immunofluorescent assays for
glial fibrillary acidic protein (GFAP) and β-tubulin in the
differentiated stem cells were conducted using an identical
protocol as that used for nestin, with the exception of the
respective antibodies. GFAP and β-tubulin were used to identify
glioma cells. They were detected by immunofluorescence using
monoclonal GAFP (1:30; BA0056; Boster) antibody diluted in 1% BSA
and monoclonal β-tubulin (1:30; BM1453; Boster).
Lentiviral transfection
According to a preliminary experiment, the
multiplicity of infection was five for the U251 cells and ten for
the GSCs. U251 cells were transfected with the lentivirus for 10 h
in a six-well plate containing DMEM/F12 with 10% FBS. After 10 h,
the medium was replaced and the cells were continually cultured for
three days prior to confocal microscopy. CD133+ stem
cells were transfected with the lentivirus for 20 h in a six-well
plate containing the NSC medium. After 20 h, the medium was
replaced and the cells were cultured for three days in the NSC
medium prior to confocal microscopy. The whole transfection process
was performed in a biosafety cabinet. The cells were cultivated
under conditions of 37°C, 5% CO2 and saturated humidity.
Cell morphology observations and cell
proliferation inhibitory rate assessment
Following drug intervention for 24, 48 and 72 h,
cell morphology was observed. The cell proliferation inhibitory
rate was determined using Cell Counting Kit-8 (CCK-8) solution,
according to the manufacturer's instructions. Cells were seeded
into a 96-well plate and 10 µl CCK-8 solution was added, after
which the plates were incubated for 4 h at 37°C. The absorbance of
each well was measured at 450 nm using an automated ELISA reader
(Bio-Tek Instruments, Inc., Winookski, VT, USA). Experiments were
repeated three times, and the average value was calculated as the
inhibition rate. The proliferation inhibitory rate was calculated
using the optical density (OD) values as follows: [(Negative
control group OD value − experiment Group OD value)/negative
control group OD value] × 100%.
Quantitative polymerase chain reaction
(PCR)
Quantitative PCR was conducted, as previously
described (10,11). Cell samples (106) were
collected and 1 ml TRIzol reagent was added (Gibco Life
Technologies) to obtain the total RNA of the U251 cells and GSCs,
according to the manufacturer's instructions. The RNA solution was
stored at −80°C until required for further use. All reactions were
performed in duplicate, with a negative control that contained no
template. The mean value of the threshold cycle (start of
exponential amplification) of each sample was normalized against
the threshold cycle value of glyceraldehyde-3-phosphate
dehydrogenase to obtain the ΔCt value. Quantitative PCR was
performed in an ABI-7700 Sequence Detector (Applied Biosystems,
Foster City, CA, USA). The initial reverse transcription step was
performed using MMLV Reverse Transcriptase. The reverse
transcription reaction system included 5.5 µl H2O, 1.0 µl Oligo
(dT)18 (50 µg/ml) and 6.0 µl total RNA, which was incubated at 70°C
for 5 min and then kept on ice to unfold the secondary structure of
the mRNA. Next, 0.5 µl RNasin (40 U/µl), 4.0 µl 5X buffer, 2.0 µl
dNTP (10 mM) and 1.0 µl RTase (200 U/µl) was added and the reaction
system was heated to 42°C for 60 min and 95°C for 5 min, followed
by cooling to 4°C. Quantitative PCR was performed using SYBR Green
I fluorochrome. A standard curve was obtained from which the cycle
threshold (Ct) value was calculated. Each 50-µl PCR system
contained 1/50 of the original cDNA, 7 µl MgCl2 (25 mM),
0.8 µl each primer (20 pmol/µl), 1 µl dNTP (10 mM), 1 µl SYBR Green
I, 0.5 µl Taq DNA polymerase (5 U/µl; Promega Corporation, Madison,
WI, USA) and 5 µl 10X buffer. Following an initial denaturation at
94°C for 3 min, 50 cycles of amplification were performed with a
reaction cycle of 94°C for 30 sec, 57°C for 30 sec and 72°C for 30
sec. The fluorescence signal was detected at the end of each cycle.
Melting curve analysis was used to confirm the specificity of the
products. The 2−Δ∆Ct method was used to calculate the
relative expression levels (12).
The primers used were as follows: Human-Livin forward, 5′-ACA GAG
GAG GAA GAG GAG GAG G-3 and reverse, 5′-GCA GTC AGC GGC CAG TCA
TAG-3; human-MRP1 forward, 5′-CAC CAC TGG AGC ATT GAC TACC-3 and
reverse, 5′-GTA ATT ACA GCA AGC CTG GAA CC-3′; and human-MRP3
forward, 5′-CCT GTA TGT GGG TCA AAG TGCG-3′ and reverse, 5′-CCC AGC
CTC AGG GAA GTG TTG-3.
Statistical analysis
Experiments were performed in triplicate and the
data are presented as the mean ± standard deviation. Comparisons
between data were performed with the Student's t-test, where
P<0.05 was considered to indicate a statistically significant
difference. Statistical analysis was performed using SPSS 17.0
software (SPSS, Inc., Chicago, IL, USA).
Results
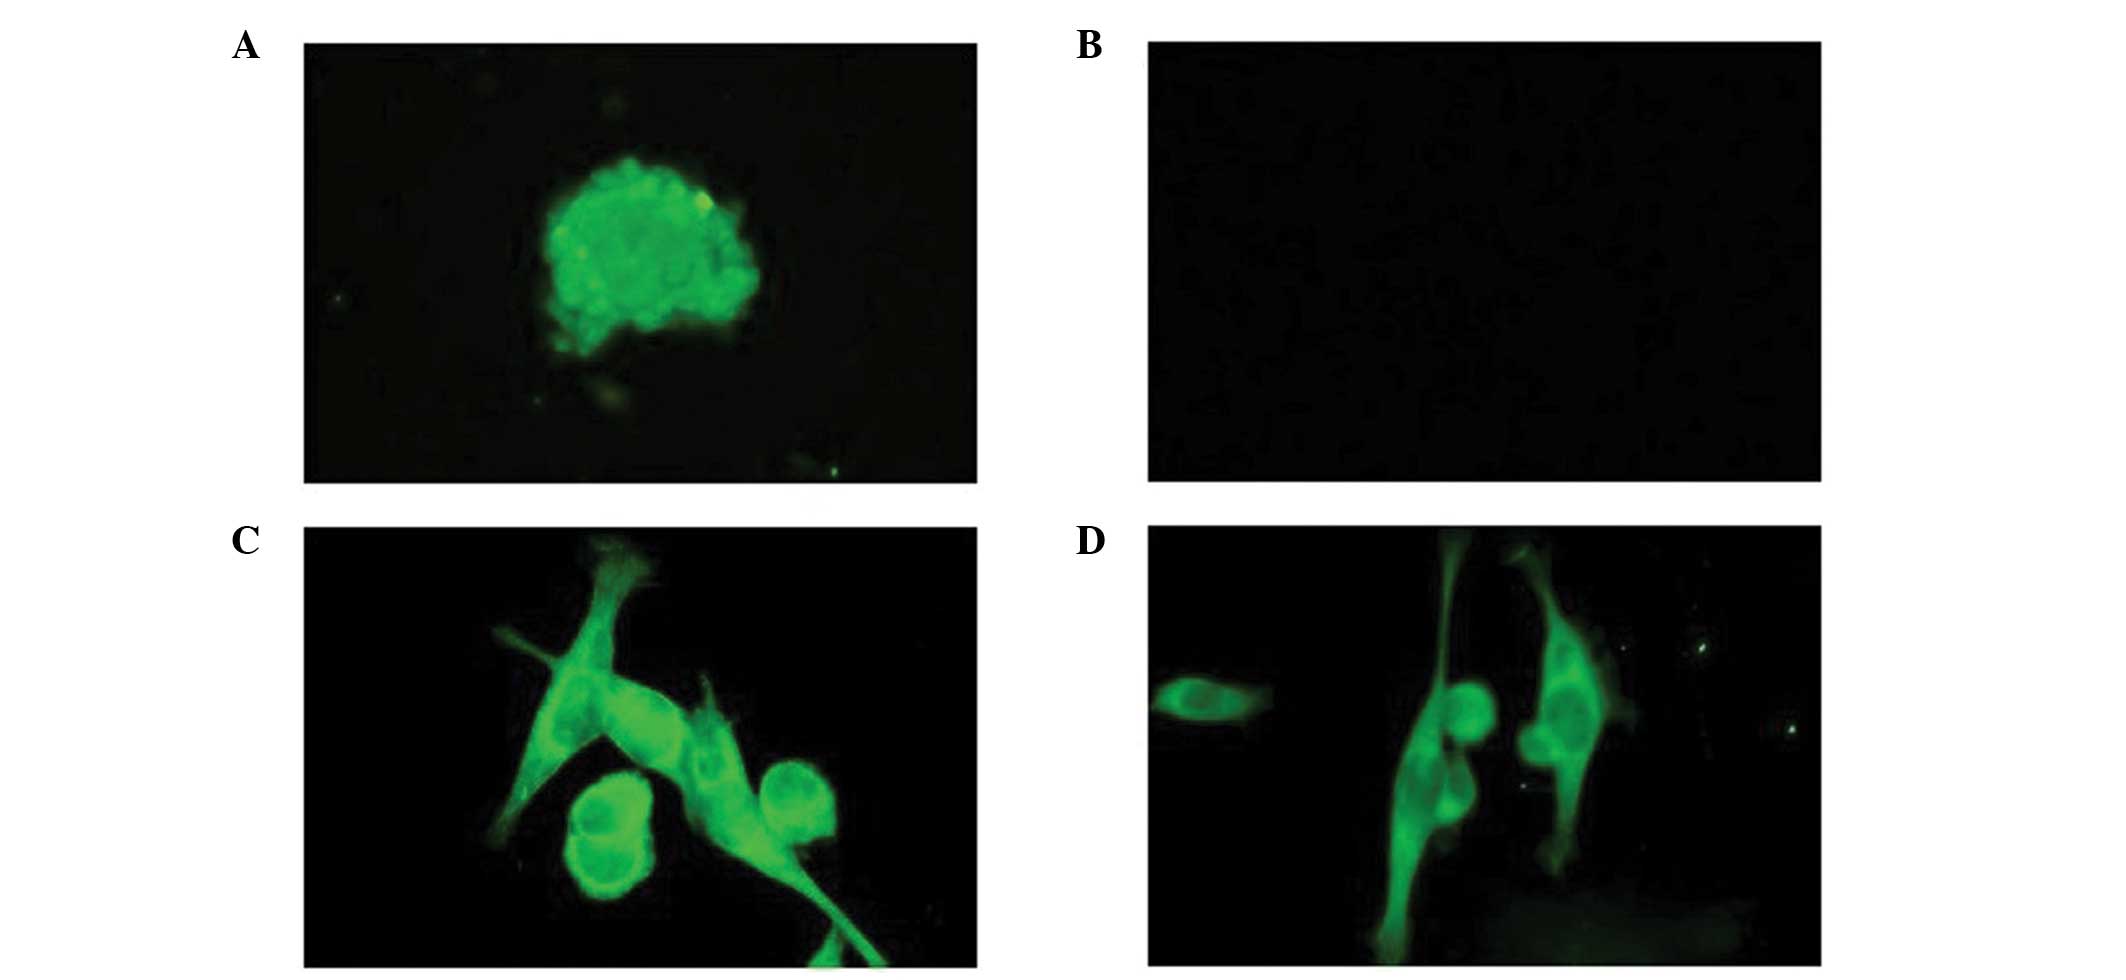
Isolation and differentiation of
CD133+ stem cells
Following isolation using a magnetic-activated cell
sorting technique, a small number of CD133+ stem cells
were identified in the U251 cells. The stem cells started to
differentiate following culture in DMEM/F12 containing 10% FBS.
After culture for 4 h, the neurospheres adhered to the wall and
axon-like or dendrite-like pseudopodia appeared. After four days of
culture, the entire surface of the spheres emerged with
pseudopodia. The stem cells cultured in the NSC medium did not
exhibit similar changes. The stem cells that were cultured in NSC
medium exhibited a sphere-like shape, self-renewal and the ability
to differentiate. Nestin immunofluorescence staining of the stem
cells was positive, whereas the U251 cells did not exhibit this
feature. After the stem cells had been cultured for seven days in
DMEM/F12, positive staining for β-tubulin and GFAP were observed,
whereas the neurospheres did not exhibit this feature (Fig. 1).
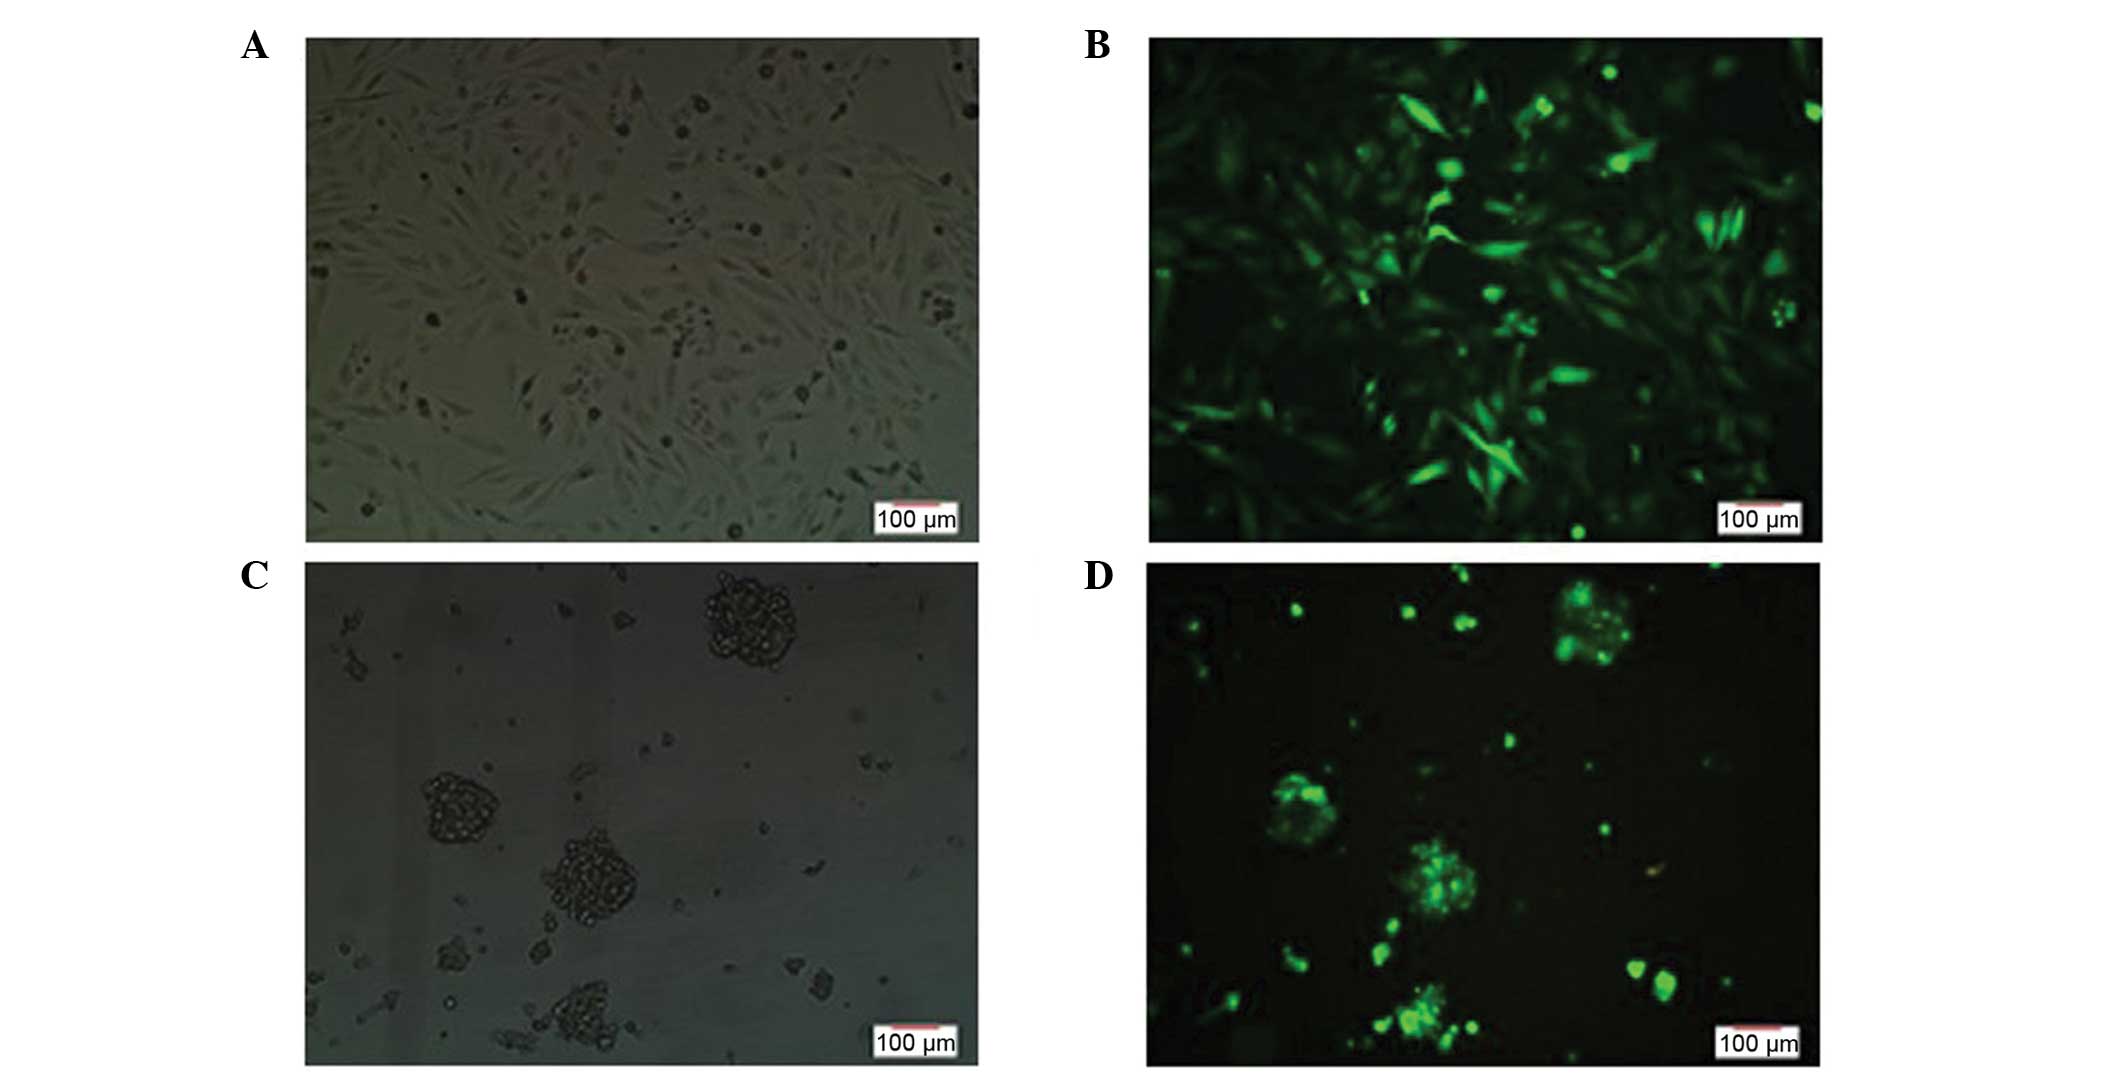
Lentiviral transfection
Following transfection with the lentivirus for 72 h,
the U251 cells and stem cells presented with green fluorescence
under a confocal microscope (Fig.
2).
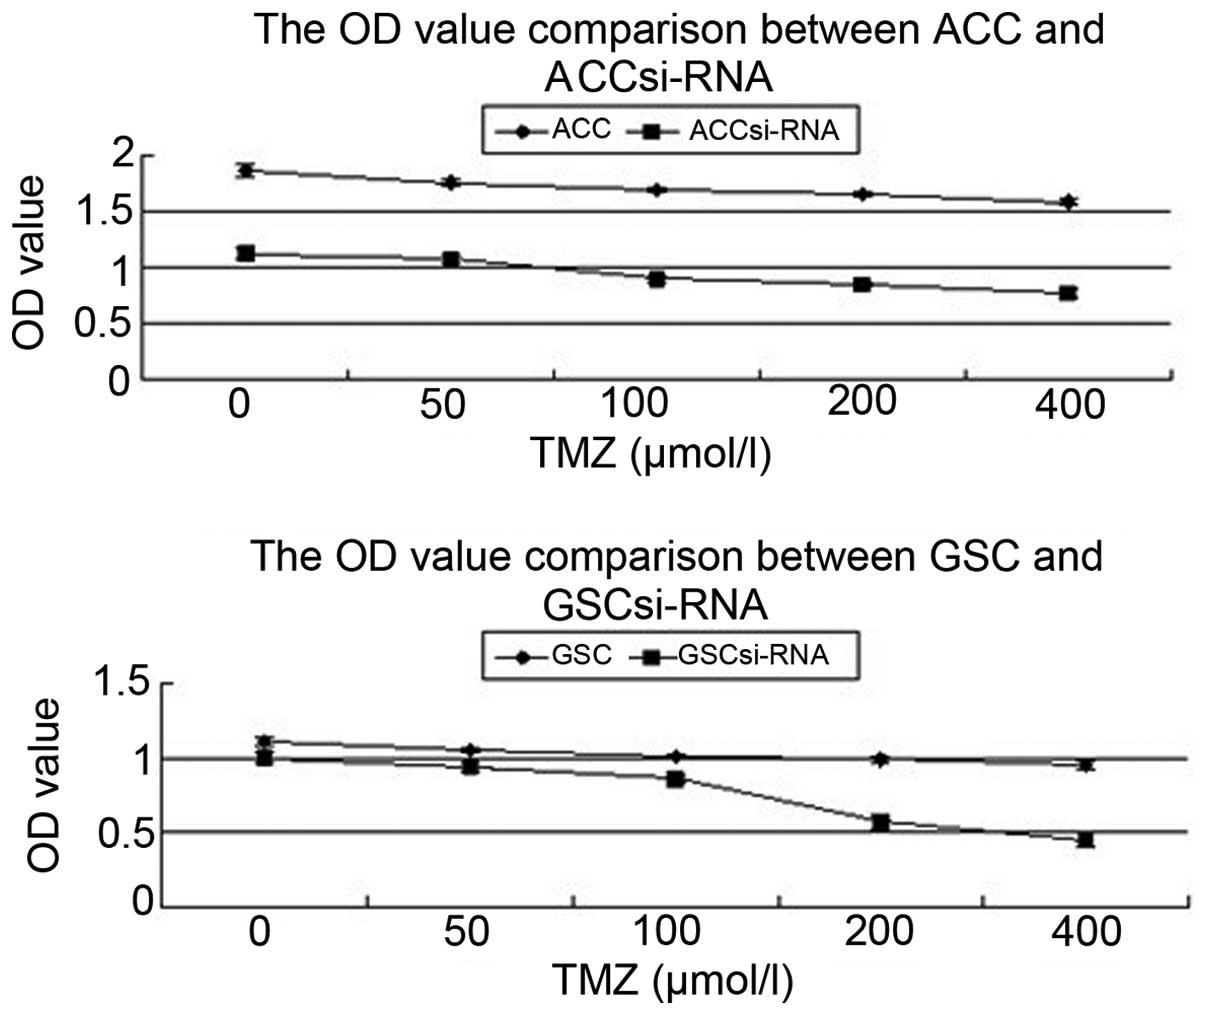
Proliferation analysis of U251 cells
and stem cells using CCK-8
Following intervention with TMZ for 24 h, the
appreciation speed of the four types of cell was significantly
inhibited. When compared with the autologous cancer cells (ACCs),
the ACCs transfected with siRNA presented a lower proliferation
rate (P<0.05). In addition, the GSCs transfected with siRNA
presented a lower proliferation rate when compared with the GSCs
(P<0.05; Fig. 3).
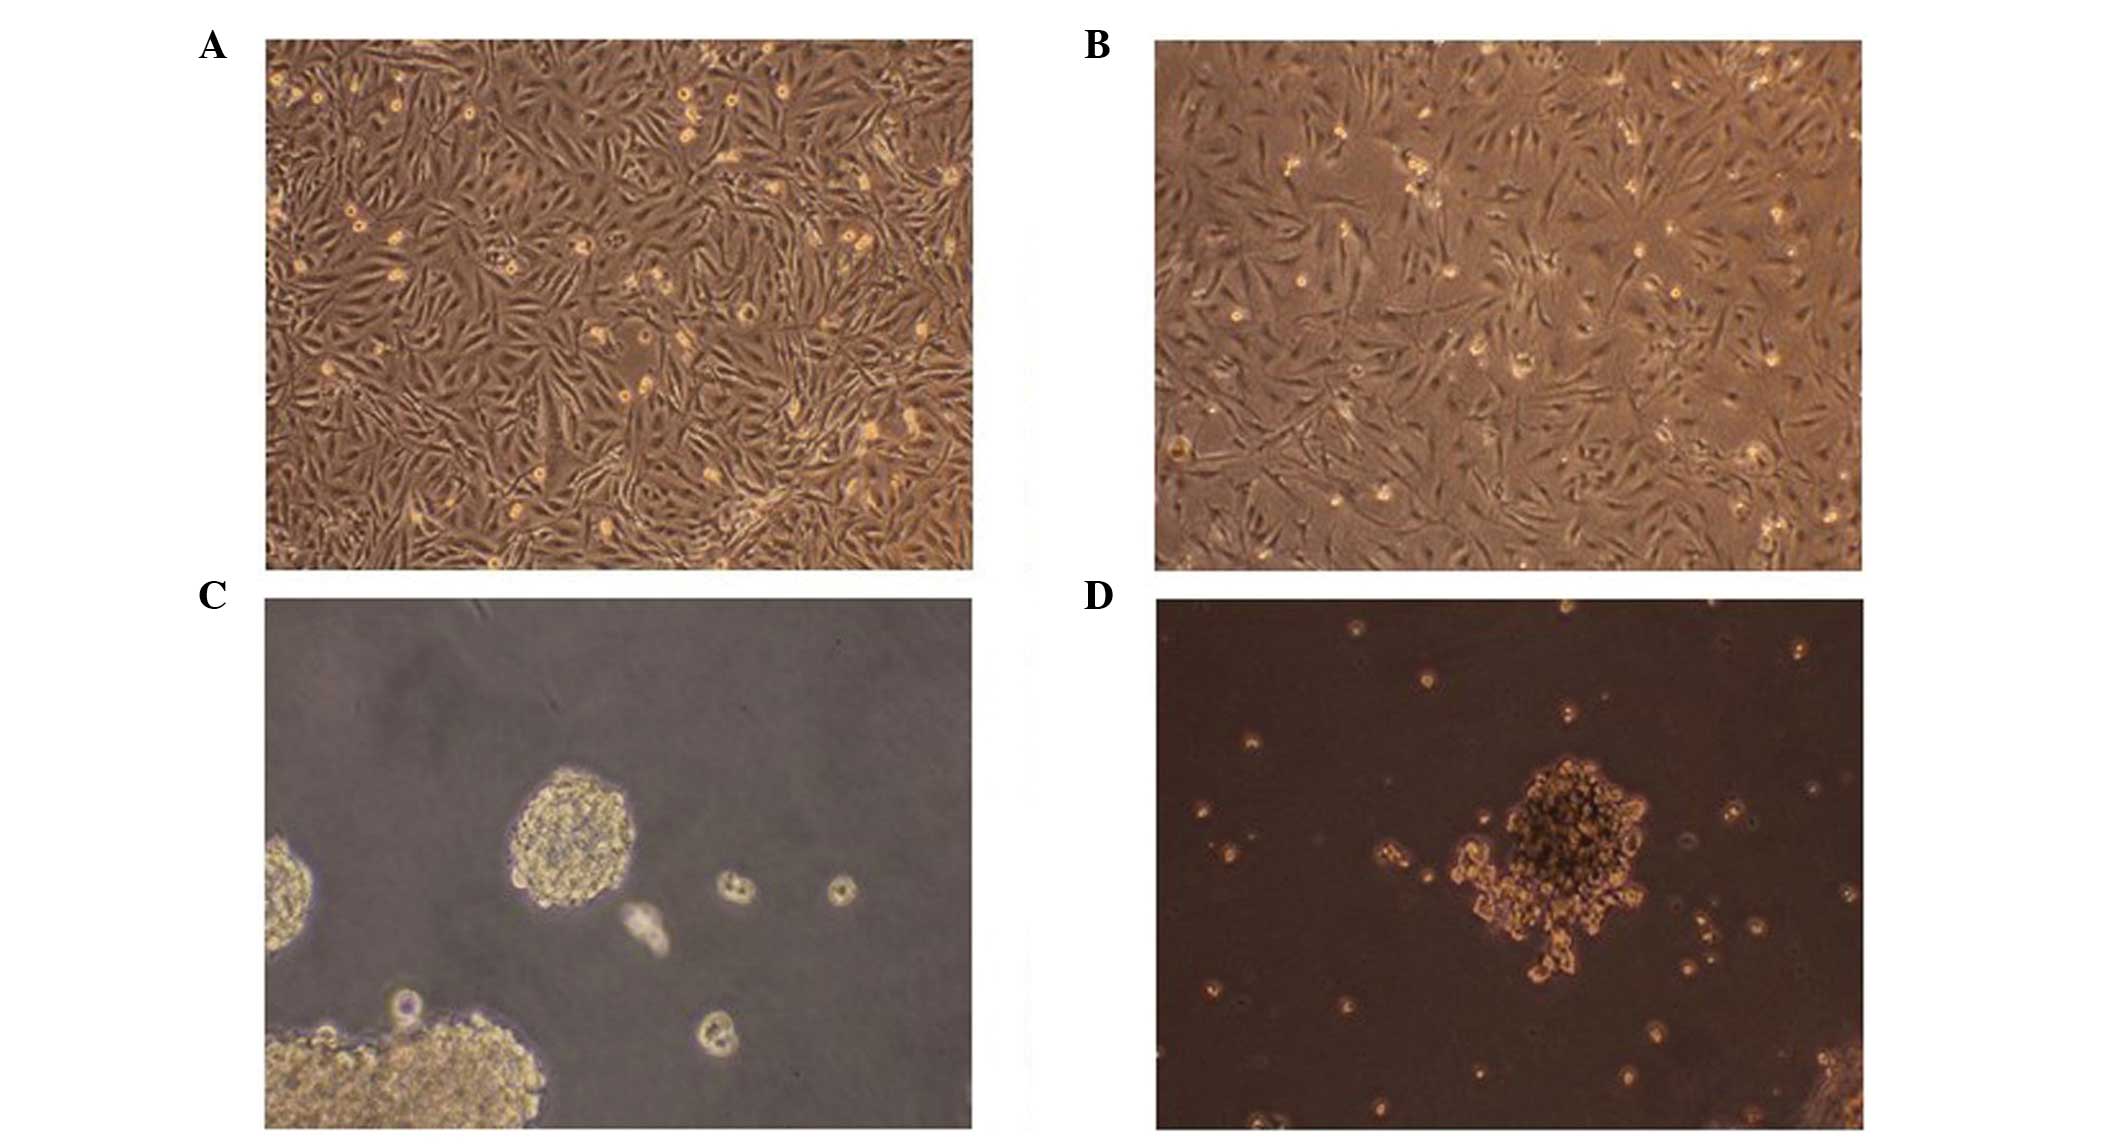
Morphological observations of the U251
cells and stem cells following TMZ intervention
Following intervention with TMZ, a decreased number
of U251 cells were observed with cell fragmentation. The structures
of the cell spheres were destroyed and a lot of cell debris was
present, with the proliferation evidently inhibited. These changes
were shown to be more significant with increasing drug
concentrations and intervention times (Fig. 4).
Expression of Livin prior to and
following transfection in U251 cells and stem cells
Prior to transfection, the expression of Livin in
the U251 cells was 2.53±0.14×10⁻⁵, while following
infection, the expression level was 4.74±0.47×10⁻⁷
(P<0.01). In the U251 stem cells prior to infection, the
expression of Livin was 56.37±3.48×10⁻⁵, while following
infection the expression level was 8.78±0.76×10⁻⁷
(P<0.01).
Expression of MRP1 and MRP3 prior to
and following intervention with various concentrations of TMZ for
24 h
ACCs transfected with siRNA were shown to have
higher mRNA expression levels of MRP1 when compared with the
control ACCs (P<0.05). Under the same TMZ intervention time, the
mRNA expression levels of MRP1 in the ACCs increased significantly
with increasing concentrations of TMZ (P<0.05), while the
expression levels decreased significantly in the ACCs transfected
with siRNA (P<0.05). Following intervention with the same
concentration of TMZ, the ACCs transfected with siRNA exhibited
lower mRNA expression levels of MRP1 compared with those in the
ACCs (P<0.05). The GSCs transfected with siRNA presented higher
mRNA expression levels of MRP1 and MRP3 when compared with those in
observed in the GSCs (P<0.05). In addition, the mRNA expression
levels of MRP1 and MRP3 in the GSCs were shown to increase with
increasing concentrations of TMZ (P<0.05). The expression of
MRP3 in the GSCs transfected with siRNA increased with increasing
concentrations of TMZ (P<0.05). However, the expression of MRP1
in the GSCs transfected with siRNA decreased significantly with
increasing concentrations of TMZ (P<0.05). Following
intervention with the same concentration of TMZ, the GSCs
transfected with siRNA presented lower mRNA expression levels of
MRP1 (P<0.05) and higher mRNA expression levels of MRP3 when
compared with the control GSCs (P<0.05). Furthermore, following
intervention with TMZ, the ACCs and GSCs transfected with siRNA
presented a decreasing trend in MRP1 mRNA expression levels with
increasing concentrations of TMZ. However, the GSCs transfected
with siRNA presented an increasing trend in MRP3 mRNA expression
levels with increasing concentrations of TMZ (Table I).
 | Table I.mRNA expression levels of MRP1 and
MRP3 prior to and following TMZ intervention for 24 h. |
Table I.
mRNA expression levels of MRP1 and
MRP3 prior to and following TMZ intervention for 24 h.
| Cell type | No intervention | 50 µmol/l | 100 µmol/l | 200 µmol/l | 400 µmol/l |
|---|
| MRP1
(x10−4) |
|
|
|
|
|
| ACC |
4.570±0.410 |
6.161±0.693c |
6.688±0.809c |
7.232±0.820d |
7.848±1.006d |
| ACC
siRNA |
6.315±0.522a |
4.678±0.240d,a |
4.354±0.438d,a |
4.094±0.187d,b |
2.703±0.182d,b |
| GSC |
5.527±0.528 |
7.287±0.902c |
8.058±0.765d |
8.818±0.977d |
13.108±1.478d |
| GSC
siRNA |
9.074±0.746b |
6.861±0.640c |
4.351±0.472d,b |
3.610±0.269d,b |
3.399±0.297d,b |
| MRP3
(x10−4) |
|
|
|
|
|
| ACC |
25.419±4.272 |
31.101±3.002 |
27.615±3.946 |
17.894±1.963c |
14.365±1.789c |
| ACC
siRNA |
23.384±2.879 |
25.819±2.834 |
22.650±1.424 |
19.781±1.840 |
17.631±1.798c |
|
GSC |
7.614±0.748 |
9.605±0.722c |
10.798±1.350c |
12.616±1.084d |
17.464±1.658d |
| GSC
siRNA |
19.537±0.923b |
15.704±1.322c,b |
21.469±1.949b |
24.638±1.056d,b |
28.448±2.504d,b |
Expression of MRP1 and MRP3 following
intervention with 400 µmol/l TMZ for 24, 48 and 72 h
The mRNA expression levels of MRP1 and MRP3 in the
ACCs and GSCs presented increasing trends with increasing
intervention times. Following intervention for the same time
period, the mRNA expression levels of MRP1 in the ACCs transfected
with siRNA were lower compared with those in the control ACCs
(P<0.05). In addition, the mRNA expression levels of MRP1 in the
GSCs transfected with siRNA were lower compared with those in the
ACCs (P<0.05), while the mRNA expression levels of MRP3 in the
GSCs transfected with siRNA were higher compared with those in the
GSCs (P<0.05; Table II).
| Table II.mRNA expression levels of MRP1 and
MRP3 prior to and following 400 µmol/l TMZ intervention. |
Table II.
mRNA expression levels of MRP1 and
MRP3 prior to and following 400 µmol/l TMZ intervention.
| Cell type | No
intervention | 24 h | 48 h | 72 h |
|---|
| MRP1
(x10−4) |
|
|
|
|
|
ACC |
4.570±0.410 |
7.848±1.006d |
13.033±1.560d |
19.323±3.056d |
| ACC
siRNA |
6.315±0.522a |
2.703±0.182d,b |
4.275±0.622c,b |
3.849±0.411d,b |
|
GSC |
5.527±0.528 |
13.108±1.478d |
12.613±1.182d |
27.372±2.062d |
| GSC
siRNA |
9.074±0.746b |
3.399±0.297d,b |
3.855±0.658d,b |
5.791±0.585d,b |
| MRP3
(x10−4) |
|
|
|
|
|
ACC |
25.419±4.272 |
14.365±1.789c |
29.846±5.499 |
32.852±5.154 |
| ACC
siRNA |
23.384±2.879 |
17.631±1.798c |
23.676±3.848 |
32.646±3.815c |
|
GSC |
7.614±0.748 |
17.464±1.658d |
18.196±1.961d |
27.197±1.963d |
| GSC
siRNA |
19.537±0.923b |
28.448±2.504d,b |
33.092±3.872d,b |
45.918±4.146d,b |
Discussion
Glioblastoma is one of the most severe types of
brain tumor. To date, a successful curative treatment has not been
established using various therapies, including surgery,
radiotherapy and chemotherapy. Although surgery has achieved great
progress in recent years, including the use of intraoperative
nuclear magnetic resonance, a curative outcome is yet to be
achieved. Chemotherapy is widely used as an adjuvant treatment of
gliomas following surgery, and TMZ is a commonly used
chemotherapeutic for the treatment of primary and recurrent
high-grade gliomas. The cytotoxic effect is the main antitumor
mechanism underlying TMZ (13,14).
Targeting DNA methylation, TMZ induces the rupture of
double-stranded DNA, which subsequently interferes with DNA
synthesis, induces autophagy and the apoptosis of tumor cells
(15). TMZ has manifested a very
strong lethality on glioma cells. However, the therapeutic outcome
of TMZ is often unsatisfactory due to the antiapoptotic effect and
the occurrence of chemotherapeutic resistance in glioma cells,
particularly for GSCs. Overexpression of the antiapoptotic gene,
Livin, results in a strong antiapoptotic effect in glioma cells and
GSCs (16). There are a number of
factors that can cause chemotherapeutic resistance in glioma,
including MRP genes. The expression levels of MRP1 and MRP3 have
been shown to increase with increasing concentrations of
chemotherapeutic drugs in glioma cells and GSCs (16). Thus, targeted research of
antiapoptotic genes and MRP genes may provide a novel direction for
the treatment of glioblastoma.
Livin (also known as KIAP or ML-IAP) is a member of
apoptosis protein suppressor family. The protein plays a key role
in cell apoptosis, cell proliferation and the cell cycle. The
expression of Livin is significantly higher in U251 stem cells when
compared with U251 glioma cells (16). Overexpression of Livin can lead to
the chemotherapeutic resistance of malignant cells; thus,
inhibitors of Livin may be useful for the chemotherapy of
malignancies (17).
MRPs, one of the most important causes of poor
prognosis in cancer patients, belong to the ATP-associated
transporter family. The proteins have a molecular weight of 180–190
kDa and are associated with the transfer of hydrophobic compounds.
MRP1 and MRP3 are the two most important genes in the family. MRP1
has an unusually broad substrate specificity that can transport a
variety of neutral hydrophobic compounds and facilitate the
extrusion of numerous glutathione, glucuronate and sulfate
conjugates (18). However, the
transport mechanism of MRP1 is unknown. MRP1 is able to confer drug
resistance in vitro, and MRP1 has been hypothesized to play
an important role in the development of drug resistance in several
types of cancer (19). MRP3 is able
to transport organic compounds that are conjugated to glutathione,
sulfate or glucuronate, such as estradiol-17β-glucuronide,
bilirubin-glucuronides and etoposide-glucuronide, as well as bile
salts and methotrexate (20). To
date, there have been a limited number of studies investigating the
associations between MRPs and glioblastoma.
In a previous study, the difference in the mRNA
expression levels of MRP1 and MRP3 between glioma cells and GSCs
was confirmed. Compared with glioma cells, the expression of MRP1
is significantly increased, while MRP3 expression is significantly
decreased in GSCs (10). The
antiapoptotic gene, Livin, has been shown to be associated with
MRP1 and MRP3 (16). Thus, the
present study assessed Livin as a target to investigate the
association between Livin and MRP. Identifying an approach that can
reduce the chemotherapy resistance of glioma cells and GSCs may
become a novel therapeutic method for glioma cases. Thus, the
present study investigated the effect of siRNA-Livin on the
expression of MRP1 and MRP3.
In the present study, the effect of the
antiapoptotic gene, Livin, on the expression of MRP1 and MRP3 was
investigated following chemotherapy in glioma cells and GSCs. The
results demonstrated that following lentiviral transfection of
siRNA-Livin, the expression of Livin was significantly inhibited in
U251 cells and GSCs. Prior to siRNA-Livin transfection, the
expression levels of MRP1 increased in the U251 and stem cells with
increasing drug concentrations and intervention times. However,
following siRNA-Livin transfection, the expression of MRP1 was
shown to decrease in U251 cells and GSCs under the same drug
concentration and intervention time. By contrast, the expression of
MRP3 increased in the U251 stem cells under the same intervention
concentration and time.
In conclusion, siRNA-Livin was shown to decrease the
expression levels of MRP1 in U251 cells and U251 stem cells, while
increasing the expression levels of MRP3 in U251 stem cells.
Furthermore, siRNA-Livin decreased the proliferation of U251 cells
and GSCs. Livin may be associated with high expression levels of
MRP1; thus, siRNA-Livin may decrease the expression of MRP1 to
subsequently reduce the drug resistance to chemotherapy in
glioblastoma. However, the effect of siRNA-Livin on MRP3 expression
in CD133+ stem cells requires further study.
Acknowledgements
The study was supported by grants from the National
Natural Science Foundation of China (no. 81071779) and the
Promotive Research Fund for Young and Middle-aged Scientists of
Shandong Province (no. BS2010YY006). The study was performed in the
laboratory of General Surgery and the Central Laboratory of Union
Hospital at Tongji Medical College of Huazhong University of
Science and Technology (Wuhan, China). The authors thank the
members of staff from these laboratories.
Glossary
Abbreviations
Abbreviations:
|
MRP
|
multidrug resistance-associated
protein
|
|
GSC
|
glioma stem cell
|
|
TMZ
|
temozolomide
|
|
FBS
|
fetal bovine serum
|
|
EGF
|
epidermal growth factor
|
|
bFGF
|
basic fibroblast growth factor
|
|
LIF
|
leukemia inhibitory factor
|
|
DMEM/F12
|
Dulbecco's modified Eagle's
medium/nutrient mixture F-12 Ham's
|
|
CCK-8
|
Cell Counting Kit-8
|
|
ACC
|
autologous cancer cell
|
|
NSC
|
neural stem cell
|
|
PCR
|
polymerase chain reaction
|
References
|
1
|
Carapella CM, Telera S and Oppido PA:
Surgery of malignant gliomas: advances and perspectives. Curr Opin
Oncol. 23:624–629. 2011. View Article : Google Scholar : PubMed/NCBI
|
|
2
|
Linz U: Chemotherapy for glioblastoma: is
costly better? Cancer. 113:2617–2622. 2008. View Article : Google Scholar : PubMed/NCBI
|
|
3
|
Villano JL, Seery TE and Bressler LR:
Temozolomide in malignant gliomas: current use and future targets.
Cancer Chemother Pharmacol. 64:647–655. 2009. View Article : Google Scholar : PubMed/NCBI
|
|
4
|
Frosina G: DNA repair and resistance of
gliomas to chemotherapy and radiotherapy. Mol Cancer Res.
7:989–999. 2009. View Article : Google Scholar : PubMed/NCBI
|
|
5
|
Tchorz JS, Tome M, Cloëtta D, et al:
Constitutive Notch2 signaling in neural stem cells promotes
tumorigenic features and astroglial lineage entry. Cell Death Dis.
3:e3252012. View Article : Google Scholar : PubMed/NCBI
|
|
6
|
Lopes RB, Gangeswaran R, McNeish IA, Wang
Y and Lemoine NR: Expression of the IAP protein family is
dysregulated in pancreatic cancer cells and is important for
resistance to chemotherapy. Int J Cancer. 120:2344–2352. 2007.
View Article : Google Scholar : PubMed/NCBI
|
|
7
|
Yan B: Research progress on Livin protein:
an inhibitor of apoptosis. Mol Cell Biochem. 357:39–45. 2011.
View Article : Google Scholar : PubMed/NCBI
|
|
8
|
Jin F, Zhao HY, Guo SG, Jiang XB, Zhao JS
and Zhu XL: Expression of livin in human brain gliomas and its
biological significance. Zhonghua Shen Jing Wai Ke Ji Bing Yan Jiu
Za Zhi. 5:418–421. 2006.(In Chinese).
|
|
9
|
Jin F, Li HS, Zhao L, et al: Expression of
anti-apoptotic and multi-drug resistance-associated protein genes
in cancer stem cell isolated from TJ905 glioblastoma multiforme
cell line. Zhonghua Yi Xue Za Zhi. 88:2312–2316. 2008.(In Chinese).
PubMed/NCBI
|
|
10
|
Jin F, Zhao L, Zhao HY, Guo SG, et al:
Comparison between cells and cancer stem-like cells isolated from
glioblastoma and astrocytoma on expression of anti-apoptotic and
multidrug resistance-associated protein genes. Neuroscience.
154:541–550. 2008. View Article : Google Scholar : PubMed/NCBI
|
|
11
|
Jin F, Zhao L, Zhao HY, Guo SG, et al:
Paradoxical expression of anti-apoptotic and MRP genes on cancer
stem-like cell isolated from TJ905 glioblastoma multiforme cell
line. Cancer Invest. 26:338–343. 2008. View Article : Google Scholar : PubMed/NCBI
|
|
12
|
Livak KJ and Schmittgen TD: Analysis of
relative gene expression data using real-time quantitative PCR and
the 2(-Delta Delta C(T)) method. Methods. 25:402–408. 2001.
View Article : Google Scholar : PubMed/NCBI
|
|
13
|
Haskins WE, Zablotsky BL, Foret MR, et al:
Molecular characteristics in MRI-classified group 1 glioblastoma
multiforme. Front Oncol. 3:1822013. View Article : Google Scholar : PubMed/NCBI
|
|
14
|
Sasaki T, Saito R, Kumabe T, et al:
Transformation of adult cerebellar pilocytic astrocytoma to
glioblastoma. Brain Tumor Pathol. 31:108–112. 2014. View Article : Google Scholar : PubMed/NCBI
|
|
15
|
Omar AI and Mason WP: Temozolomide: The
evidence for its therapeutic efficacy in malignant astrocytomas.
Core Evid. 4:93–111. 2010.PubMed/NCBI
|
|
16
|
Jin F, Zhao L, Guo YJ, et al: Influence of
Etoposide on anti-apoptotic and multidrug resistance-associated
protein genes in CD133 positive U251 glioblastoma stem-like cells.
Brain Res. 1336:103–111. 2010. View Article : Google Scholar : PubMed/NCBI
|
|
17
|
Liu B, Han M, Wen JK and Wang L:
Livin/ML-IAP as a new target for cancer treatment. Cancer Lett.
250:168–176. 2007. View Article : Google Scholar : PubMed/NCBI
|
|
18
|
Bakos E and Homolya L: Portrait of
multifaceted transporter, the multidrug resistance-associated
protein 1 (MRP1/ABCC1). Pflugers Arch. 453:621–641. 2007.
View Article : Google Scholar : PubMed/NCBI
|
|
19
|
Pajic M, Norris MD, Cohn SL and Haber M:
The role of the multidrug resistance-associated protein 1 gene in
neuroblastoma biology and clinical outcome. Cancer Lett.
228:241–246. 2005. View Article : Google Scholar : PubMed/NCBI
|
|
20
|
Borst P, de Wolf C and van de Wetering K:
Multidrug resistance-associated proteins 3, 4 and 5. Pflugers Arch.
453:661–673. 2007. View Article : Google Scholar : PubMed/NCBI
|