Introduction
Hepatitis B is a prevalent disease in China and the
most common risk factor for liver cirrhosis and hepatocellular
carcinoma (HCC). It has been reported that 7.18% of the Chinese
population aged 1–59 years is seropositive for hepatitis B surface
antigen (1). In China, there are ~93
million hepatitis B virus (HBV) carriers, 20 million of whom are
patients with chronic hepatitis B (CHB) (2). Despite its high prevalence, the
pathogenesis of acute-on-chronic liver failure (ACLF) remains
unclear, particularly regarding the protein expression and
regulatory processes that are involved.
Proteomic analysis is a powerful technological tool
for investigations of human diseases, such as liver diseases
(3–7). Isobaric tags for relative and absolute
quantification (iTRAQ) is a quantitative method that has frequently
been used in proteomic studies and is considered to exhibit a
sensitivity that is equal to or greater than that of difference gel
electrophoresis, a technique used to monitor the differences in
proteomic profile between cells in different functional states
(8). The iTRAQ method has been
demonstrated to be effective and accurate in characterizing
numerous diseases (4,5,9).
In the present study, the iTRAQ method was used to
analyze the expression of various proteins in hepatic tissue
extracted from patients with HBV-induced ACLF and from normal
control subjects, and the iTRAQ results were verified using western
blot analysis. The aim of the study was to identify differences in
protein expression that were closely associated with the
pathogenesis of HBV-induced ACLF, in order to provide a basis for
understanding the mechanisms underlying the pathogenesis of
ACLF.
Materials and methods
Patients and specimens
All hepatic tissues were obtained from orthotopic
liver transplantations performed in the Department of Hepatobiliary
Surgery at the First Affiliated Hospital of Sun Yat-Sen University
(Guangzhou, China). A total of 5 samples of normal hepatic tissue
were extracted from whole-organ donor livers of adults that
succumbed to circulatory failure. In addition, 7 samples of
abnormal hepatic tissue were obtained from the resected livers of
patients with HBV-induced ACLF. The diagnoses of HBV-induced ACLF
were based on previously described criteria (10,11).
Exclusion criteria included the following: Liver cirrhosis,
diagnosed by B ultrasound and computed tomography; pregnancy;
antiviral or immunomodulatory therapy within 6 months; other
factors causing active liver diseases, such as hepatitis A, C, D
and E or autoimmune, drug-induced liver, alcoholic liver and
inherited metabolic liver diseases; concomitant human
immunodeficiency virus infection or congenital immune deficiency
diseases; confirmed diagnosis of liver cancer or other
malignancies; severe diabetes, autoimmune diseases or other major
organ dysfunction; and concomitant infection or other serious
complications.
Protein contents in 6 separate hepatic tissue
samples were analyzed using iTRAQ analysis (Table I); 3 tissue samples were from normal
hepatic tissue and 3 samples were from patients with HBV-induced
ACLF. The differences in protein expression in a further 6 hepatic
tissue samples were subsequently verified using western blot
analysis (Table I); 2 of these
samples were from normal hepatic tissues and 4 samples were from
patients with HBV-induced ACLF.
 | Table I.Clinical manifestations of 12 samples
for iTRAQ (1–6) and western blot (7–12)
analyses: 5 liver tissue samples from healthy humans and 7 from
HBV-induced ACLF patients. |
Table I.
Clinical manifestations of 12 samples
for iTRAQ (1–6) and western blot (7–12)
analyses: 5 liver tissue samples from healthy humans and 7 from
HBV-induced ACLF patients.
| Parameter | 1 | 2 | 3 | 4 | 5 | 6 | 7 | 8 | 9 | 10 | 11 | 12 |
|---|
| Subject type | Normal | Normal | Normal | Patient | Patient | Patient | Normal | Normal | Patient | Patient | Patient | Patient |
| Gender | Male | Male | Female | Male | Male | Female | Male | Female | Male | Female | Male | Male |
| Age (years) | 25 | 34 | 28 | 56 | 47 | 52 | 36 | 30 | 39 | 51 | 46 | 55 |
| HBsAg (+/-) | – | – | – | + | + | + | – | – | + | + | + | + |
| HBsAb (+/-) | + | – | + | – | – | – | + | + | – | – | – | – |
| HBeAg (+/-) | – | – | – | – | + | – | – | – | – | + | + | + |
| HBeAb (+/-) | – | – | – | + | – | + | – | – | + | – | – | – |
| HBcAb (+/-) | – | – | – | + | + | + | – | – | + | + | + | + |
| Anti-HAV (+/-) | – | – | – | – | – | – | – | – | – | – | – | – |
| Anti-HCV (+/-) | – | – | – | – | – | – | – | – | – | – | – | – |
| Anti-HDV (+/-) | – | – | – | – | – | – | – | – | – | – | – | – |
| Anti-HEV (+/-) | – | – | – | – | – | – | – | – | – | – | – | – |
| AST (14.5–40
U/l) | 33 | 24 | 22 | 87 | 55 | 67 | 21 | 15 | 26 | 78 | 101 | 58 |
| ALT (3–35 U/l) | 24 | 15 | 19 | 56 | 43 | 89 | 31 | 24 | 35 | 65 | 46 | 110 |
| TBIL (4–23.9
µmol/l) | 21.1 | 14.2 | 12.7 | 611.5 | 355.7 | 529.5 | 13.8 | 20.1 | 463.5 | 312.5 | 556.7 | 536.8 |
| PT (11–14.5
sec) | 11.3 | 11.7 | 12.0 | 32.5 | 27.8 | 29.2 | 12.3 | 11.1 | 25.5 | 35.2 | 36.1 | 32.3 |
| INR | 1.07 | 1.12 | 1.21 | 3.15 | 2.58 | 2.87 | 1.16 | 1.09 | 2.41 | 3.55 | 3.75 | 3.08 |
| HBV DNA
(IU/ml) | UD | UD | UD |
8.15×10⁵ |
5.23×10⁶ |
7.38×10⁴ | UD | UD |
6.52×10⁴ |
1.78×10⁶ |
3.55×10⁶ |
4.21×10⁵ |
| BUN (2.4–8.2
mmol/l) | 4.52 | 4.31 | 3.27 | 5.31 | 6.24 | 5.73 | 3.44 | 5.63 | 6.55 | 6.37 | 7.12 | 6.93 |
| CR (31.8–116.0
µmol/l) | 61.1 | 55.8 | 53.7 | 89.2 | 78.3 | 93.4 | 58.4 | 63.7 | 85.3 | 91.2 | 101.3 | 100.3 |
| MELD score | ND | ND | ND | 32.63 | 27.08 | 31.48 | ND | ND | 28.15 | 31.63 | 35.45 | 33.01 |
| WBC
(3.97–9.15×10⁹/l) | 5.22 | 4.73 | 5.87 | 7.12 | 7.55 | 8.23 | 4.63 | 5.82 | 7.05 | 3.87 | 4.05 | 3.83 |
| RBC
(4.09–5.74×10¹²/l) | 5.12 | 4.23 | 4.84 | 5.23 | 4.23 | 4.87 | 4.57 | 4.93 | 3.88 | 4.79 | 5.66 | 4.85 |
| HB (131–172
g/l) | 156 | 164 | 149 | 117 | 152 | 138 | 162 | 157 | 128 | 146 | 98 | 141 |
| PLT
(100–300×109/l) | 226 | 214 | 189 | 211 | 187 | 156 | 208 | 195 | 154 | 205 | 138 | 213 |
The study protocol conformed to the ethical
guidelines of the 1975 Declaration of Helsinki and was approved by
the appropriate institutional review committee of the Third
Affiliated Hospital of Sun Yat Sen University (Guangzhou, China).
Informed consent was obtained from all patients and healthy
subjects prior to the initiation of the study.
Sample preparation and protein
extraction
Frozen liver samples were stored at −80°C prior to
transfer to a liquid nitrogen pre-chilled mortar. Samples were
ground into powder using liquid nitrogen. The powder was placed in
a centrifuge tube and precipitated at −20°C for 2 h by adding 10%
trichloroacetic acid-ice acetone at a volume 10-times that of the
volume of the powder. Samples were centrifuged at 20,000 × g at 4°C
for 30 min, and the pellet was collected following the removal of
the supernatant. Cold acetone was then added to the pellet at
2–3-times the volume of the pellet, and the sample was precipitated
at −20°C for 30 min. The sample was subsequently centrifuged twice
at 20,000 × g at 4°C for 30 min, the pellet was air-dried and a
lysis buffer, containing 1 mM phenylmethylsulfonyl fluoride, 2 mM
EDTA and 10 mM dithiothreitol (DTT), was added. The sample was
sonicated via ultrasound for 5 min in an ice-bath and centrifuged
at 20,000 × g for 25 min. The resulting supernatant was the protein
solution, which was quantified using the Bradford method (9).
Tissue digestion and iTRAQ reagent
labeling
Equal 100-µg quantities of total protein from the
liver tissue of patients with ACLF and control subjects were pooled
separately for iTRAQ labeling, followed by sample alkylation. After
adding 10 mM DTT, prepared by combining 10 µl DTT (1 M) and 990 µl
NH4HCO3 (25 mM), the sample was incubated in
a 56°C water bath for 1 h, and then cooled to room temperature.
Following the drying of the sample, 20 µl iodoacetamide (IAM; 55
mM), prepared by combining 55 µl IAM (1 M) and 945 µl
NH4HCO3 (25 mM), was added immediately and
the sample was placed in a dark chamber for 45 min. The sample was
precipitated by adding 4-times the volume of acetone and incubating
for 2 h, followed by centrifugation at 20,000 × g for 30 min.
Following the removal of the supernatant to ensure minimum residual
acetone, the sample was allowed to dry to 70% weight. The protein
was dissolved by adding 50% tetraethylammonium bromide (TEAB) +
0.1% sodium dodecyl sulfate rapidly to the sample. The sample was
replenished with 50% TEAB (9-times the volume of the sample),
vortexed, mixed and then subjected to centrifugation at 1,000 × g
for 30 sec at room temperature. Following alkylation, the sample
was digested with trypsin protease (Trypsin Gold, Mass Spectrometry
Grade; Promega Corp., Madison, WI, USA). In the alkylated sample,
trypsin protease solution (1 µg/µl) was added at a ratio of 1:25
and mixed well. The digestion was incubated in a 37°C water bath
for 24 h, and the digested protease solution was then freeze-dried
for subsequent iTRAQ labeling. The dried powder was resolved using
50 µl 50% TEAB and mixed well, prior to the addition of 70 µl
isopropanol and further mixing. iTRAQ Labeling reagent (Applied
Biosystems, Life Technologies, Foster City, CA, USA) was then added
(group A reporter, 114; group B reporter, 116). Subsequent to
vortexing for 10 sec, the sample was centrifuged at 1,000 × g for
30 sec at room temperature and incubated at room temperature for 2
h. The labeling peptides were mixed well for strong cation exchange
(SCX) chromatography separation.
SCX chromatography
SCX chromatography separation was performed to
remove the excess iTRAQ reagent and interfering substances for the
mass analysis using an Agilent 1100 series high-performance liquid
chromatography (HPLC) system (Agilent Technologies, Santa Clara,
CA, USA). Labeled peptides were re-suspended in a Luna 5-µm SCX 100
Å HPLC column (250×4.60 mm; Phenomonex, Torrance, CA, USA) using
the Agilent HPLC system. Buffer A consisted of 10 mM
KH2PO4 and 25% acetonitrile (pH 3.0), and
buffer B consisted of 10 mM KH2PO4, 2 M KCl
and 25% acetonitrile (pH 3.0). The 60-min gradient comprised the
following: 0.01–30 min, mobile phase with 100% buffer A elution to
balance baseline and pressure; 30–31 min, mobile phase with 0–5%
buffer B and 100–95% buffer A elution; 31–46 min, mobile phase with
5–30% buffer B and 95–70% buffer A elution; 46–51 min, mobile phase
with 30–50% buffer B and 70-50% buffer A elution; 51–55 min, mobile
phase with 50% buffer B and 50% buffer A elution; 55–60 min, mobile
phase with 50-0% buffer B and 50–100% buffer A elution.
Nano LC quadrupole time-of-flight
(Q-TOF) tandem mass spectrometry (MS/MS)
Mass spectrometry detection was conducted using a
microTOF-Q II instrument (Bruker Corp., Billerica, MA, USA), with
electron spray ionization (ESI) as the ion source (cation scanning;
mode, auto MS2; scan range, m/z=50–3,000). A 10-µl sample was used
in the Q-TOF instrument. Following MS/MS scanning, the signal
diagram was acquired. The resulting diagrams were exported to
Mascot generic format (MGF) files by loading them into DataAnalysis
software, version 2.1 (Bruker Corp.). Other signals were processed
in a similar manner for corresponding retrieval, and the MGF
documents were merged for subsequent Mascot database (Matrix
Science, Ltd., London, UK) retrieval.
The resulting MS spectra were used to determine the
peptide identity and abundance of each peptide in the respective
spectrum. Relative abundance of a peptide was calculated by
comparing the intensity of the corresponding tag.
Database searching and criteria
MicroTOF-Q control software (Bruker Corp.) was used
for database searching. Following peak analysis and data processing
of MS/MS signals with DataAnalysis (Bruker Corp.), the exported MGF
documents were uploaded to the Mascot database for data retrieval.
The search criteria were as follows: Enzyme, trypsin; database,
NCBI nr_human; peptide charge, 1+, 2+ and
3+; instrument, ESI-QUAD-TOF; and data format, Mascot
generic. Peptide and protein identification information was thus
retrieved. Mascot software was used to perform calculations based
on the non-redundant protein database OWL peptide frequency
(http://www.bioinf.man.ac.uk/dbbrowser/OWL/index.php)
and a likelihood algorithm. The degree of confidence for protein
identification was set at 95%. Injection error was corrected
following automatic standardization by adjusting the software
settings. Relative quantification was expressed as the average. The
P-value of the degree of confidence was determined via software
calculation. Hierarchical clustering analysis of the protein
expression pattern was analyzed using Cluster 3.0 software. Protein
annotation and classification was performed using the Database for
Annotation, Visualization and Integrated Discovery functional
annotation (http://david.abcc.ncifcrf.gov), selecting gene
ontology biological processes, cellular components and molecular
functional annotation for protein classification, and selecting the
Kyoto Encyclopedia of Genes and Genomes pathway database for
pathway classification and enrichment analysis.
Function identification of protein
components
The functions of protein components were identified
using the UniProt (http://www.uniprot.org/) and National Center for
Biotechnology Information (http://www.ncbi.nlm.nih.gov/) databases.
Western blot analysis
Western blot analysis was performed in accordance
with the instructions described in the western blotting kits
(Thermo Fisher Scientific, Inc., Waltham, MA, USA). Briefly,
protein lysates were separated on a 12% polyacrylamide gel,
transferred to polyvinylidene difluoride membranes and subjected to
immunoblotting at 4°C overnight with the following antibodies:
Anti-keratin, type I cytoskeletal 19 (CK-19) and anti-α-1-acid
glycoprotein 1 (α1-AGP) (both 1:1,000; Sigma-Aldrich, St. Louis,
MO, USA), anti-carbonic anhydrase 1 (1:1,000; Abcam, Cambridge, UK)
and anti-serpin peptidase inhibitor and clade A (α-1
antiproteinase, antitrypsin) member 1 (SERPINA1; 1:500; Abnova
Corp., Taipei, Taiwan). After being washed, the membranes were
incubated with horseradish peroxidase-conjugated secondary
antibodies, and visualized using the enhanced chemiluminescence
system (GE Healthcare Life Sciences, Little Chalfont, UK).
Statistical analysis
Statistical analysis was performed using SPSS
software for Windows, version 13.0 (SPSS, Inc., Chicago, IL, USA).
The Kolmogorov-Smimov test was performed to determine the
distribution of the samples of each group. Data were expressed as
the median (inter-quartile range; IIQR). A non-parametric
(Kruskal-Wallis) test was applied to analyze differences between
HBV-induced ACLF and normal subjects. P<0.05 was considered to
indicate a statistically significant difference.
Results
Protein identification
Following the Mascot MS/MS Ion Search and prior to
redundancy removal, 239 proteins were identified. After redundancy
removal, 124 proteins were identified, with a ≥95% degree of
confidence, indicating that the results were credible. Protein
quantification revealed that there were 57 proteins with ≥1.5-fold
differential expression detected between the groups. Based on the
score of the identified protein obtained using Cluster 3.0
software, the report threshold was 1.3 and the false positive rate
of the corresponding protein was 5%. Protein quantification by
software was based on the relative content of the isotopic reporter
group.
Protein quantification
Protein quantification software based on the
relative content of the isotopic reporter group, and using m/z=114
as a reference, showed significantly different results between the
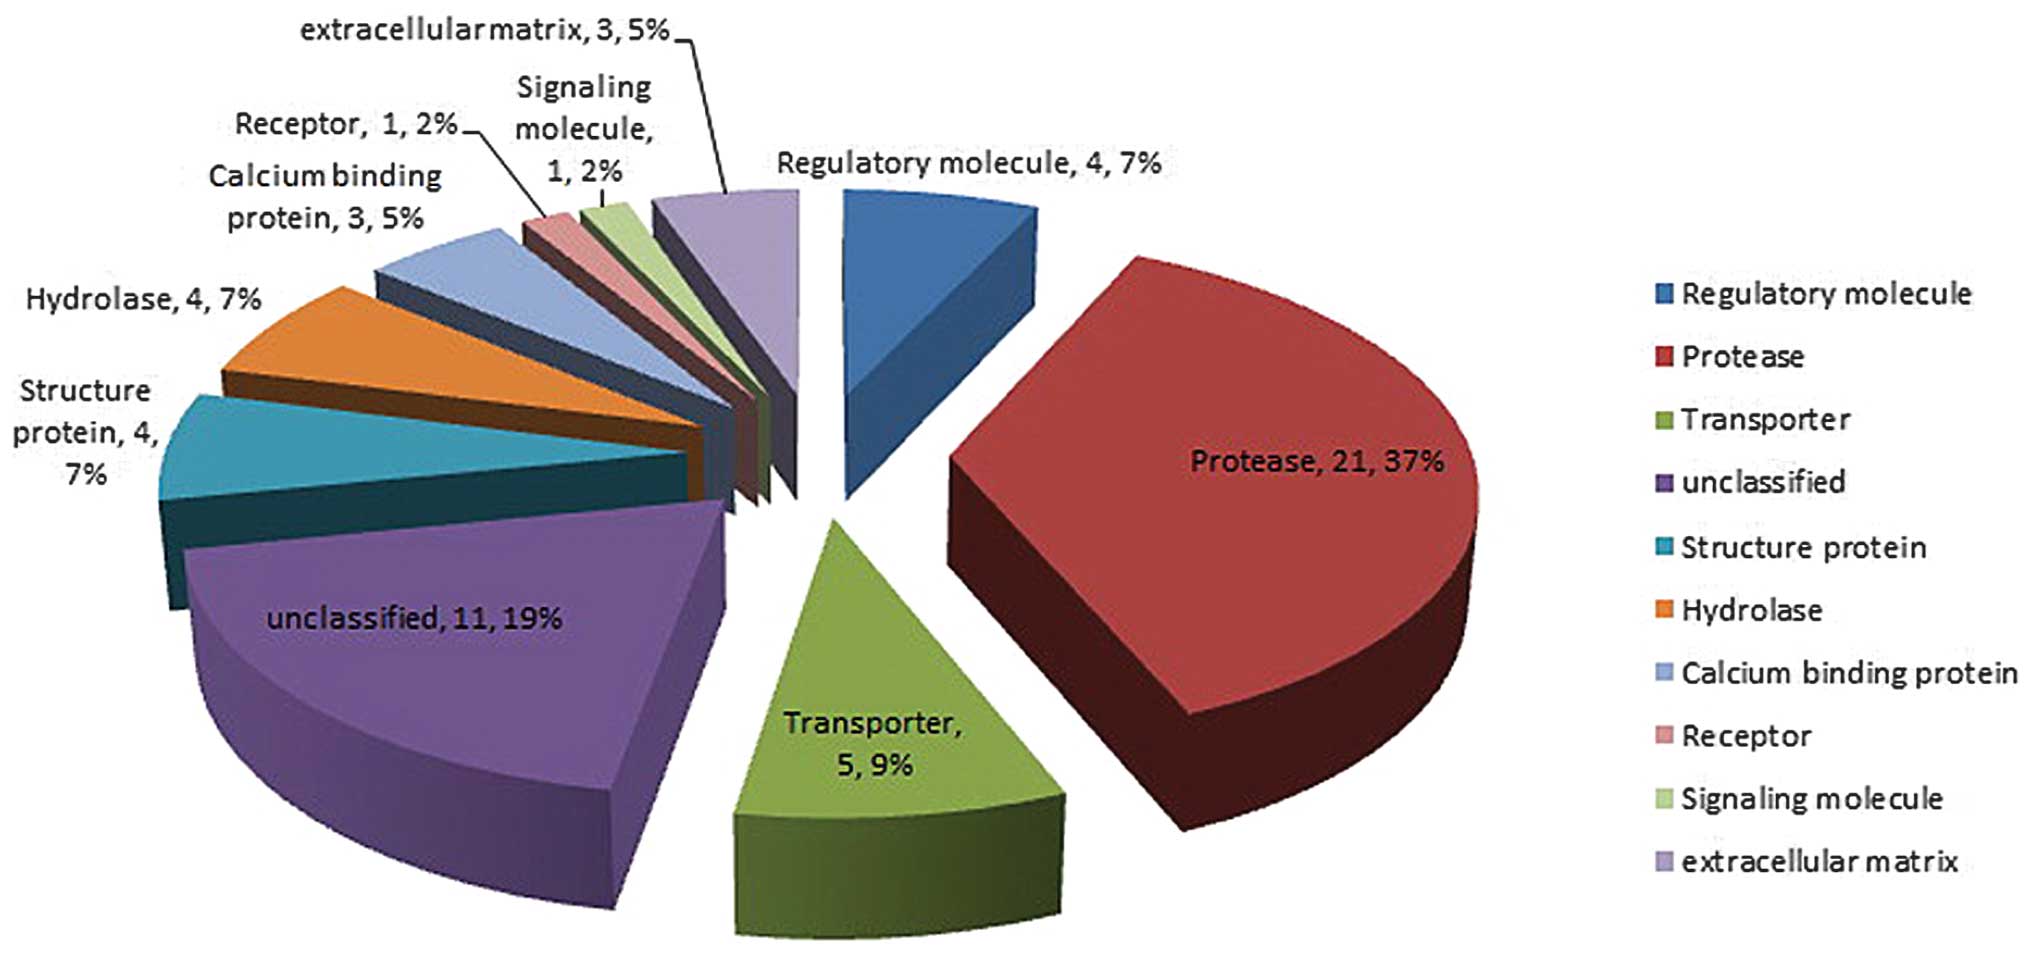
groups (P≤0.05). There were 57 proteins with a ≥1.5-fold difference
between the HBV-induced ACLF patients and the normal patients, as
analyzed by iTRAQ (Table II). Among
the 57 proteins, 10 categories of proteins were classified based on
their function: Regulatory molecule, protease, transporter,
structure protein, hydrolase, calcium binding protein, receptor,
signaling molecule, extracellular matrix and unclassified (Fig. 1).
| Table II.Results of the iTRAQ test. |
Table II.
Results of the iTRAQ test.
| No. | Identified protein
name | Accession
number | Molecular weight,
kDa | Biological
processes | Molecular
function | Protein
function | Protein expression
in ACLF patient liver tissue (fold change) |
|---|
| 1 | UDP
glucuronosyltransferase 2 family, polypeptide B7, isoform
CRA_b | Unclassified | 60 | Unclassified | Unclassified | Unclassified | Downregulation
(3.031) |
| 2 | Hydroxyacid oxidase
1 | Q9UJM8 | 41 | Fatty acid
α-oxidation | Oxidoreductase | Protease | Downregulation
(2.000) |
| 3 | Membrane-associated
progesterone receptor component 1 | O00264 | 22 | Unclassified | Receptor | Receptor | Downregulation
(2.000) |
| 4 | Enyol-CoA:
hydratase/3-hydroxyacyl-CoA dehydrogenase | Unclassified | 79 | Unclassified | Unclassified | Unclassified | Downregulation
(1.866) |
| 5 | Soluble epoxide
hydrolase | P07099 | 63 | Aromatic
hydrocarbon catabolism, detoxification | Hydrolase | Hydrolase | Downregulation
(1.866) |
| 6 |
Carboxylesterase | P23141 | 61 | Response to
toxin | Hydrolase, serine
esterase | Hydrolase | Downregulation
(1.741) |
| 7 | Catalase | P04040 | 60 | Hydrogen
peroxide | Mitogen,
oxidoreductase, Peroxidase | Protease | Downregulation
(1.625) |
| 8 | ACSL1 protein | P33121 | 60 | Fatty acid and
lipid metabolism | Ligase | Protease | Downregulation
(1.625) |
| 9 | 3-Ketoacyl-CoA
thiolase, peroxisomal isoform a | P09110 | 44 | Fatty acid and
lipid metabolism | Acyltransferase,
transferase | Protease | Downregulation
(1.625) |
| 10 | Epoxide hydrolase
1 | P07099 | 53 | Aromatic compound
catabolic process, response to toxin | Hydrolase | Hydrolase | Downregulation
(1.625) |
| 11 |
4-Hydroxyphenylpyruvate-dioxygenase | P32754 | 45 | Phenylalanine
catabolism, Tyrosine catabolism | Dioxygenase,
Oxidoreductase | Protease | Downregulation
(1.625) |
| 12 | Acyl-CoA
thioesterase 1 | Q86TX2 | 46 | Acyl-CoA metabolic
process | Hydrolase, serine
esterase | Hydrolase | Downregulation
(1.625) |
| 13 | Galactokinase
1 | B4E1G6 | 45 | Unclassified | Kinase,
transferase | Protease | Downregulation
(1.625) |
| 14 | Neuroendocrine
specific protein c homolog | Unclassified | 22 | Unclassified | Unclassified | Unclassified | Downregulation
(1.625) |
| 15 | Hepatic peroxysomal
alanine: glyoxylate aminotransferase | Q9BXA1 | 40 | Unclassified | Aminotransferase,
transferase | Protease | Downregulation
(1.516) |
| 16 |
Betaine-homocysteine
methyltransferase | Q93088 | 45 | Amino-acid betaine
catabolic process, cellular nitrogen compound metabolic
process | Methyltransferase,
transferase | Protease | Downregulation
(1.516) |
| 17 | Glutamate
dehydrogenase 1, mitochondrial precursor | P00367 | 61 | Glutamate
biosynthetic process | Oxidoreductase | Protease | Downregulation
(1.516) |
| 18 | D-dopachrome
decarboxylase | P30046 | 13 | Melanin
biosynthesis | Lyase, D-dopachrome
decarboxylase activity | Protease | Downregulation
(1.516) |
| 19 | Nicotinate
phosphoribosyltransferase domain containing 1, isoform CRA_c | C9J8U2 | 56 | NAD biosynthetic
process |
Glycosyltransferase, transferase | Protease | Downregulation
(1.516) |
| 20 | Adenylate kinase 2,
isoform CRA_c | P54819 | 18 |
Nucleobase-containing small molecule
interconversion | Kinase,
transferase | Protease | Downregulation
(1.516) |
| 21 | Argininosuccinate
synthetase, isoform CRA_b | P00966 | 51 | Acute-phase
response | ATP binding,
argininosuccinate synthase activity | Protease | Upregulation
(1.516) |
| 22 | Tropomyosin β chain
isoform 2 | P07951 | 33 | Muscle contraction,
regulation of ATPase activity | Muscle protein | Structure
protein | Upregulation
(1.516) |
| 23 | Annexin A2, isoform
CRA_c | P07355 | 32 | Positive regulation
of vesicle fusion | Calcium ion
binding | Calcium binding
protein | Upregulation
(1.516) |
| 24 | Transferrin | Q06AH7 | 77 | Cellular iron ion
homeostasis, iron ion transport | Ferric iron
binding | Transporter | Upregulation
(1.516) |
| 25 | Histone H2B type
1-D | P58876 | 14 | Nucleosome
assembly | DNA binding | Protease | Upregulation
(1.516) |
| 26 | Lumican
precursor | P51884 | 38 | Carbohydrate
metabolic process | Extracellular
matrix structural constituent | Structure
protein | Upregulation
(1.516) |
| 27 | YWHAZ protein | P63104 | 35 | Anti-apoptosis,
signal transduction | Protein domain
specific binding, transcription factor binding | Signaling
molecule | Upregulation
(1.516) |
| 28 | L-lactate
dehydrogenase A chain isoform 1 | P00338 | 37 | Glycolysis | Oxidoreductase | Protease | Upregulation
(1.625) |
| 29 | Phosphoglycerate
kinase 1 | P00558 | 45 | Glycolysis | ATP binding,
phosphoglycerate kinase activity | Protease | Upregulation
(1.625) |
| 30 | α-2-macroglobulin
precursor | P01023 | 163 | Blood coagulation,
intrinsic pathway | Serine-type
endopeptidase inhibitor activity | Protease | Upregulation
(1.625) |
| 31 |
Manganese-containing superoxide
dismutase | Unclassified | 24 | Unclassified | Unclassified | Unclassified | Upregulation
(1.625) |
| 32 | T-plastin
polypeptide | Unclassified | 64 | Unclassified | Unclassified | Unclassified | Upregulation
(1.625) |
| 33 | Peroxiredoxin 2,
isoform CRA_a | A6NIW5 | 15 | Unclassified | Antioxidant
activity, oxidoreductase activity | Protease | Upregulation
(1.625) |
| 34 | Filamin-A isoform
1 | P21333 | 280 | Actin crosslink
formation and actin cytoskeleton reorganization | Binding | Regulatory
molecule | Upregulation
(1.625) |
| 35 | Annexin A1, isoform
CRA_b | P04083 | 40 | Anti-apoptosis,
cell surface receptor linked signaling pathway | Phospholipase A2
inhibitor, calcium ion binding | Calcium binding
protein | Upregulation
(1.625) |
| 36 | Polyubiquitin | P0CG47 | 68 | DNA damage
response, signal transduction by p53 class mediator resulting in
cell cycle arrest | DNA repair | Regulatory
molecule | Upregulation
(1.741) |
| 37 | Apolipoprotein J
precursor | Unclassified | 49 | Unclassified | Unclassified | Unclassified | Upregulation
(1.741) |
| 38 | Hemopexin
precursor | Unclassified | 52 | Unclassified | Unclassified | Unclassified | Upregulation
(1.741) |
| 39 | Pyruvate kinase,
muscle, isoform CRA_b | P30613 | 38 | Glycolysis | ATP binding,
magnesium ion binding | Protease | Upregulation
(1.866) |
| 40 | Annexin A5, isoform
CRA_c | P08758 | 33 | Blood coagulation,
hemostasis | Calcium ion
binding | Calcium binding
protein | Upregulation
(2.000) |
| 41 | Keratin 1 [Homo
sapiens] | Q16195 | 66 | Unclassified | Structural molecule
activity | Structure
protein | Upregulation
(2.000) |
| 42 |
Glutamic-oxaloacetic transaminase 1,
soluble (aspartate aminotransferase 1), isoform CRA_a | Unclassified | 32 | Unclassified | Unclassified | Unclassified | Upregulation
(2.144) |
| 43 | Myosin, heavy
polypeptide 11, smooth muscle, isoform CRA_c | D2JYH7 | 226 | Unclassified | Motor protein | Transporter | Upregulation
(2.297) |
| 44 | Collagen α-1 (XIV)
chain precursor | Q05707 | 194 | Cell adhesion | Extracellular
matrix structural constituent | Extracellular
matrix | Upregulation
(2.297) |
| 45 | Nicotinamide
N-methyltransferase | P40261 | 30 | Organ
regeneration | Nicotinamide
N-methyltransferase activity | Protease | Upregulation
(2.297) |
| 46 | Osteoglycin | Q7Z532 | 34 | Unclassified | Protein
binding | Extracellular
matrix | Upregulation
(2.297) |
| 47 | Unnamed protein
product | Unclassified | 52 | Unclassified | Unclassified | Unclassified | Upregulation
(2.639) |
| 48 | Apolipoprotein A-I,
isoform CRA_b | P02647 | 23 | Cholesterol
metabolism, transport | Beta-amyloid
binding, cholesterol binding, cholesterol transporter activity | Transporter | Upregulation
(2.639) |
| 49 | Fibrinogen α chain
isoform α preproprotein | P02671 | 70 | Platelet
activation, protein polymerization, response to calcium ion, signal
transduction | Eukaryotic cell
surface binding, protein binding, bridging, receptor binding | Extracellular
matrix | Upregulation
(2.639) |
| 50 | Unnamed protein
product | Unclassified | 16 | Unclassified | Unclassified | Unclassified | Upregulation
(2.828) |
| 51 | JC-κ protein -
human | Unclassified | 15 | Unclassified | Unclassified | Unclassified | Upregulation
(3.031) |
| 52 | Albumin, isoform
CRA_h | P02768 | 69 | Transport | Binding
capacity | Transporter | Upregulation
(3.482) |
| 53 | Hemoglobin α 1
globin chain | Q9BX83 | 11 | Transport | Heme binding,
oxygen binding, oxygen transporter activity | Transporter | Upregulation
(4.595) |
| 54 | Keratin, type I
cytoskeletal 19 | P08727 | 44 | Host-virus
interaction | Structural
constituent of cytoskeleton and muscle | Structure
protein | Upregulation
(3.732) |
| 55 | α-1-acid
glycoprotein 1 | P02763 | 24 | Acute-phase
response, regulation of immune system process | Protein
binding | Regulatory
molecule | Upregulation
(4.595) |
| 56 | Carbonic anhydrase
1 | P00915 | 29 | One-carbon
metabolic process | Carbonate
dehydratase activity, zinc ion binding | Protease | Upregulation
(3.031) |
| 57 | Serpin peptidase
inhibitor, clade A (α-1 antiproteinase, antitrypsin), member 1 | P01009 | 47 | Unclassified | Serine-type
endopeptidase inhibitor activity | Regulatory
molecule | Upregulation
(2.297) |
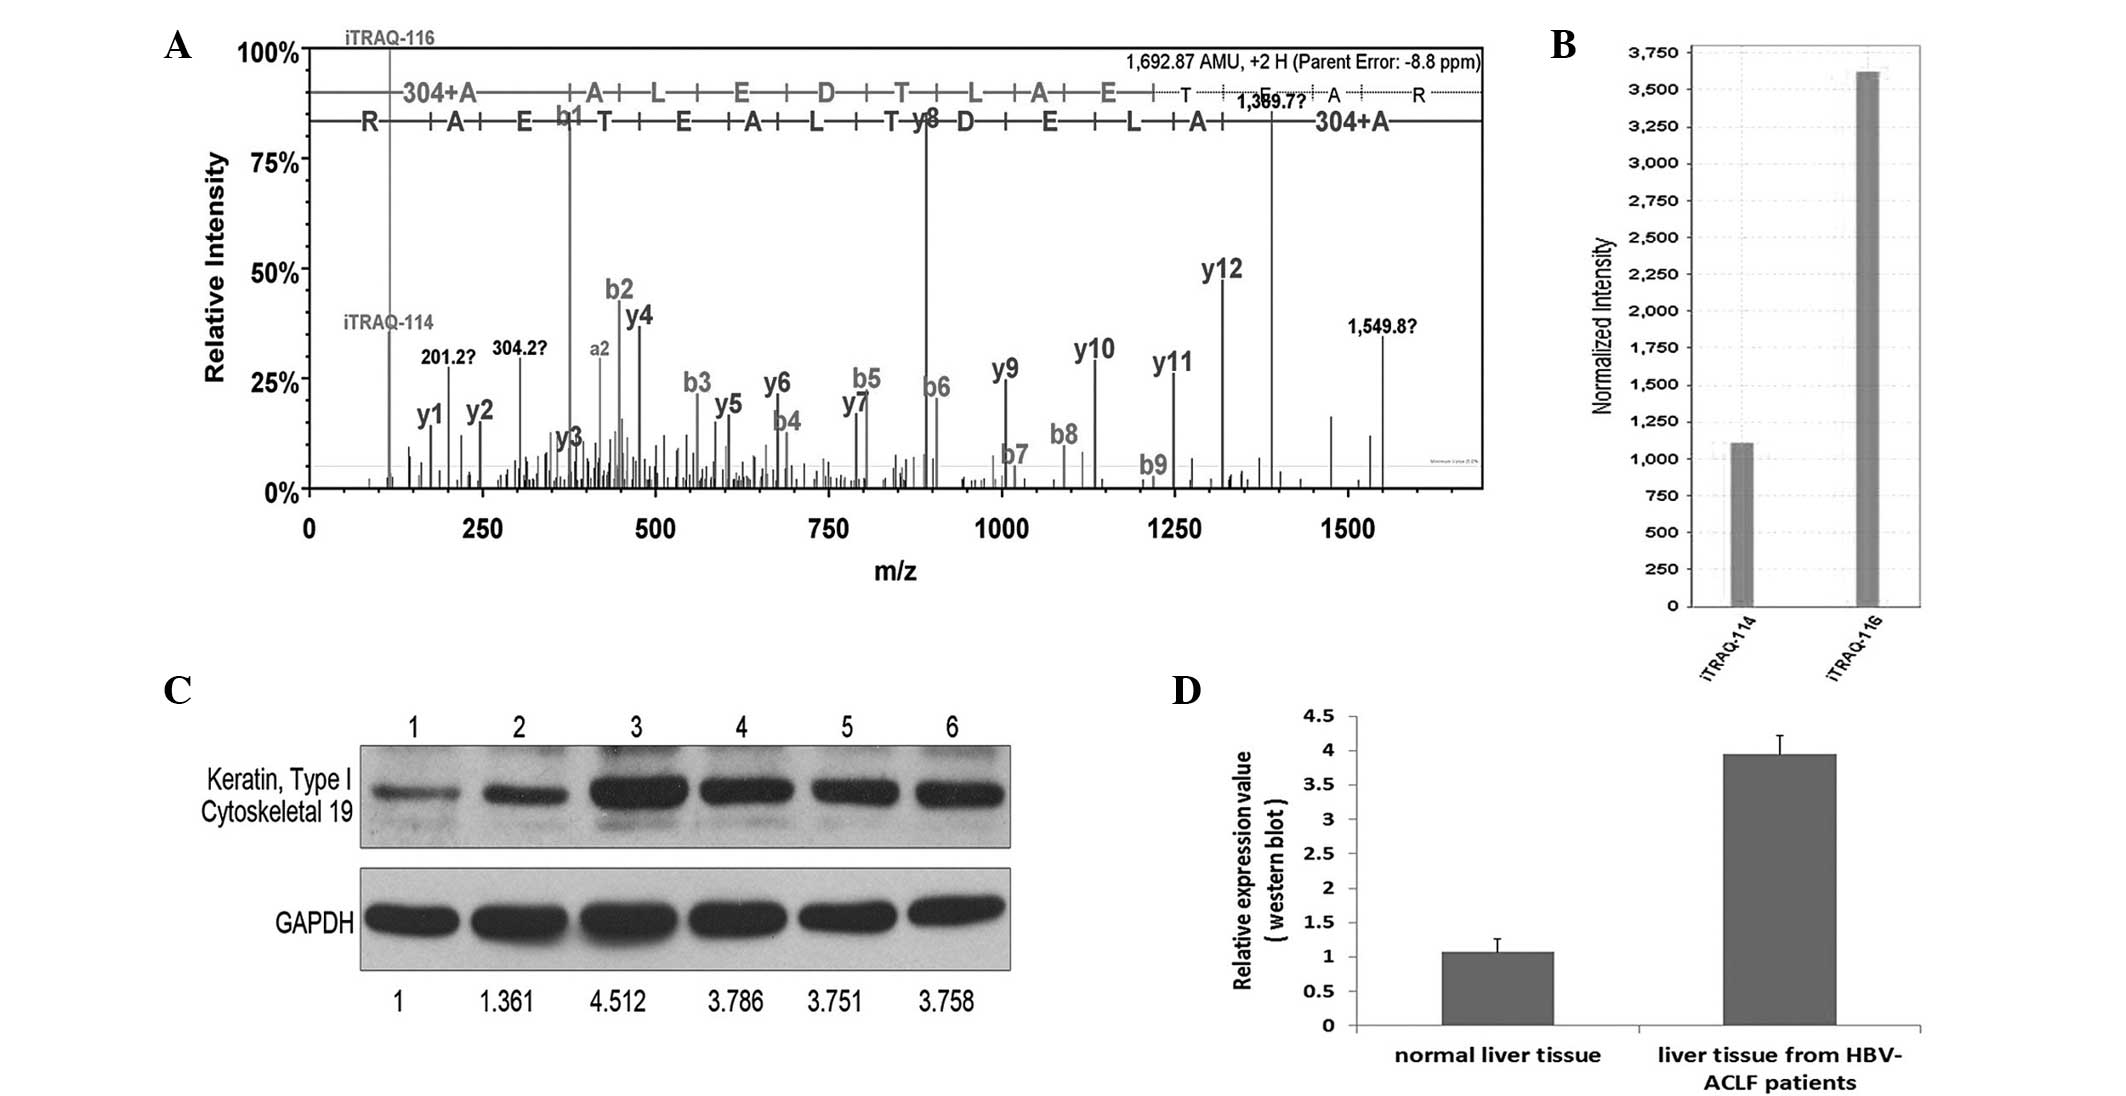
Following a preliminary selection of the 57
proteins, 4 proteins with the most marked differences in expression
and the most significant association with liver diseases (Table II) were selected to be verified by
western blot analysis. These proteins were CK-19, α1-AGP, carbonic
anhydrase 1 and SERPINA1. After the verification of 6 hepatic
tissue samples by western blot analysis, the results were nearly
identical to the results of the iTRAQ analyses (Figs. 2–5).
Discussion
In the field of CHB research, proteomics is not
widely performed due to the complexity of the pathogenesis of CHB.
In the present study, a western blot-verified iTRAQ approach was
used to quantify the differences in specific protein expression by
comparing liver tissue samples from healthy individuals and
HBV-induced ACLF patients. The results showed differences in
specific proteins between the two groups, which may elucidate the
deregulated pathways and networks involved in the proteomic
mechanism underlying this disease. The 4 proteins with the greatest
differences in expression between groups and the most significant
association with liver diseases were selected to be verified by
western blot analysis. These proteins included 1 structural
protein, 2 regulatory proteins and 1 protease (Table II). The aim was to determine if
these proteins were involved in the pathogenesis of HBV-induced
ACLF.
CK-19, a member of the keratin family, can be found
in a defined zone of basal keratinocytes, sweat glands, mammary
gland ductal and secretory cells, bile ducts, the gastrointestinal
tract, the bladder urothelium, oral epithelia, the esophagus and
the ectocervical epithelium. The expression levels of CK-19 can be
used as a luminal epithelial cell marker expressed in the majority
of breast carcinomas and not typically detected in lymph nodes
(12). Furthermore, CK-19 has been
reported to be a novel prognostic factor in non-small-cell lung
cancer (13); however, the exact
function of CK-19 in the pathogenesis of HBV-induced liver failure
remains unclear and requires verification by cell function studies
involving larger sample sizes.
α1-AGP is a major acute-phase protein that is
synthesized in the hepatocytes of humans, rats, mice and other
species. An increase in the serum concentration of α1-AGP may occur
as a response to systemic tissue injury, inflammation or infection
and is considered to be associated with an enhanced rate of hepatic
synthesis. The biological function of α1-AGP remains unknown,
although a variety of its immunomodulating effects and functions
have been described (14). In
addition, it has been reported that α1-AGP levels are increased in
gastric tissue and in the plasma of patients with carcinoma of the
stomach (15). Ren et al
(3) reported that α1-AGP may be a
potential biomarker for ACLF induced by CHB. Their results showed
that α1-AGP levels decreased significantly in the plasma of
patients with HBV-induced ACLF, but decreased to a lesser extent in
the plasma of patients with CHB. By contrast, the results of the
present study showed that α1-AGP expression was 4.595-fold greater
in the HBV-induced ACLF liver tissue than that in the liver tissue
of healthy subjects, giving rise to the theory that α1-AGP may have
collected in the liver from the blood in response to the process of
ACLF. Further cell experiments are required to validate the
function of α1-AGP in the reaction and to analyze the levels in the
blood and liver tissue of the same patient.
Carbonic anhydrase is among the most important
protein components of erythrocytes. The primary functions of
carbonic anhydrase are to modulate acid-base balance in the blood
and other tissues, assist in the removal of CO2 and
ensure a moderate substrate concentration for enzymes using
CO2 and HCO3 as substrates. Numerous members
of the carbonic anhydrase family exist. One member, carbonic
anhydrase isoenzyme 9, is abnormally expressed in gastrointestinal
and gynecological tumors. Carbonic anhydrase 9 has potential
clinical value, including as a biomarker of human colonic mucinous
carcinoma and increased proliferation in the colorectal mucosa
(16–18). Additionally, it has been demonstrated
that carbonic anhydrase 3 levels are significantly reduced in the
livers of superoxide dismutase-deficient mice, although
immunohistochemical analysis revealed that the reduction was not
homogenous throughout the lobular structure of the liver (19). The function of carbonic anhydrase 1
in HBV-induced ACLF, however, is not clear. The results of the
present study showed that its expression increased 3-fold in
patients with HBV-induced ACLF. The specific role and function of
carbonic anhydrase 1 requires further verification.
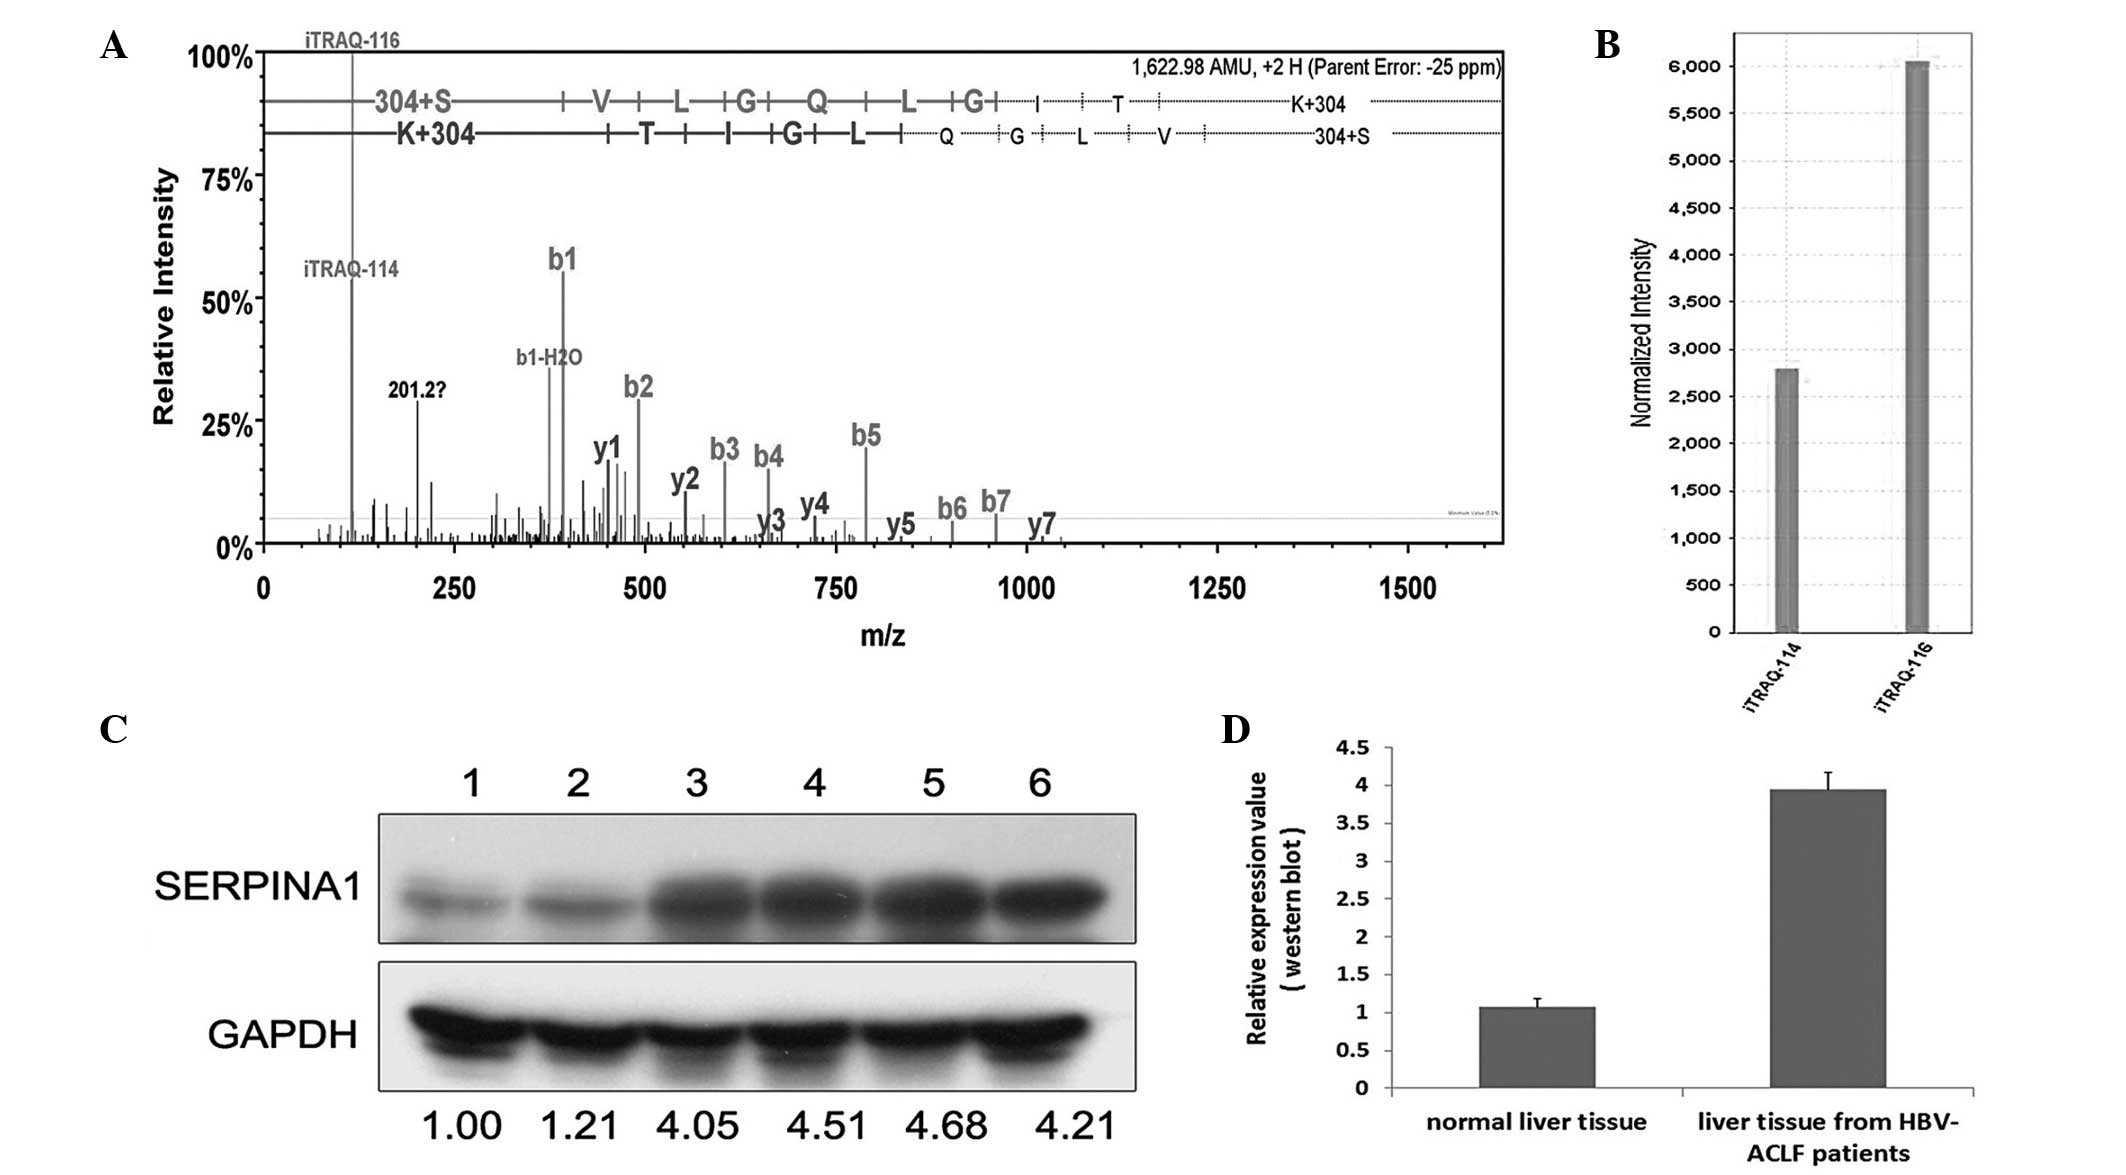
Previous studies have investigated SERPINA1 in liver
disease. In hepatitis C, following Basic Local Alignment Search
Tool analysis in the positive clones, 3 proteins that interacted
with the HCV NS3 protease were serpin peptidase inhibitor, clade A,
member 1, and cyclophilin-LC (20).
α-1-antiproteinase has potential use as a biomarker for the
non-invasive diagnosis of liver fibrosis, which may benefit the
follow-up of HCV patients (21).
Furthermore, α-1-antiproteinase deficiency is an autosomal
recessive disorder in HCC that results from point mutations in the
SERPINA1 gene, which are associated with neonatal hepatitis and
cirrhosis, as well as HCC (22).
α-1-antiproteinase may also be a biomarker (protein marker) for HCC
(23) and have potential as a
biomarker for diagnosing CHB, as Tan et al (24) reported that the protein was highly
expressed in serum samples from HCC patients and severe chronic
hepatitis patients. Furthermore, α-1-antiproteinase is expressed
most markedly in normal tissue and cells and exhibits reduced
expression in tissues and cells from HCC patients and severe
chronic hepatitis patients, which indicates the specific secretion
of α-1-antiproteinase from tissues and cells into the serum
(24). The present results, however,
demonstrated that SERPINA1 expression was increased 2.297-fold in
liver tissue samples from patients with HBV-induced ACLF. This may
have been due to the fact that not all of the patients in the
present study exhibited cirrhosis, meaning that they were in a
less-advanced disease course. Thus, the majority of the SERPINA1
had not been secreted from the liver into the serum. Further
studies with larger sample sizes and cell function experiments are
therefore required.
In conclusion, the biological function of these
proteins in HBV-induced ACLF remains unclear, and it is difficult
to determine whether or not the differences in protein level were
the result or the origin of the ACLF. Additionally, certain results
obtained in the present study are inconsistent with those of
previous studies. Further functional studies are required,
including studies using a larger sample and cell function
experiments. The proteins showing differential expression that have
been described in the present study may not be suitable for use as
biomarkers for the clinical prognostic index of CHB, as this is an
invasive method; however, by identifying specific proteins and
protein derangements, further insight may be obtained into the
deregulated pathways and networks involved in the pathogenesis of
HBV-induced ACLF. Furthermore, the present proteomic study may be
useful and valuable for future studies of the protein mechanisms
underlying the pathogenesis of CHB.
Acknowledgements
This study was supported by grants from the National
Natural Science Foundation of China (nos. 81101256 and 81370535),
the National Science and Technology Major Projects (nos.
2012ZX10002004 and 2012ZX10002007), the Fundamental Research Funds
for the Central Universities (nos. 12YKPY35 and 13YKZD17) and the
Natural Science Foundation of Guangdong Province (no.
S2013010016014). The authors would like to thank Miss Qin Zhang and
Mr. Bing-quan Lai for their assistance with the data analysis in
this study.
Glossary
Abbreviations
Abbreviations:
|
iTRAQ
|
isobaric tag for relative and absolute
quantification
|
|
HCC
|
hepatocellular carcinoma
|
|
HBV
|
hepatitis B virus
|
|
ACLF
|
acute-on-chronic liver failure
|
|
CHB
|
chronic hepatitis B
|
|
HBsAg
|
hepatitis B surface antigen
|
|
HBsAb
|
hepatitis B surface antibody
|
|
HBeAg
|
hepatitis B e antigen
|
|
HBeAb
|
hepatitis B e antibody
|
|
HBcAb
|
hepatitis B core antibody
|
|
HAV
|
hepatitis A virus
|
|
HCV
|
hepatitis C virus
|
|
HDV
|
hepatitis D virus
|
|
HEV
|
hepatitis E virus
|
|
ALT
|
alanine aminotransferase
|
|
AST
|
aspartate aminotransferase
|
|
TBIL
|
total billirubin
|
|
PT
|
prothrombin time
|
|
INR
|
international normalized ratio
|
|
BUN
|
blood urea nitrogen
|
|
CR
|
creatinine
|
|
MELD
|
model for end-stage liver disease
|
|
WBC
|
white blood cell
|
|
RBC
|
red blood cell
|
|
HB
|
hemoglobin
|
|
PLT
|
platelet
|
References
|
1
|
Chinese Society of Hepatology and Chinese
Society of Infectious Diseases; Chinese Medical Association: The
guideline of prevention and treatment for chronic hepatitis B (2010
version). Zhonghua Gan Zang Bing Za Zhi. 19:13–24. 2011.(In
Chinese). PubMed/NCBI
|
|
2
|
Lu FM and Zhuang H: Management of
hepatitis B in China. Chin Med J (Engl). 122:3–4. 2009.PubMed/NCBI
|
|
3
|
Ren F, Chen Y, Wang Y, Yan Y, Zhao J, Ding
M, Zhang J, Jiang Y, Zhai Y and Duan Z: Comparative serum proteomic
analysis of patients with acute-on-chronic liver failure:
Alpha-1-acid glycoprotein may be a candidate marker for prognosis
of hepatitis B virus infection. J Viral Hepat. 17:816–824. 2010.
View Article : Google Scholar : PubMed/NCBI
|
|
4
|
Yang L, Rudser KD, Higgins L, Rosen HR,
Zaman A, Corless CL, David L and Gourley GR: Novel biomarker
candidates to predict hepatic fibrosis in hepatitis C identified by
serum proteomics. Dig Dis Sci. 56:3305–3315. 2011. View Article : Google Scholar : PubMed/NCBI
|
|
5
|
Jin GZ, Li Y, Cong WM, Yu H, Dong H, Shu
H, Liu XH, Yan GQ, Zhang L, Zhang Y, et al: iTRAQ-2DLC-ESI-MS/MS
based identification of a new set of immunohistochemical biomarkers
for classification of dysplastic nodules and small hepatocellular
carcinoma. J Proteome Res. 10:3418–3428. 2011. View Article : Google Scholar : PubMed/NCBI
|
|
6
|
Lee HJ, Na K, Choi EY, Kim KS, Kim H and
Paik YK: Simple method for quantitative analysis of N-linked
glycoproteins in hepatocellular carcinoma specimens. J Proteome
Res. 9:308–318. 2010. View Article : Google Scholar : PubMed/NCBI
|
|
7
|
Goh WW, Lee YH, Zubaidah RM, Jin J, Dong
D, Lin Q, Chung MC and Wong L: Network-based pipeline for analyzing
MS data: An application toward liver cancer. J Proteome Res.
10:2261–2272. 2011. View Article : Google Scholar : PubMed/NCBI
|
|
8
|
Wu WW, Wang G, Baek SJ and Shen RF:
Comparative study of three proteomic quantitative methods, DIGE,
cICAT and iTRAQ, using 2D gel- or LC-MALDI TOF/TOF. J Proteome Res.
5:651–658. 2006. View Article : Google Scholar : PubMed/NCBI
|
|
9
|
Kolla V, Jenö P, Moes S, Tercanli S,
Lapaire O, Choolani M and Hahn S: Quantitative proteomics analysis
of maternal plasma in Down syndrome pregnancies using isobaric
tagging reagent (iTRAQ). J Biomed Biotechnol.
2010.9520472010.PubMed/NCBI
|
|
10
|
Lok AS and McMahon BJ: Chronic hepatitis
B: update 2009 (AASLD Practice Guidelines). Hepatology. 50:661–662.
2009. View Article : Google Scholar : PubMed/NCBI
|
|
11
|
Sarin SK, Kumar A, Almeida JA, Chawla YK,
Fan ST, Garg H, de Silva HJ, Hamid SS, Jalan R, Komolmit P, et al:
Acute-on-chronic liver failure: consensus recommendations of the
Asian Pacific Association for the study of the liver (APASL).
Hepatol Int. 3:269–282. 2009. View Article : Google Scholar : PubMed/NCBI
|
|
12
|
Vilardell F, Novell A, Martin J, Santacana
M, Velasco A, Díez-Castro MJ, Cuevas D, Panadés MJ, González S,
Llombart A, et al: Importance of assessing CK19 immunostaining in
core biopsies in patients subjected to sentinel node study by OSNA.
Virchows Arch. 460:569–575. 2012. View Article : Google Scholar : PubMed/NCBI
|
|
13
|
Kosacka M and Jankowska R: The prognostic
value of cytokeratin 19 expression in non-small cell lung cancer.
Pneumonol Alergol Pol. 75:317–323. 2007.(In Polish). PubMed/NCBI
|
|
14
|
Fournier T, Medjoubi-N N and Porquet D:
Alpha-1-acid glycoprotein. Biochim Biophys Acta. 1482:157–171.
2000. View Article : Google Scholar : PubMed/NCBI
|
|
15
|
Chirwa N, Govender D, Ndimba B, Lotz Z,
Tyler M, Panieri E, Kahn D and Mall AS: A 40–50 kDa glycoprotein
associated with mucus is identified as α-1-acid glycoprotein in
carcinoma of the stomach. J Cancer. 3:83–92. 2012. View Article : Google Scholar : PubMed/NCBI
|
|
16
|
Saarnio J, Parkkila S, Parkkila AK,
Haukipuro K, Pastorekova S, Pastorek J, Kairaluoma MI and Karttunen
TJ: Immunohistochemical study of colorectal tumors for expression
of a novel transmembrane carbonic anhydrase, MN/CA IX, with
potential value as a marker of cell proliferation. Am J Pathol.
153:279–285. 1998. View Article : Google Scholar : PubMed/NCBI
|
|
17
|
Yamachika T, Nakanishi H, Yasui K, Ikehara
Y, Niwa T, Wanibuchi H, Tatematsu M and Fukushima S: Establishment
and characterization of a human colonic mucinous carcinoma cell
line with predominant goblet-cell differentiation from liver
metastasis. Pathol Int. 55:550–557. 2005. View Article : Google Scholar : PubMed/NCBI
|
|
18
|
Lee WY, Huang SC, Hsu KF, Tzeng CC and
Shen WL: Roles for hypoxia-regulated genes during cervical
carcinogenesis: Somatic evolution during the
hypoxia-glycolysis-acidosis sequence. Gynecol Oncol. 108:377–384.
2008. View Article : Google Scholar : PubMed/NCBI
|
|
19
|
Elchuri S, Naeemuddin M, Sharpe O,
Robinson WH and Huang TT: Identification of biomarkers associated
with the development of hepatocellular carcinoma in CuZn superoxide
dismutase deficient mice. Proteomics. 7:2121–2129. 2007. View Article : Google Scholar : PubMed/NCBI
|
|
20
|
Huang Y, Cai XF, He MR, Zhang J and Huang
AL: Screening of proteins interacting with hepatitis C virus NS3
from T7-phage display library. Zhonghua Gan Zang Bing Za Zhi.
14:561–564. 2006.(In Chinese). PubMed/NCBI
|
|
21
|
Caillot F, Hiron M, Goria O, Gueudin M,
Francois A, Scotte M, Daveau M and Salier JP: Novel serum markers
of fibrosis progression for the follow-up of hepatitis C
virus-infected patients. Am J Pathol. 175:46–53. 2009. View Article : Google Scholar : PubMed/NCBI
|
|
22
|
Ekeowa UI, Marciniak SJ and Lomas DA: α
(1)-antitrypsin deficiency and inflammation. Expert Rev Clin
Immunol. 7:243–252. 2011. View Article : Google Scholar : PubMed/NCBI
|
|
23
|
Chen XL, Zhou L, Yang J, Shen FK, Zhao SP
and Wang YL: Hepatocellular carcinoma-associated protein markers
investigated by MALDI-TOF MS. Mol Med Rep. 3:589–596. 2010.
View Article : Google Scholar : PubMed/NCBI
|
|
24
|
Tan XF, Wu SS, Li SP, Chen Z and Chen F:
Alpha-1 antitrypsin is a potential biomarker for hepatitis B. Virol
J. 8:2742011. View Article : Google Scholar : PubMed/NCBI
|