Introduction
Bovine tuberculosis (BTB) is caused by the
intracellular pathogen Mycobacterium bovis (M.
bovis), which is a facultative intracellular parasite of
macrophages. BTB has a significant economic impact and serious
implications for human health, particularly in developing countries
(1). M. bovis can be
transmitted to humans by infectious bacilli via respiratory contact
with infected cattle, or consumption of unpasteurized dairy
products (2). The host immune
response to M. bovis infection is complex: Following initial
exposure, T-helper cell-1 (Th1) innate immunity is
induced. The bacilli are phagocytosed by host macrophages via
pathogen-recognition receptors (PRRs), such as Toll-like receptors
(TLRs) and C-type lectin receptors (3,4). Signals
transduced through these receptors result in the release of
endogenous cytokines, which initiate the T-cell secretion of
proinflammatory cytokines, including tumor necrosis factor-α
(TNF-α) and interferon-γ (IFN-γ). The action of IFN-γ on infected
macrophages promotes granuloma formation, which prevents the spread
of infection (5). However, the
pathogen often persists within granulomas, and this latent
infection can recur as active tuberculosis. The mechanisms
underlying evasion of the host immune response by M. bovis
are not entirely understood; however they are known to involve the
prevention of host phagosome maturation, the inhibition of
apoptosis in infected macrophages, and the suppression of cell
signaling pathways and cytokine production (6–8).
Genomic technologies can be used to elucidate the
molecular mechanisms underlying immune responses to pathogens. With
the availability of the complete Bos taurus genome (9), numerous studies have used bovine genome
microarrays to analyze transcriptional changes induced by infection
of various types of bovine cells with M. bovis (10,11).
Killick et al (12) reported
that M. bovis infection of peripheral blood leukocytes was
associated with decreased expression levels of numerous host genes.
Using an Affymetrix bovine genome array to investigate the effects
of M. bovis challenge on bovine monocyte-derived macrophages
in vitro, Magee et al (6) observed significant alterations in
expression of genes associated with the inflammatory response, and
cell signaling pathways, including TLRs, PRRs and apoptosis.
Furthermore, the suppression of immune-associated genes has been
detected in vivo in M. bovis-infected cattle
(10).
These observations strongly suggest that M.
bovis evades immune surveillance by altering the expression of
genes essential to host immunity. The timing and potency of the
cellular and immunological events that occur immediately after
infection are suggested to be crucial determinants governing the
outcome of an infection (13).
Therefore, further elucidation of these early events in numerous
types of host cells is essential for the prevention, detection, and
treatment of M. bovis infections. The aim of the present
study was to evaluate early changes in global gene expression in
bovine peripheral blood mononuclear cells (PBMCs) in response to
M. bovis exposure. Microarray analyses were used to compare
PBMC gene expression over a time course of 0, 4, and 24 h following
exposure to M. bovis. Systems analysis was then used to
determine the pathways and networks associated with the affected
genes.
Materials and methods
PBMC preparation
The three 3-year-old female Holstein cattle with no
recent history of BTB, which were used in the present study, were
obtained from the National Taiwan University Experimental Farm
(Taipei, Taiwan, R.O.C). The cattle were maintained under uniform
housing conditions (temperature, 25–28°C; humidity, 50–70%) and
nutritional regimens; the cattle were fed twice a day with alfalfa
and pangola grass hay and fresh, farm-grown grass, and all tested
negative on tuberculin skin tests. All procedures described in the
present study were reviewed and approved by the National Taiwan
University Institutional Animal Care and Use Committee (Taipei,
Taiwan, R.O.C). From each animal, 50 ml blood from the vein was
collected in a sterile heparinized bottle and layered onto
ACCUSPIN™ tubes containing Histopaque® 1077 (Sigma-Aldrich, St.
Louis, MO, USA). Following density gradient centrifugation (300 × g
for 20 min at room temperature), the PBMCs were collected and
cultured as previously described by Magee et al (6), with numerous modifications, including
the use of an antibiotic-free culture media supplemented with
NaHCO3 and 10% fetal bovine serum. Cell cultures in 60
mm dishes (~5×10⁶ cells/dish), were grown in RPMI (Gibco
Life Technologies, Grand Island, NY, USA) supplemented with 10%
fetal bovine serum (GE Healthcare Life Sciences, Logan, UT, USA)
and NaHCO3 to a final concentration of 26 mM at 37°C for
24 h in a culture incubator containing 5% CO2. The
medium was then replaced with 1 ml fresh medium in order to remove
any non-adherent cells. To ensure that the same number of PBMCs
were subjected to M. bovis-challenge, 80–100% confluent monolayers
of PBMCs were generated and counted on day 3, yielding
~5×10⁶ cells per dishes, providing enough total RNA for
microarray analysis. The cells were counted in Marienfeld® Thoma
counting chamber (Celeromics Technologies, Grenoble, France), and
trypan blue solution (Sigma-Aldrich, St. Luis, MO, USA) was used
for the exclusion of dead cells.
Bacterial preparations
M. bovis strain 331-A1 (Animal Health Research
Institute, New Taipei City, Taiwan, R.O.C), which was isolated in
2008 from cattle with tuberculosis, was used. The strain was
confirmed by acid-fast staining using the Ziehl-Neelsen method, the
gold standard procedure for the diagnosis of tuberculosis, and
identified in mycobacterium culture by PCR and spoligotyping
(14). The strain used was
spoligotype SB0265, which is frequently isolated from cattle in
Taiwan. The strain was cultured in Middlebrook 7H9 broth (BD
Biosciences, Franklin Lakes, NJ, USA) containing 10% (v/v)
Middlebrook albumin-dextrose-catalase (BD Biosciences), 0.05% Tween
80 (Sigma-Aldrich) and 0.40% (w/v) sodium pyruvate (Sigma-Aldrich)
at 37°C. Bacterial suspensions were then centrifuged at 3,000 × g
for 15 min at 25°C, and the pellets were washed twice in
phosphate-buffered saline (PBS, pH 7.0), and resuspended in PBS
prior to the determination of bacterial concentrations. A NanoDrop
1000 spectrophotometer (Thermo Fisher Scientific, Inc., Wilmington,
DE, USA) was used to determine the optical density of the bacterial
culture and calculate bacterial concentration in colony-forming
u/ml. The concentration of the bacterial inoculum was
107 colony-forming units/ml. Fresh stocks of bacteria
were prepared for each experiment.
In vitro challenge of PBMCs with M.
bovis
When the PBMCs reached 80% confluence, three dishes
for each M. bovis infection trial were randomly selected from the
20 dishes grown from cells collected from each cow. All in
vitro challenge experiments included a non-challenge PBMC
control for each time point. The cells were inoculated at a
multiplicity of infection (MOI) of ~2:1 (6), and control cultures were treated in the
same manner using PBS instead of bacterial suspensions. Inoculated
and control cultures were incubated for either 4 h (4-hours
post-infection (hpi) group) or 24 h (24-hpi group). Total RNA was
then extracted using the RNeasy Mini kit (Qiagen, Inc., Valencia,
CA, USA), according to the manufacturer's instructions. The
concentration and purity of RNA extracts were verified optically
using a spectrophotometer (ND-1000; Nanodrop Technologies, Thermo
Fisher Scientific, Inc.) and the Bioanalyzer 2100 (Agilent
Technologies, Inc., Santa Clara, CA, USA), respectively.
Microarray analysis
Bovine V2 Oligo 4×44 K microarrays (Agilent
Technologies, Inc.) were used to determine the differential gene
expression between infected and control cells. For reverse
transcription, second-strand cDNA was synthesized from 0.5 µg total
RNA using the Fluorescent Linear Amplification kit containing T7
RNA polymerase (Agilent Technologies, Inc.). The cDNA served as
template for in vitro transcription to produce target cRNA
labeled with Cy3-CTP (to label infected cells) and Cy5-CTP (to
label control cells) (PerkinElmer, Inc., Waltham, MA, USA). Labeled
cRNA (0.825 µg) was fragmented (mean size, ~50–100 nucleotides) in
fragmentation buffer (Agilent Technologies, Inc.) at 60°C for 30
min. The prepared cRNA was subsequently hybridized to the
microarray at 60°C for 17 h. Two replicates of the microarray
assays (M1 and M2) were performed. Hybridized microarray chips were
scanned using the Agilent Microarray Scanner with Feature
Extraction software 9.5.3 (Agilent Technologies, Inc.). The locally
weighted linear regression method was applied to normalize the
results by rank consistency filtering.
Statistical analysis of microarray
data
Microarray data were analyzed using GeneSpring GX
7.3.1 software (Agilent Technologies, Inc.). With a false discovery
rate <0.05, data acquisition was conducted using the following
criteria: i) P<0.01 for gene expression difference (GeneSpring);
ii) a distinct signal from the microarray image that was flagged by
the software; and iii) |-log 2-fold change| ≥2.5. Significantly
enriched genes were identified using the Kyoto Encyclopedia of
Genes and Genomes (KEGG; http://www.genome.jp/kegg/), and the pathways and
networks involving these genes were identified using Ingenuity
Pathway Analysis (IPA; http://norris.usc.libguides.com/IPA), a web-based
functional analysis tool. The criteria for gene selection for IPA
analysis were as follows: i) A fold-change in expression >2 for
comparison between 0 and 4 hpi and >4 for comparison between 0
and 24 hpi, and ii) P<0.05 for changes in gene expression in
cells from all three cows.
Results
Kinetics of gene expression during M.
bovis infection
Comprehensive gene expression profiles of the three
PBMC samples with or without M. bovis challenge were generated
using oligonucleotide bovine microarrays containing 43,803 probe
sets. These probe sets interrogated the expression levels of
~29,356 transcripts, some of which mapped to known genes. A total
of 3,937 probe sets passed the filtering step, consisting of a
t-test with an adjusted P-value threshold ≤0.05. At 4 and 24 hpi,
207 and 3,186 unique probe sets, respectively, were significantly
differentially expressed (Fig. 1).
To investigate the kinetics of gene expression, a total of 420
genes (including genes of unknown function) were found to be
differentially expressed. Genes with an upregulated expression (30
out of 135 genes of known function) following exposure of PBMC to
M. bovis are listed in Table
I, and those with a downregulated expression (84 out of 285
genes of known function) are listed in Table II. As shown in Tables I and II, the genes with a fold change ≥2.5
between 0–4, 4–24 and 0–24 h were listed and divided by functions.
Inspection of KEGG pathway annotations for these genes detected
their association with the immune system (28%), signal transduction
(23%), metabolism (21%), transport and catabolism (8%), genetic
information processing (6%), cell growth and death (6%), and other
organismal systems (8%). Of the affected genes associated with the
immune system, 84.85% were downregulated in PBMCs following M.
bovis challenge (Fig. 2). These
results indicate a decreased Th1 response [downregulated
TNF-α, IFN-γ, and interleukin (IL)-12β], suggesting M. bovis
infection may suppress the PBMC immune response.
 | Table I.Genes with upregulated expression
(≥2.5-fold) following exposure of peripheral blood mononuclear
cells to Mycobacterium bovis. |
Table I.
Genes with upregulated expression
(≥2.5-fold) following exposure of peripheral blood mononuclear
cells to Mycobacterium bovis.
|
|
| Fold change |
|
|
|---|
|
|
|
|
|
|
|---|
| Processes | Symbol | 0–4 h | 4–24 h | 0–24 h | P-value | Gene name |
|---|
| Signal
transduction |
|
|
|
|
|
|
|
| CLEC4E | 1.15 | 7.70 | 8.85 | 0.001 | C-type lectin
domain family 4 member E |
|
| STAT1 | 0.71 | 2.98 | 2.12 | 0.002 | Signal transducer
and activator of transcription 1 |
|
| DDIT3 | 0.78 | 2.91 | 2.27 | 0.004 |
DNA-damage-inducible transcript 3 |
|
| LDHA | 0.77 | 2.81 | 2.16 | <0.001 | Lactate
dehydrogenase A (LDHA) |
| Immune system |
|
|
|
|
|
|
|
| C3AR1 | 0.97 | 6.68 | 6.49 | 0.002 | Complement
component 3a receptor 1 |
|
| PDK1 | 0.86 | 6.14 | 5.26 | 0.001 | Pyruvate
dehydrogenase kinase, isozyme 1 |
|
| DAPP1 | 0.58 | 4.16 | 2.43 | <0.001 | Dual adaptor of
phosphotyrosine and 3-phosphoinositides |
|
| RASGRP1 | 0.90 | 3.43 | 3.09 | <0.001 | RAS guanyl
releasing protein 1 (calcium and DAG-regulated) |
|
| CD244 | 0.94 | 3.29 | 3.08 | <0.001 | CD244 molecule,
natural killer cell receptor 2B4 |
|
| IL7 | 0.61 | 2.63 | 1.59 | 0.001 | Interleukin-7
precursor |
| Endocytosis and
transport |
|
|
|
|
|
|
|
| COLEC11 | 1.14 | 4.78 | 5.44 | <0.001 | Collectin
sub-family member 11 |
|
| LAMP3 | 0.97 | 2.81 | 2.72 | 0.001 |
Lysosomal-associated membrane protein
3 |
|
| CTSL2 | 0.39 | 2.78 | 1.08 | 0.005 | Cathepsin L2 |
|
| EHD1 | 0.90 | 2.58 | 2.33 | 0.001 | EH-domain
containing 1 |
| Inflammation and
apoptosis |
|
|
|
|
|
|
|
| CDKN2D | 1.21 | 03.15 | 3.82 | <0.001 | Cyclin-dependent
kinase inhibitor 2D (p19, inhibits CDK4) |
|
| CCNG2 | 0.59 | 2.60 | 1.53 | 0.004 | Cyclin G2 |
| Others |
|
|
|
|
|
|
|
| ME1 | 0.95 | 6.79 | 6.48 | 0.002 | Malic enzyme 1 |
|
| FBXL3 | 0.90 | 4.21 | 3.80 | <0.001 | F-box and
leucine-rich repeat protein 3 |
|
| SQLE | 0.97 | 3.52 | 3.41 | 0.003 | Squalene
epoxidase |
|
| POLD4 | 1.01 | 3.34 | 3.37 | 0.003 | Polymerase
(DNA-directed), delta 4 |
|
| PTGES | 1.12 | 3.13 | 3.52 | <0.001 | Prostaglandin E
synthase (PTGES) |
|
| PHOSPHO2 | 1.03 | 3.06 | 3.15 | <0.001 | Phosphatase, orphan
2 |
|
| DCK | 1.03 | 2.99 | 3.07 | <0.001 | Deoxycytidine
kinase |
|
| PLA2G16 | 0.84 | 2.91 | 2.44 | <0.001 | Phospholipase A2,
group XVI |
|
| CSGALNACT1 | 1.07 | 2.87 | 3.07 | 0.001 | Chondroitisulfate
N-acetylgalactosam inyltransferase 1 |
|
| NAPB | 0.85 | 2.83 | 2.40 | 0.005 |
N-ethylmaleimide-sensitive factor
attachment protein, beta |
|
| PGAP1 | 1.00 | 2.77 | 2.76 | <0.001 | Similar to GPI
deacylase |
|
| HSD17B7 | 0.93 | 2.65 | 2.47 | 0.002 | Hydroxysteroid
(17-beta) dehydrogenase 7 |
|
| TRIP10 | 1.05 | 2.63 | 2.75 | <0.001 | Thyroid hormone
receptor interactor 10 |
|
| FDFT1 | 0.92 | 2.62 | 2.41 | <0.001 |
Farnesyl-diphosphate farnesyltransferase
1 |
| Table II.Genes with downregulated expression
(≥ 2.5-fold) following exposure of peripheral blood mononuclar
cells to Mycobacterium bovis. |
Table II.
Genes with downregulated expression
(≥ 2.5-fold) following exposure of peripheral blood mononuclar
cells to Mycobacterium bovis.
|
|
| Fold change |
|
|
|---|
|
|
|
|
|
|
|---|
| Processes | Symbol | 0–4 h | 4–24 h | 0–24 h | P-value | Gene name |
|---|
| Signal
transduction |
|
|
|
|
|
|
|
| THBS1 | 1.33 | −27.82 | −20.91 | <0.001 | Thrombospondin
1 |
|
| HMOX1 | 1.29 | −10.11 | −7.86 | <0.001 | Heme oxygenase
(decycling) 1 |
|
| FST | 1.19 | −7.82 | −6.59 | <0.001 | Follistatin |
|
| FOSL1 | −1.08 | −5.65 | −6.11 | 0.004 | Fos-related antigen
1 (FRA-1) |
|
| CD38 | 1.05 | −5.64 | −5.38 | 0.002 | CD38 molecule |
|
| GNG4 | 1.06 | −5.21 | −4.93 | <0.001 | Guanine nucleotide
binding protein (G protein), gamma 4 |
|
| FZD4 | 1.20 | −4.98 | −4.16 | <0.001 | Frizzled homolog
4 |
|
| EDN1 | −1.14 | −4.51 | −5.13 | 0.002 | Endothelin 1 |
|
| PTAFR | 1.14 | −4.01 | −3.51 | 0.005 | Platelet-activating
factor receptor |
|
| MRAS | 1.29 | −3.64 | −2.82 | 0.002 | Muscle RAS oncogene
homolog |
|
| FOS | −1.02 | −3.56 | −3.64 | 0.002 | FBJ murine
osteosarcoma viral oncogene homolog |
|
| ICOS | −1.30 | −3.06 | −3.99 | <0.001 | Inducible T-cell
co-stimulator |
|
| FN1 | 1.20 | −2.87 | −2.40 | 0.004 | Fibronectin 1 |
|
| NUMBL | 1.24 | −2.83 | −2.28 | 0.002 | Numb homolog
(Drosophila)-like |
|
| CACNG4 | 1.25 | −2.79 | −2.24 | 0.001 | Calcium channel,
voltage-dependent, gamma subunit 4 |
|
| PTGS2 | −1.13 | −2.71 | −3.06 | <0.001 |
Prostaglandin-endoperoxide synthase 2 |
|
| TCF7L2 | 1.21 | −2.51 | −2.08 | <0.001 | Transcription
factor 7-like 2 (T-cell specific, HMG-box) |
| Immune system |
|
|
|
|
|
|
|
| C1QB | 1.21 | −26.31 | −21.76 | 0.002 | Complement
component 1, q subcomponent, B chain |
|
| PPBP | −1.07 | −17.11 | −18.37 | <0.001 | Pro-platelet basic
protein (chemokine (C-X-C motif) ligand 7) |
|
| CFB | −1.07 | −16.33 | −17.52 | <0.001 | Complement factor B
(CFB) |
|
| IFNG | 1.02 | −14.28 | −14.06 | <0.001 | Interferon,
gamma |
|
| THBD | −1.00 | −14.27 | −14.32 | <0.001 | Thrombomodulin |
|
| GZMB | 1.13 | −9.25 | −8.21 | <0.001 | Granzyme B
(granzyme 2, cytotoxic T-lymphocyte-associated serine esterase
1) |
|
| C1QA | 1.08 | −7.58 | −7.03 | <0.001 | Complement
component 1, q subcomponent, A chain |
|
| SPP1 | −1.07 | −6.62 | −7.05 | 0.003 | Secreted
phosphoprotein 1 |
|
| PLK3 | −1.10 | −5.99 | −6.60 | <0.001 | Polo-like kinase 3
(Drosophila) |
|
| F13A1 | 1.07 | −5.12 | −4.79 | 0.002 | Coagulation factor
XIII, A1 polypeptide |
|
| PLA2G4A | 1.07 | −4.58 | −4.28 | 0.002 | Phospholipase A2,
group IVA (cytosolic, calcium-dependent) |
|
| CD55 | −1.09 | −4.54 | −4.97 | <0.001 | CD55 molecule,
decay accelerating factor for complement (Cromer blood group) |
|
| CD14 | 1.49 | −4.41 | −2.96 | <0.001 | CD14 molecule |
|
| IL10 | −1.29 | −4.11 | 5.30 | 0.002 | Interleukin 10 |
|
| MAP3K8 | −1.17 | −4.02 | −4.70 | <0.001 | Mitogen-activated
protein kinase kinase kinase 8 |
|
| CCR3 | 1.01 | −3.88 | −3.84 | 0.003 | Chemokine (C-C
motif) receptor 3 |
|
| CCR4 | −1.06 | −3.63 | −3.85 | 0.002 | Chemokine (C-C
motif) receptor 4 |
|
| KLRK1 | −1.16 | −3.55 | −4.12 | <0.001 | Killer cell
lectin-like receptor subfamily K, member 1 |
|
| IL2RA | −1.00 | −3.46 | −3.48 | <0.001 | Interleukin 2
receptor, alpha (IL2RA) |
|
| CSF1R | 1.32 | −3.41 | −2.58 | <0.001 | Colony stimulating
factor 1 receptor precursor |
|
| CCR1 | 1.08 | −3.18 | −2.95 | 0.003 | Chemokine (C-C
motif) receptor 1 |
|
| CCL4 | −1.06 | −3.13 | −3.31 | 0.006 | Chemokine (C-C
motif) ligand 4 (CCL4), |
|
| INHBA | 1.04 | −3.13 | −3.02 | 0.002 | Inhibin, beta
A |
|
| PECAM1 | 1.04 | −3.59 | −3.47 | 0.001 |
Platelet/endothelial cell adhesion
molecule |
|
| TNFRSF25 | −1.10 | −3.08 | −3.40 | <0.001 | Tumor necrosis
factor receptor superfamily, member 25 |
|
| CCL3 | 1.35 | −3.01 | −2.22 | 0.002 | Chemokine (C-C
motif) ligand 3 |
|
| TLR8 | −1.26 | −2.85 | −3.60 | 0.006 | Toll-like receptor
8 |
|
| IL12B | −1.20 | −2.83 | −3.40 | 0.004 | Interleukin
12B |
|
| CTSB | −1.06 | −2.79 | −2.97 | 0.003 | Cathepsin B |
|
| JAM3 | 1.05 | −2.67 | −2.54 | <0.001 | Junctional adhesion
molecule 3 |
|
| SIPA1 | 1.07 | −2.61 | −2.43 | 0.003 | Signal-induced
proliferation-associated 1 |
|
| PGD | −1.16 | −2.54 | −2.95 | 0.004 | Phosphogluconate
dehydrogenase |
| Endocytosis and
transport |
|
|
|
|
|
|
|
| RAB7B | 1.13 | −4.29 | −3.79 | <0.001 | RAB7B, member RAS
oncogene family |
|
| CD36 | 1.02 | −3.58 | −3.50 | 0.001 | CD36 molecule
(thrombospondin receptor) |
|
| ACP2 | 1.00 | −3.56 | −3.54 | <0.001 | Acid phosphatase 2,
lysosomal |
|
| SORT1 | −1.02 | −3.45 | −3.51 | <0.001 | Sortilin 1 |
|
| ACTB | 1.17 | −2.85 | −2.44 | <0.001 | Actin, beta |
|
| AP1B1 | 1.03 | −2.78 | −2.71 | <0.001 | Adaptor-related
protein complex 1, beta 1 subunit |
| Inflammation and
apoptosis |
|
|
|
|
|
|
|
| TNF | −1.02 | −6.07 | −6.18 | <0.001 | Tumor necrosis
factor (TNF superfamily, member 2) |
|
| IL1RAP | 1.17 | −4.85 | −5.67 | 0.005 | Interleukin 1
receptor accessory protein |
|
| IGFBP3 | −1.06 | −3.06 | −3.23 | 0.002 | Insulin-like growth
factor binding protein 3 |
|
| CDKN1C | 1.33 | −2.95 | −2.22 | <0.001 | Cyclin-dependent
kinase inhibitor 1C (p57, Kip2) |
|
| AMOTL1 | −1.10 | −2.71 | −2.99 | 0.001 | Angiomotin like
1 |
|
| FASLG | −1.19 | −2.62 | 3.12 | <0.001 | Fas ligand |
| Others |
|
|
|
|
|
|
|
| CYP3A4 | −1.04 | −4.65 | −4.83 | 0.002 | Cytochrome P450,
subfamily IIIA, polypeptide 4 |
|
| B4GALT6 | −1.05 | −4.09 | −4.31 | 0.003 | B4GALT6 protein,
transcript variant 2 |
|
| TBXAS1 | 1.07 | −4.03 | −3.78 | 0.002 | Thromboxane A
synthase 1 |
|
| ST8SIA1 | 1.07 | −3.78 | 3.52 | 0.002 |
Alpha-N-acetylneuraminide
alpha-2,8-sialyltransferase |
|
| GAB1 | 1.29 | −3.61 | −4.65 | <0.001 | GRB2-associated
binding protein 1 |
|
| HSD17B8 | 1.01 | −3.60 | −3.57 | 0.005 | Hydroxysteroid
(17-beta) dehydrogenase 8 |
|
| HS3ST1 | 1.55 | −3.27 | −2.11 | 0.001 | Heparan sulfate
(glucosamine) 3-O-sulfotransferase 1 |
|
| MMP14 | 1.04 | −3.09 | −2.96 | <0.001 | Matrix
metallopeptidase 14 |
|
| ITGAD | 1.03 | −2.83 | −2.75 | <0.001 | Integrin, alpha
D |
|
| TXNDC5 | −1.08 | −3.34 | −3.60 | <0.001 | Thioredoxin
domain-containing protein 5 precursor |
|
| VIM | 1.06 | −2.59 | −2.44 | 0.004 | Vimentin |
|
| SDS | −1.23 | −3.93 | −4.85 | <0.001 | Serine
dehydratase |
|
| EME2 | 1.09 | −2.65 | 2.44 | 0.003 | Endonuclease |
|
| SFRS7 | −1.02 | −2.82 | −2.87 | <0.001 | Splicing factor,
arginine/serine-rich 7 |
|
| NUP160 | 1.15 | −3.01 | −2.62 | 0.001 | Nucleoporin
160kDa |
|
| PWP2 | 1.13 | −2.92 | −2.59 | <0.001 | Periodic tryptophan
protein 2 homolog |
|
| DSE | −1.09 | −2.92 | −3.17 | <0.001 | Dermatan sulfate
epimerase |
|
| PNPLA4 | 1.10 | −2.83 | −2.57 | <0.001 | Patatin-like
phospholipase domain containing 4 |
|
| BLVRB | 1.00 | −2.75 | −2.75 | <0.001 | Biliverdin
reductase B |
|
| CHST2 | 1.04 | −2.75 | −2.64 | <0.001 | Carbohydrate
(N-acetylglucosamine-6-O) sulfotransferase 2 |
|
| AGPAT3 | 1.08 | −2.63 | −2.43 | <0.001 |
1-acylglycerol-3-phosphate
O-acyltransferase 3 |
|
| EXT1 | −1.19 | −2.61 | −3.12 | 0.001 | Exostoses
(multiple) 1 |
|
| GSTK1 | 1.12 | −2.60 | −2.90 | 0.002 | Glutathione
S-transferase kappa 1 |
Identification of pathways and
networks associated with genes affected by M. bovis infection
Gene set enrichment analysis was performed on the
microarray data to identify the specific biological pathways
associated with genes differentially expressed upon M. bovis
infection. IPA of the microarray data identified the functional
profiles of 15 genes that were differentially expressed between 0
and 4 hpi (Table III), and their
associated pathways (Table IV). A
total of 91 genes with differential expression between 0 and 24 hpi
were selected in the present study for IPA; and the results of the
top 28 (greatest change in expression) are shown in Table V. The pathways associated with these
genes are shown in Table VI. A map
of the network of pathways involving genes differentially expressed
between 0 and 4 hpi is shown in Figs.
3–6.
| Table III.Ingenuity pathway analysis profile of
genes differentially expressed between 0 and 4 hours post-infection
with Mycobacterium bovis. |
Table III.
Ingenuity pathway analysis profile of
genes differentially expressed between 0 and 4 hours post-infection
with Mycobacterium bovis.
| Symbol | Entrez gene
name | Fold change | Network | Location | Type(s) |
|---|
| CLDN3 | Claudin 3 | 3.07 | 3 | Plasma
membrane | Transmembrane
receptor |
| MMP2 | Matrix
metallopeptidase 2 (gelatinase A, 72 kDa gelatinase, 72 kDa type IV
collagenase) | 0.11 | 3 | Extracellular
space | Peptidase |
| MAPK14 | Mitogen-activated
protein kinase 14 | 0.05 | 1 | Cytoplasm | Kinase |
| GEMIN6 | Gem (nuclear
organelle) associated protein 6 | −0.09 | 4 | Nucleus | Other |
| TNF | Tumor necrosis
factor | −0.09 | 1 | Extracellular
space | Cytokine |
| TGFB1 | Transforming growth
factor, beta 1 | −0.13 | 1 | Extracellular
space | Growth factor |
| CREB1 | cAMP responsive
element binding protein 1 | −0.51 |
| Nucleus | Transcription
regulator |
| IL1B | Interleukin 1,
beta | −0.52 | 1 | Extracellular
space | Cytokine |
| STRAP | Serine/threonine
kinase receptor associated protein | −0.60 | 4 | Plasma
membrane | Other |
| REM1 | RAS (RAD and
GEM)-like GTP-binding 1 | −3.13 |
| Other | Enzyme |
| MMP13 | Matrix
metallopeptidase 13 (collagenase 3) | −6.25 | 1 | Extracellular
space | Peptidase |
| ADCY6 | Adenylate cyclase
6 | −6.67 | 2 | Plasma
membrane | Enzyme |
| GEMIN7 | Gem (nuclear
organelle) associated protein 7 | −11.11 | 4 | Nucleus | Other |
| SMURF2 | SMAD specific E3
ubiquitin protein ligase 2 | −16.67 | 1 | Cytoplasm | Enzyme |
| FMO4 | Flavin containing
monooxygenase 4 | −32.98 |
| Cytoplasm | Enzyme |
| Table IV.Pathways involving genes
differentially expressed between 0 and 4 hours post-infection with
Mycobacterium bovis. |
Table IV.
Pathways involving genes
differentially expressed between 0 and 4 hours post-infection with
Mycobacterium bovis.
| Ingenuity canonical
pathway | |−log (p)| | Gene
ratioa | Genes |
|---|
| Granulocyte
adhesion and diapedesis | 2.57 | 1.2E-02 | MMP13, CLDN3 |
| Agranulocyte
adhesion and diapedesis | 2.52 | 1.14E-02 | MMP13, CLDN3 |
| Leukocyte
extravasation signaling | 2.43 | 1.02E-02 | MMP13, CLDN3 |
| Oncostatin M
signaling | 1.78 | 2.94E-02 | MMP13 |
| Inhibition of
matrix metalloproteases | 1.73 | 2.63E-02 | MMP13 |
| CDK5 signaling | 1.38 | 1.12E-02 | ADCY6 |
| TGF-β
signaling | 1.38 | 1.08E-02 | SMURF2 |
| IL-1 signaling | 1.36 | 9.8E-03 | ADCY6 |
| HIF1α
signaling | 1.32 | 9.8E-03 | MMP13 |
| Gαi signaling | 1.24 | 7.81E-03 | ADCY6 |
| eNOS signaling | 1.23 | 7.75E-03 | ADCY6 |
| CXCR4
signaling | 1.15 | 6.25E-03 | ADCY6 |
| Gap junction
signaling | 1.15 | 6.41E-03 | ADCY6 |
| Tight junction
signaling | 1.14 | 6.37E-03 | CLDN3 |
| PPARα/RXRα
activation | 1.11 | 5.75E-03 | ADCY6 |
| RAR activation | 1.09 | 5.59E-03 | ADCY6 |
| LPS/IL-1 mediated
inhibition of RXR function | 1.01 | 4.5E-03 | FMO4 |
| Table V.Ingenuity pathway analysis profile of
genes differentially expressed between 0 and 24 hours
post-infection with Mycobacterium bovis. |
Table V.
Ingenuity pathway analysis profile of
genes differentially expressed between 0 and 24 hours
post-infection with Mycobacterium bovis.
| Symbol | Entrez gene
name | Fold change | Network | Location | Type(s) |
|---|
| GPNMB | Glycoprotein
(transmembrane) nmb | 22.93 | 2 | Plasma
membrane | Enzyme |
| AK4 | Adenylate kinase
4 | 19.13 | 4 | Cytoplasm | Kinase |
| KCNH2 | Potassium
voltage-gated channel, subfamily H (eag-related), member 2 | 18.27 | 4 | Plasma
membrane | Ion channel |
| CLEC4E | C-type lectin
domain family 4, member E | 13.36 | 2 | Plasma
membrane | Other |
| CLU | Clusterin | 12.13 | 4 | Cytoplasm | Other |
| C3AR1 | Complement
component 3a receptor 1 | 7.93 | 1 | Plasma
membrane | G-protein coupled
receptor |
| Akt | Bos taurus v-akt
murine thymoma viral oncogene homolog 2 | 2.06 | 4 | Cytoplasm | Group |
| BCL2 | B-cell CLL/lymphoma
2 | −0.29 | 3 | Cytoplasm | Transporter |
| CASP8 | Caspase 8,
apoptosis-related cysteine peptidase | −0.60 |
| Nucleus | Peptidase |
| NFKB1 | Nuclear factor of
kappa light polypeptide gene enhancer in B-cells 1 | −0.80 |
| Nucleus | Transcription
regulator |
| IL1B | Interleukin 1,
beta | −1.04 |
| Extracellular
space | Cytokine |
| FCER1G | Fc fragment of IgE,
high affinity I, receptor for; gamma polypeptide | −1.98 |
| Plasma
membrane | Transmembrane
receptor |
| CD55 | CD55 molecule,
decay accelerating factor for complement (Cromer blood group) | −4.76 | 2 | Plasma
membrane | Other |
| TNF | Tumor necrosis
factor | −6.45 | 1 | Extracellular
space | Cytokine |
| C1QA | Complement
component 1, q subcomponent, A chain | −7.69 | 1 | Extracellular
space | Other |
| PLK3 | Polo-like kinase
3 | −8.33 | 3 | Nucleus | Kinase |
| CEBPD | CCAAT/enhancer
binding protein (C/EBP), delta | −9.09 | 4 | Nucleus | Transcription
regulator |
| IL17F | Interleukin
17F | −9.52 | 1 | Extracellular
space | Cytokine |
| GZMB | Granzyme B
(granzyme 2, cytotoxic T-lymphocyte-associated serine esterase
1) | −11.11 | 1 | Cytoplasm | Peptidase |
| MMP13 | Matrix
metallopeptidase 13 (collagenase 3) | −11.11 | 1 | Extracellular
space | Peptidase |
| SMURF2 | SMAD specific E3
ubiquitin protein ligase 2 | −12.50 | 3 | Cytoplasm | Enzyme |
| CFB | Complement factor
B | −13.33 | 1 | Extracellular
space | Peptidase |
| THBS1 | Thrombospondin
1 | −13.33 | 1,2 | Extracellular
space | Other |
| FMO4 | Flavin containing
monooxygenase 4 | −14.29 |
| Cytoplasm | Enzyme |
| IFNG | Interferon,
gamma | −20.00 | 1,3 | Extracellular
space | Cytokine |
| THBD | Thrombomodulin | −20.00 | 1 | Plasma
membrane | Transmembrane
receptor |
| IL17RB | Interleukin 17
receptor B | −25.00 | 1 | Plasma
membrane | Transmembrane
receptor |
| C1QB | Complement
component 1, q subcomponent, B chain | −28.57 | 1 | Extracellular
space | Other |
| Table VI.Pathways involving genes
differentially expressed between 0 and 24 hours post-infection with
Mycobacterium bovis. |
Table VI.
Pathways involving genes
differentially expressed between 0 and 24 hours post-infection with
Mycobacterium bovis.
| Ingenuity canonical
pathways | |-log (P)| | Gene
ratioa | Molecules |
|---|
| Pattern recognition
receptors in recognition of bacteria and viruses | 3.23E00 | 4.21E-02 | C1QA, C1QB, C3AR1,
TNF |
| Production of
nitric oxide and reactive oxygen species in macrophages | 3.02E00 | 2.69E-02 | IFNG, MAP3K8, TNF,
CLU, RBP4 |
| Cytokines mediating
communication between immune cells | 2.86E00 | 5.77E-02 | IFNG, IL17F,
TNF |
| T helper cell
differentiation | 2.55E00 | 4.35E-02 | IFNG, IL17F,
TNF |
| VDR/RXR
activation | 2.37E00 | 3.85E-02 | IFNG, SPP1,
THBD |
| Crosstalk between
dendritic cells and natural killer cells | 2.2E00 | 3.3E-02 | IFNG, TNF,
ACTG1 |
| Acute phase
response signaling | 1.47E00 | 1.73E-02 | CFB, TNF, RBP4 |
| Communication
between innate and adaptive immune cells | 1.33E00 | 2.15E-02 | IFNG, TNF |
| PI3K/AKT
signaling | 1.03E00 | 1.48E-02 | GAB1, MAP3K8 |
| TNFR2
signaling | 9.51E-01 | 3.12E-02 | TNF |
| Interferon
signaling | 8.72E-01 | 2.94E-02 | IFNG |
| Antigen
presentation pathway | 8.38E-01 | 2.5E-02 | IFNG |
| Inhibition of
matrix metalloproteases | 8.28E-01 | 2.63E-02 | MMP13 |
| NF-κB
signaling | 7.96E-01 | 1.14E-02 | MAP3K8, TNF |
| iNOS signaling | 7.78E-01 | 2.13E-02 | IFNG |
| TNFR1
signaling | 7.43E-01 | 1.96E-02 | TNF |
| Cytotoxic T
lymphocyte-mediated apoptosis of target cells | 7.27E-01 | 1.92E-02 | GZMB |
| Leukocyte
extravasation signaling | 7.08E-01 | 1.02E-02 | MMP13, ACTG1 |
| Death receptor
signaling | 6.62E-01 | 1.61E-02 | TNF |
| Activation of IRF
by cytosolic pattern recognition receptors | 6.49E-01 | 1.59E-02 | TNF |
| Role of PI3K/AKT
signaling in the pathogenesis of influenza | 6.42E-01 | 1.49E-02 | IFNG |
| IL-10
signaling | 6.01E-01 | 1.39E-02 | TNF |
| Apoptosis
signaling | 5.06E-01 | 1.09E-02 | TNF |
| Fcγ
receptor-mediated phagocytosis in macrophages and monocytes | 4.87E-01 | 1.05E-02 | ACTG1 |
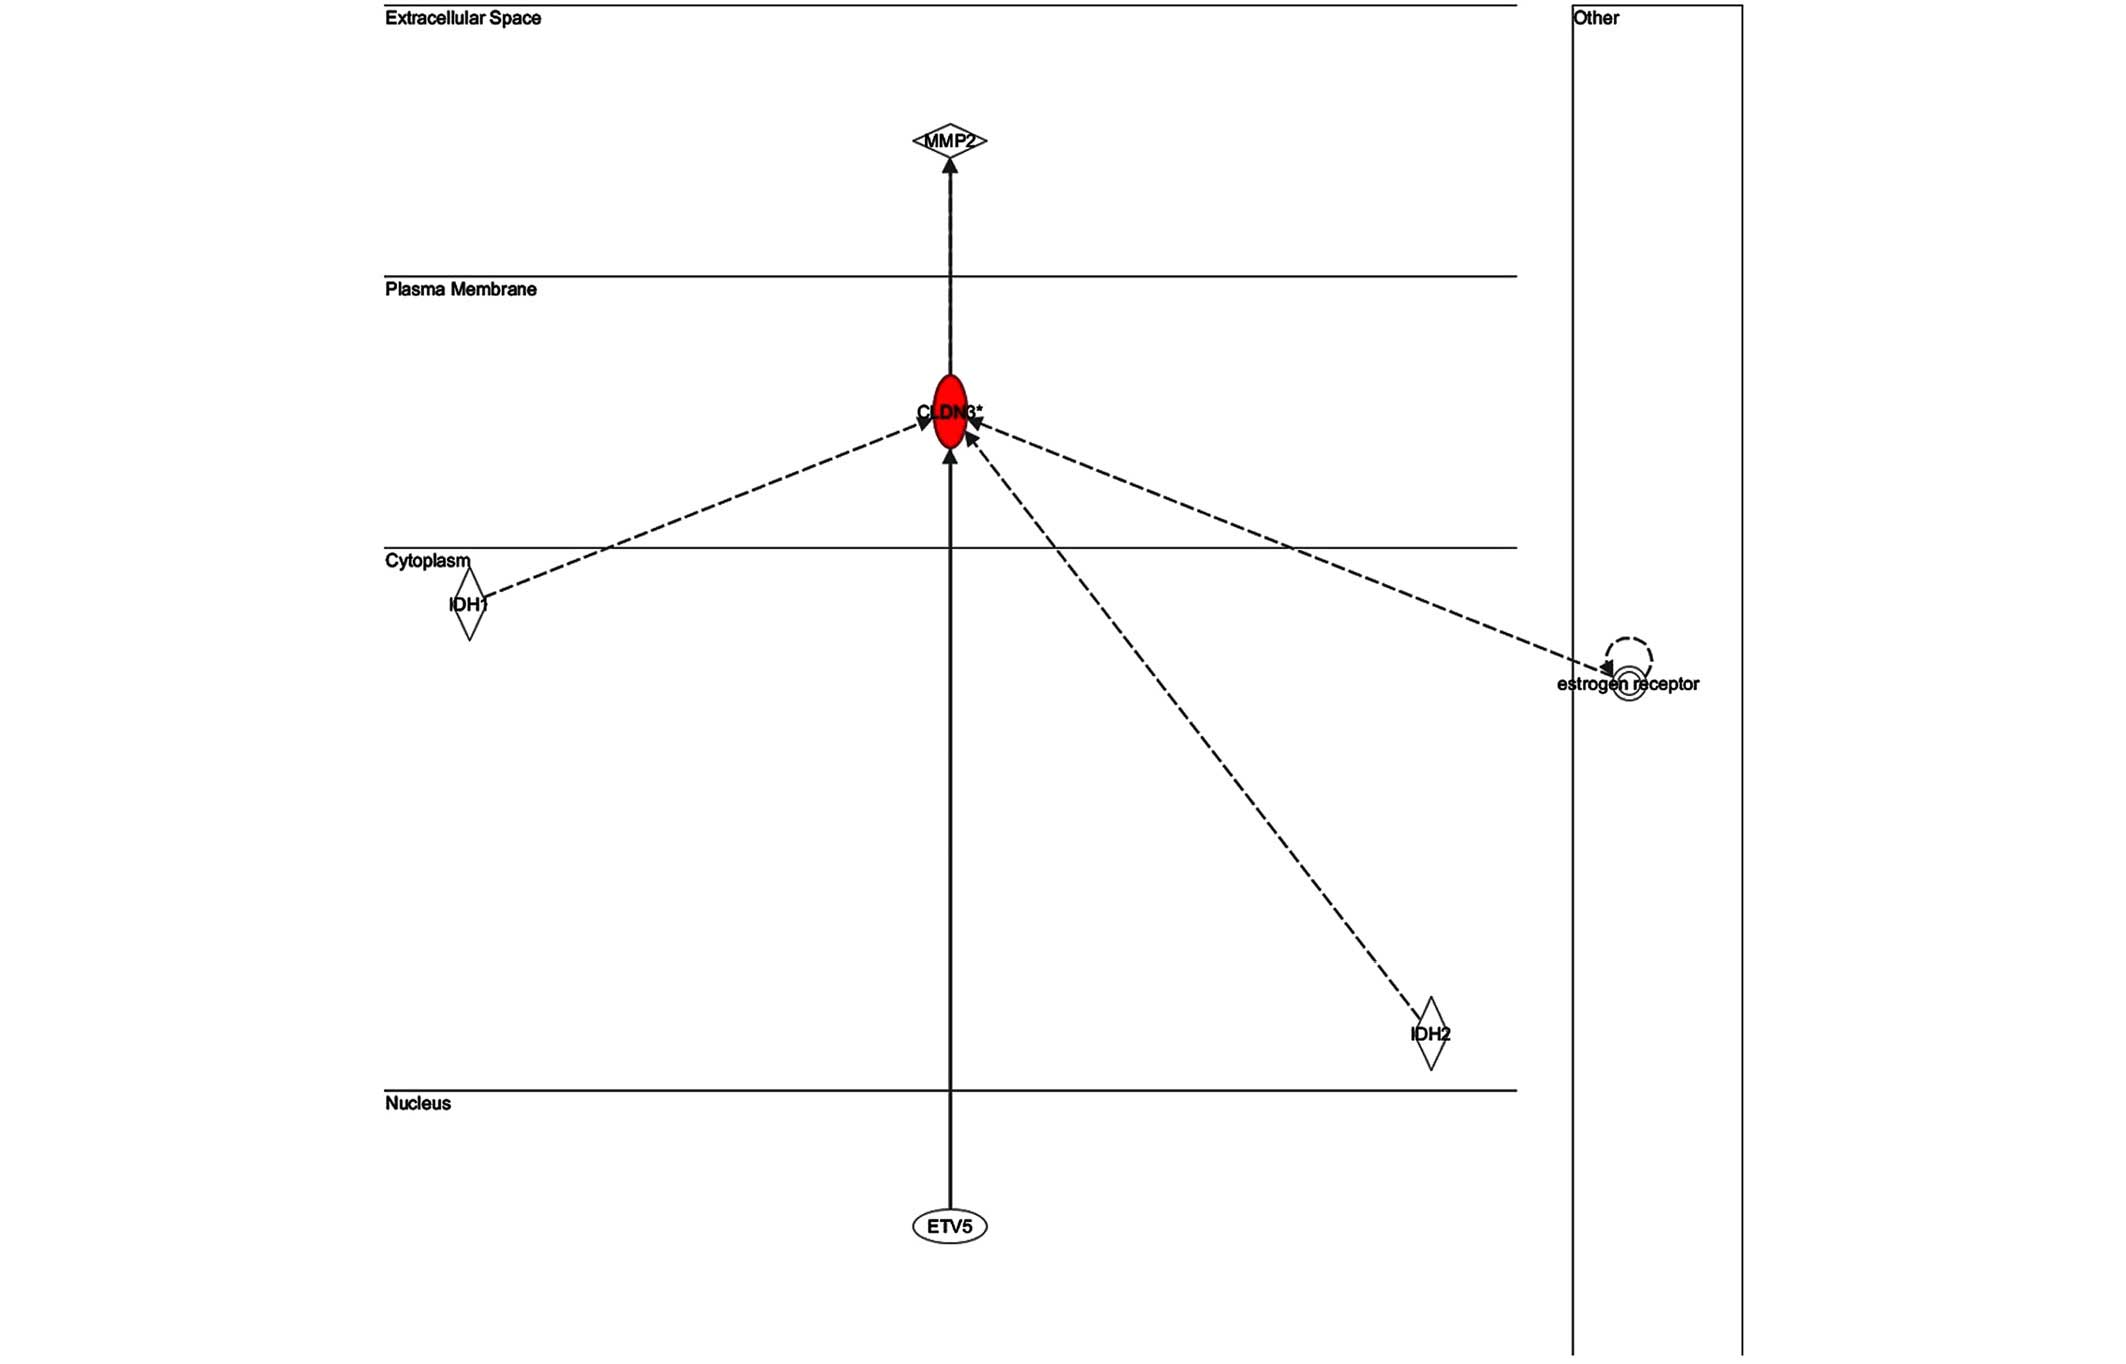
The key genes in network 1 (Fig. 3) were transforming growth factor-β
and matrix metalloproteinase (MMP)13; both of which are major genes
associated with inflammatory responses. There were only two genes
in network 2 (Fig. 4):
Retinol-binding protein 4 and adenylyl cyclase 6; both of which
have known roles in development, particularly embryonic, skeletal
and muscular, and so were unlikely to be associated with infection.
The key gene in network 3 (Fig. 5)
was claudin 3 (CLDN3); as in the case of network 2, this network is
predominantly associated with skeletal and muscular development,
and therefore has only a weak association with the infection. The
key gene in network 4 (Fig. 6) was
gem-associated protein 7, which is associated with cell death and
survival, and therefore may be associated with the late response to
M. bovis infection. The four networks of the pathways
comprising genes differentially expressed between 0 and 24 hpi are
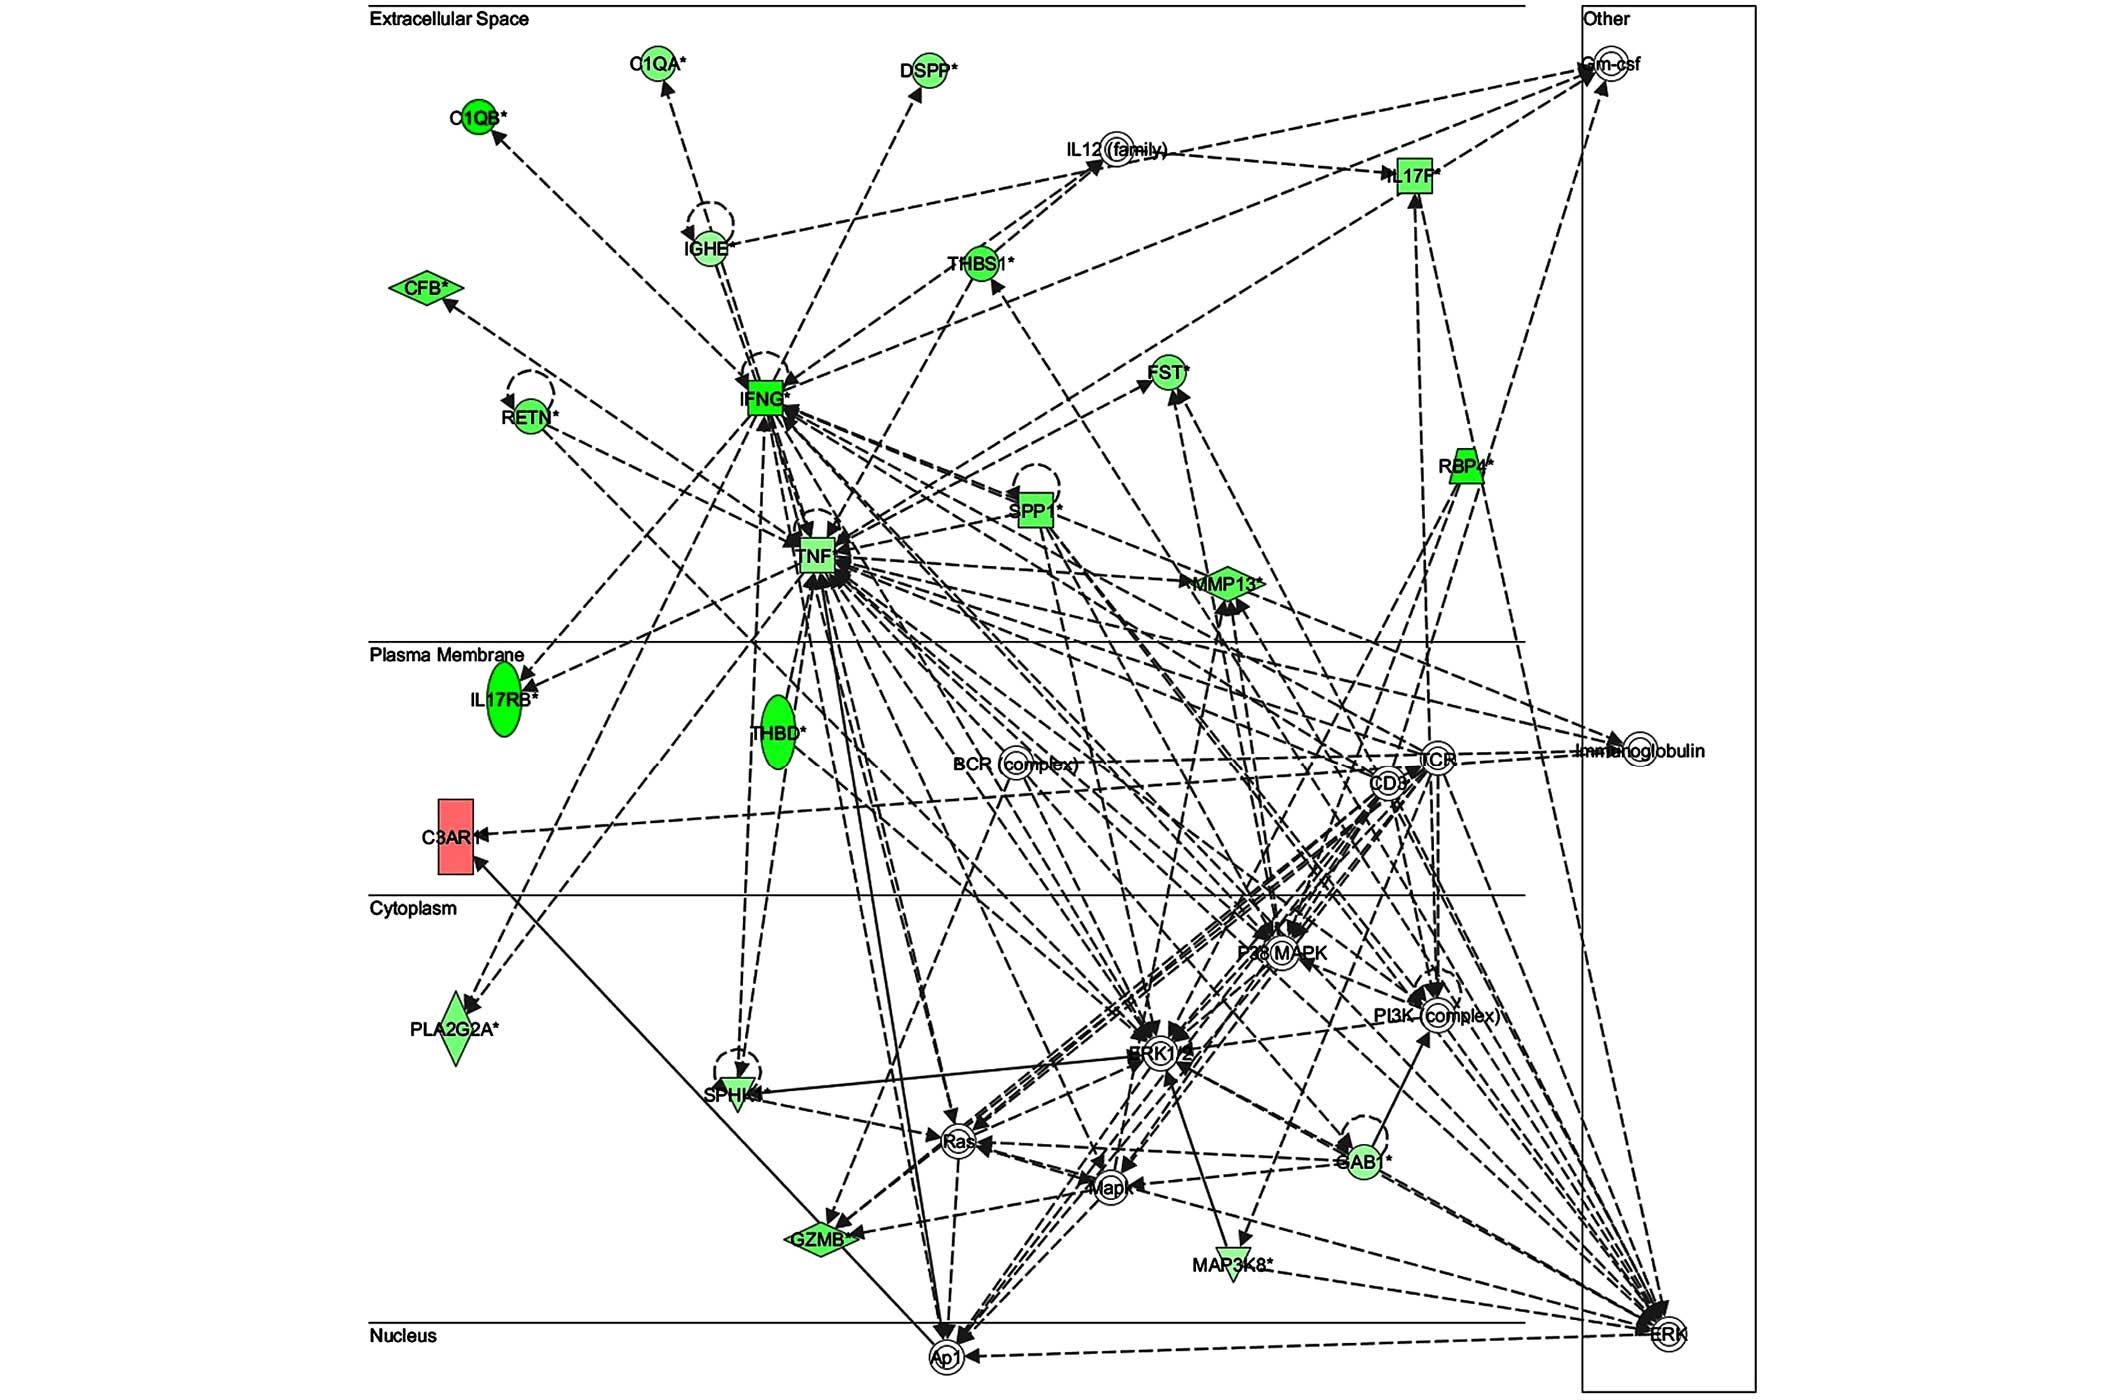
shown in Figs. 7–10. The key gene in network 1 was TNF-α,
which interacts with IFN-γ, MMP13, and thrombospondin 1 (THBS1)
(Fig. 7). Expression of these four
genes was downregulated. TNF-α also interacts with IL-17 receptor B
and thrombomodulin, both of which demonstrated downregulated
expression. In addition, TNF-α interacts with activating protein-1,
which upregulates complement component 3a receptor 1. The key genes
in network 2 were luteinizing hormone (LH) and IL-13. IL-13
upregulates C-type lectin domain family 4 member E, and
glycoprotein (transmembrane) nmb, and downregulates THBS1 and
androgen-induced 1 (Fig. 8). The key
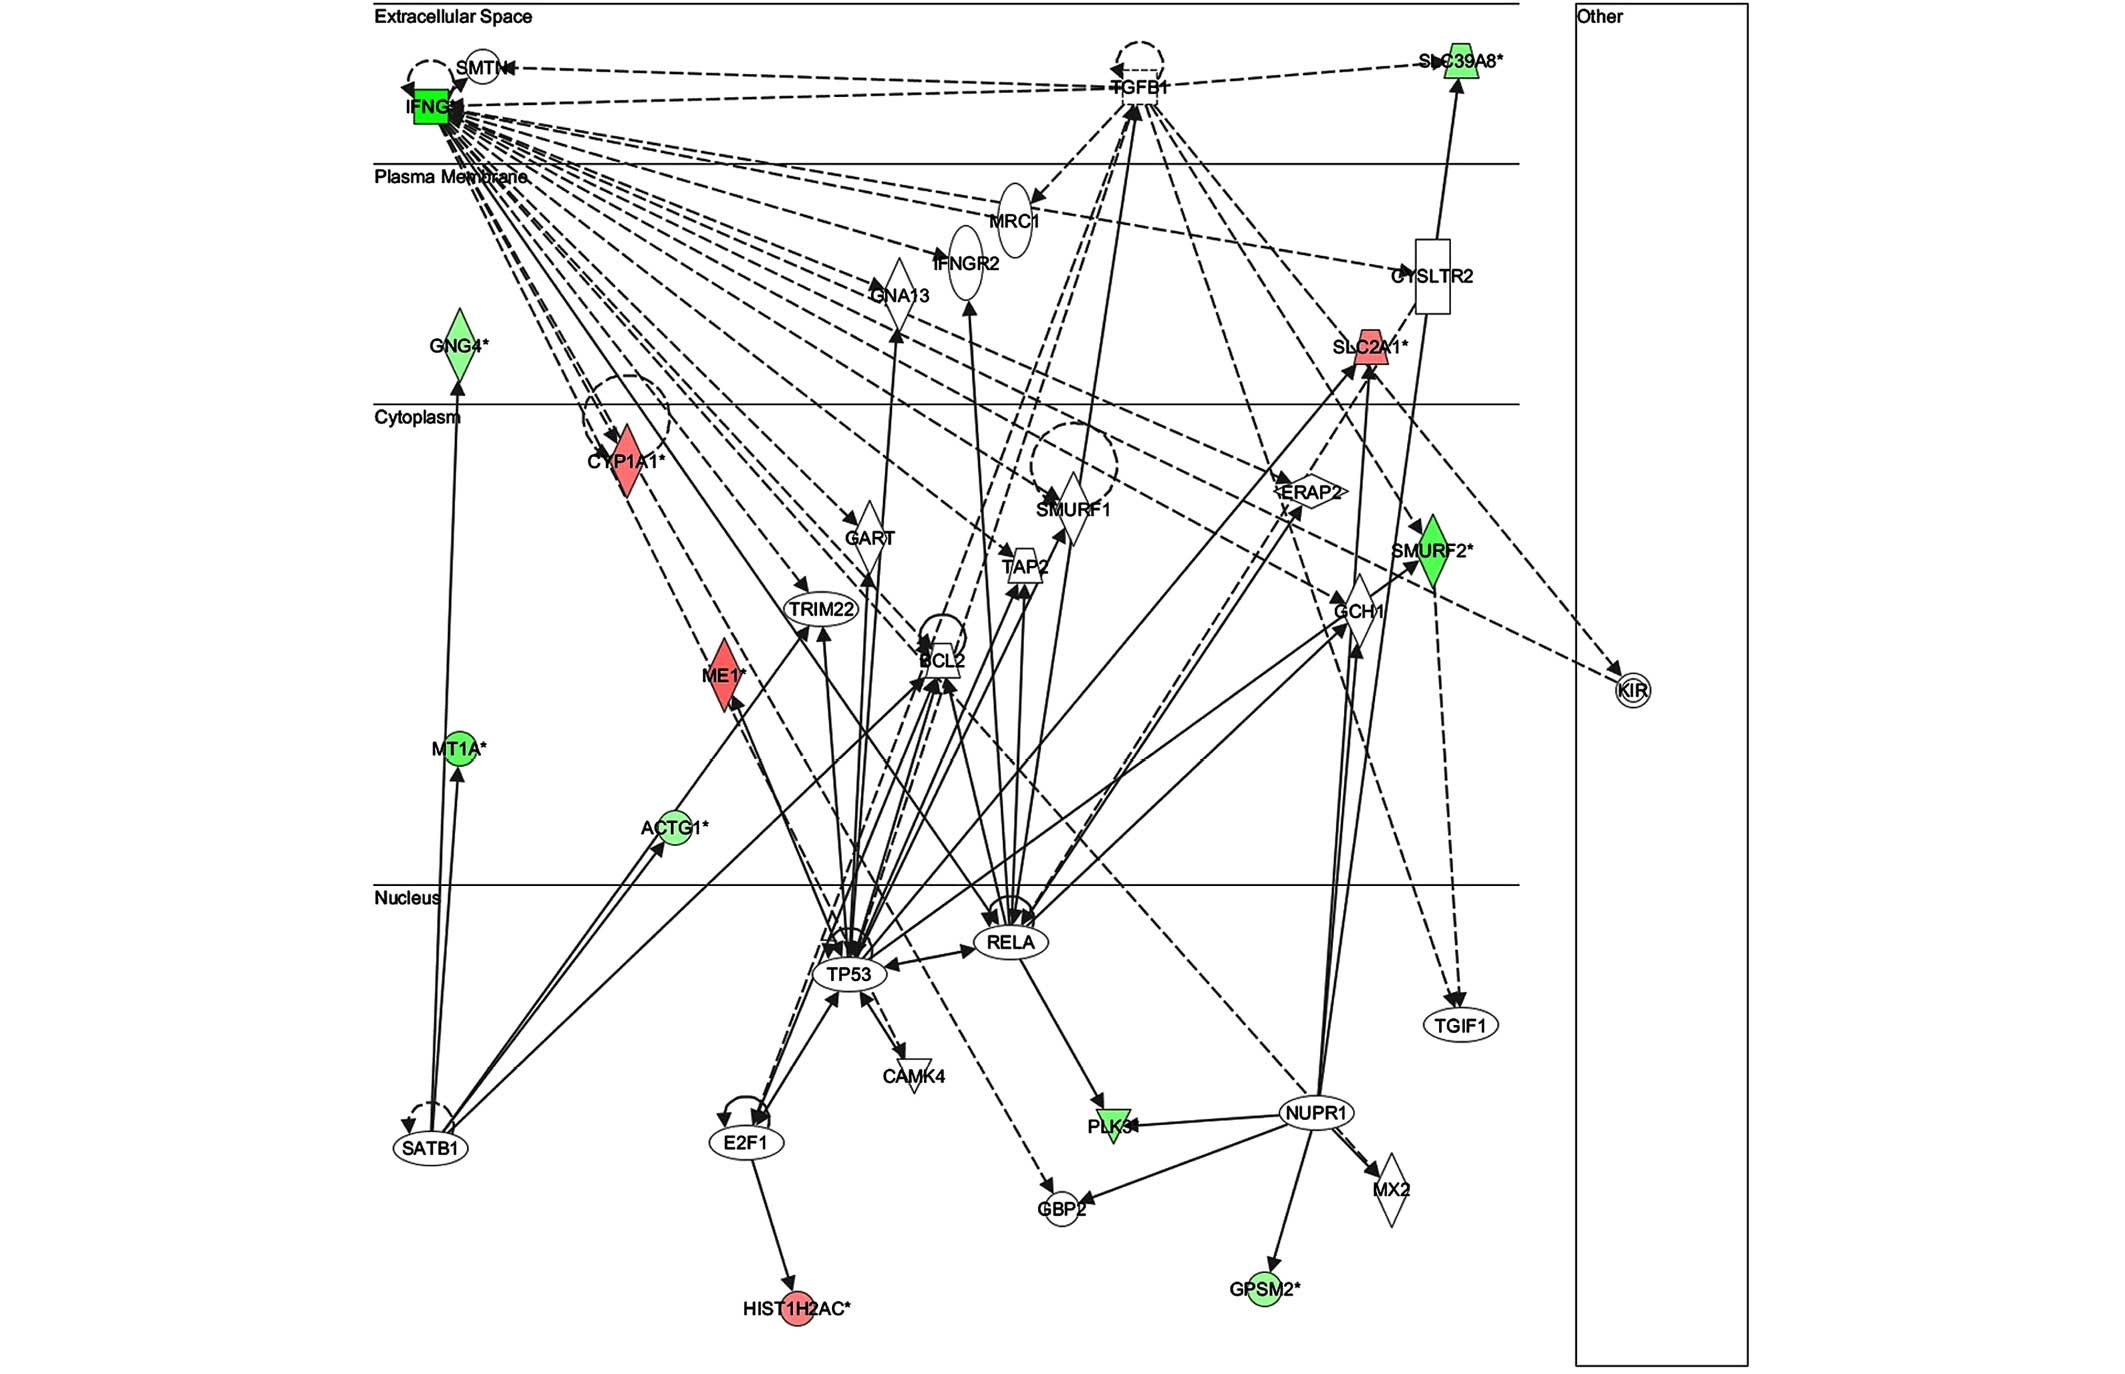
gene in network 3 was IFN-γ, which regulates the expression of
B-cell lymphoma-2 and the nuclear factor (NF)-κB p65 subunit
(Fig. 9). The key gene in network 4
was Akt, which regulates the expression of NF-κB, followed by the
downregulation of CCAAT/enhancer binding protein, delta (Fig. 10).
Discussion
The present study demonstrated that bovine PBMCs
responded to in vitro M. bovis infection by undergoing
large-scale alterations in gene expression. The expression of 420
genes was shown to significantly differ between 4 and 24 hpi, with
135 upregulated and 285 downregulated genes. Inspection of KEGG
pathway annotations for these genes demonstrated that the majority
was associated with the immune system, signal transduction, and
metabolism. Of the affected genes with immune system functions,
84.85% were downregulated. System pathway analysis of
differentially expressed genes revealed the key genes in four
different networks to be TNF-α, IFN-γ, LH, IL-13, and NF-κB. These
results suggested that M. bovis may suppress the PBMC immune
response soon after infection.
The number of differentially expressed PBMC genes
increased during the first 24 h following exposure to M.
bovis. Changes were observed in 207 unique probe sets at 4 hpi
and in 3,186 unique probe sets at 24 hpi. Of these, 420 genes
displayed significantly altered expression from 4 to 24 hpi, with
expression decreasing for 285 genes and increasing for 135 genes.
In addition, the fold-change in expression of the downregulated
genes was much greater, as compared with that of upregulated genes.
Previous studies of transcriptional responses to M. bovis
infection have reported downregulation of the majority of
differentially expressed genes (10,12,15,16). In
the present study, more genes were suppressed later post-infection
(24 h), as compared with earlier (4 h), suggesting the cellular
activities involving these genes progressively declined during
M. bovis infection.
Inspection of KEGG pathway annotations for the 420
differentially expressed genes revealed their involvement in the
immune system (28%), signal transduction (23%), metabolism (21%),
transport and catabolism (8%), genetic information processing (6%),
cell growth and death (6%), and other organismal systems (8%). Of
these genes, >67% (280) exhibited time-dependent decreases in
expression associated with signal transduction, immune response,
pro-inflammatory cytokines, metabolism, or cell death processes. In
addition, 84.85% of the differentially expressed genes associated
with immune responses displayed downregulated expression in
infected PBMCs. Suppression of host immune response genes is a
common finding among studies of gene expression following M.
bovis infection (6,12,16).
Transcriptome analysis of peripheral blood leukocytes from cattle
infected with M. bovis previously detected
over-representation of differentially expressed genes associated
with the immune response; of these genes, 64.5% showed decreased
expression, indicating M. bovis infection may be associated
with the suppression of host immune genes (12). Meade et al (16) reported a decrease in the in
vivo PBMC expression of key innate immune genes in M.
bovis-infected cattle. Subsequent in vivo
transcriptional studies of M. bovis-infected cattle
demonstrated that PBMC genes associated with immunity, inflammatory
responses, and apoptosis were among those with the highest
differential expression (10). These
in vivo experiments were conducted in animals following the
establishment of an infection, ranging from 2–12 months following
inoculation. The in vitro data of the present study supports
these findings and further reveals that changes in gene expression
begin very early in the course of infection.
Notably, M. bovis infection resulted in a
decrease in expression of the most important components of the
Th1 response: IFN-γ, TNF-α, and IL-12. The significance
of the altered expression of IFN-γ and TNF-α is demonstrated by
their mapping to key locations in the pathway networks. These genes
are crucial to the host immune response against mycobacteria,
including granuloma formation and apoptosis. Signaling via the
IFN-γ pathway is required for macrophage activation and granuloma
formation (5). Such signaling is
dependent on the production of IFN-γ by T-cells; and IFN-γ
synthesis requires the cytokine IL-12. Conversely, the observation
in the present study of decreased IFN-γ expression differs from a
previous study, which reported that the vaccine Mycobacterium
bovis bacillus Calmette-Guérin triggers a Th1-type
response (17). In addition, another
study reported the increased expression of IFN-γ in PBMC from
cattle infected 4 months previously (10). However, these studies observed that
genes downstream of IFN-γ were significantly downregulated,
suggesting suppression of IFN-γ signaling despite its increased
expression. Strain virulence, MOI, cell type, post-infection
harvest time, and specific assays used may also underlie these
different results.
Apoptosis of infected macrophages is an innate host
defense mechanism against intracellular M. bovis and M.
tuberculosis. The extrinsic cell death pathway involved in
apoptosis is induced by the binding of TNF-α to its receptor on the
macrophage surface. Macrophages infected with attenuated strains of
pathogenic mycobacteria undergo TNF-α-mediated apoptosis, reducing
the viability of intracellular bacilli. Virulent M.
tuberculosis strains have been found to suppress macrophage
apoptosis (18,19). Previous studies have detected
upregulation of programmed cell death signaling genes, including
TNF-α, following live M. bovis challenge of bovine
macrophages in vitro (6,20).
Therefore, it is intriguing that TNF-α was the key gene affected in
network 1. Through this network of pathways, TNF-α was shown to
interact with IFN-γ, MMP13, and THBS1.
The present study has numerous limitations. The
methods did not distinguish between M. bovis-infected cells
and M. bovis-exposed cells; therefore, no correlations can
be made between gene expression levels and infection rates. The
M. bovis cells were not from a standard strain; therefore,
some comparisons to other studies may be less reliable. In
addition, the present study does not provide further analysis of
specific genes indicated by the microarray data. However, the data
from this preliminary screening provide a solid foundation for
future investigations.
To the best of our knowledge, this is the first
study providing a time-course analysis of global gene expression in
bovine PBMCs following in vitro exposure to M. bovis.
Our data indicate that extensive alterations in PBMC gene
expression may begin early in infection. The majority of the
differentially expressed genes were related to immune responses and
cell survival. Changes observed in the expression of genes
associated with immune responses suggest that M. bovis
infection may be associated with the suppression of immune
response-related gene expression. In addition, M. bovis
infection in PBMCs may suppress apoptosis by interfering with TNF-α
signaling. The present study provides valuable information for the
further characterization of host responses to M. bovis
infection.
Acknowledgements
The present study was supported by a grant from the
Centers for Disease Control, Taiwan, the Republic of China.
References
|
1
|
Etter E, Donado P, Jori F, Caron A,
Goutard F and Roger F: Risk analysis and bovine tuberculosis, a
re-emerging zoonosis. Ann NY Acad Sci. 1081:61–73. 2006. View Article : Google Scholar : PubMed/NCBI
|
|
2
|
Neill SD, Pollock JM, Bryson DB and Hanna
J: Pathogenesis of Mycobacterium bovis infection in cattle. Vet
Microbiol. 40:41–52. 1994. View Article : Google Scholar : PubMed/NCBI
|
|
3
|
Kabara E, Kloss CC, Wilson M, Tempelman
RJ, Sreevatsan S, Janagama H and Coussens PM: A large-scale study
of differential gene expression in monocyte-derived macrophages
infected with several strains of Mycobacterium avium subspecies
paratuberculosis. Brief Funct Genomics. 9:220–237. 2010. View Article : Google Scholar : PubMed/NCBI
|
|
4
|
Kerrigan AM and Brown GD: Syk-coupled
C-type lectins in immunity. Trends Immunol. 32:151–156. 2011.
View Article : Google Scholar : PubMed/NCBI
|
|
5
|
Saunders BM and Britton WJ: Life and death
in the granuloma: Immunopathology of tuberculosis. Immunol Cell
Biol. 85:103–111. 2007. View Article : Google Scholar : PubMed/NCBI
|
|
6
|
Magee DA, Taraktsoglou M, Killick KE,
Nalpas NC, Browne JA, Park SD, Conlon KM, Lynn DJ, Hokamp K, Gordon
SV, et al: Global gene expression and systems biology analysis of
bovine monocyte-derived macrophages in response to in vitro
challenge with Mycobacterium bovis. PLoS One. 7:e320342012.
View Article : Google Scholar : PubMed/NCBI
|
|
7
|
Netea MG, Van der Meer JW and Kullberg BJ:
Toll-like receptors as an escape mechanism from the host defense.
Trends Microbiol. 12:484–488. 2004. View Article : Google Scholar : PubMed/NCBI
|
|
8
|
Behar SM, Divangahi M and Remold HG:
Evasion of innate immunity by Mycobacterium tuberculosis: Is death
an exit strategy? Nat Rev Microbiol. 8:668–674. 2010.PubMed/NCBI
|
|
9
|
Bovine Genome Sequencing and Analysis
Consortium. Elsik CG, Tellam RL, Worley KC, Gibbs RA, Muzny DM,
Weinstock GM, Adelson DL, Eichler EE, Elnitski L, et al: The genome
sequence of taurine cattle: A window to ruminant biology and
evolution. Science. 324:522–528. 2009. View Article : Google Scholar : PubMed/NCBI
|
|
10
|
Blanco FC, Soria M, Bianco MV and Bigi F:
Transcriptional response of peripheral blood mononuclear cells from
cattle infected with Mycobacterium bovis. PLoS One. 7:e410662012.
View Article : Google Scholar : PubMed/NCBI
|
|
11
|
Meade KG, Gormley E, O'Farrelly C, Park
SD, Costello E, Keane J, Zhao Y and MacHugh DE: Antigen stimulation
of peripheral blood mononuclear cells from Mycobacterium bovis
infected cattle yields evidence for a novel gene expression
program. BMC Genomics. 9:4472008. View Article : Google Scholar : PubMed/NCBI
|
|
12
|
Killick KE, Browne JA, Park SD, Magee DA,
Martin I, Meade KG, Gordon SV, Gormley E, O'Farrelly C, Hokamp K
and MacHugh DE: Genome-wide transcriptional profiling of peripheral
blood leukocytes from cattle infected with Mycobacterium bovis
reveals suppression of host immune genes. BMC Genomics. 12:6112011.
View Article : Google Scholar : PubMed/NCBI
|
|
13
|
Pollock JM and Neill SD: Mycobacterium
bovis infection and tuberculosis in cattle. Vet J. 163:115–127.
2002. View Article : Google Scholar : PubMed/NCBI
|
|
14
|
Aranaz A, Liébana E, Mateos A, Dominguez
L, Vidal D, Domingo M, Gonzolez O, Rodriguez-Ferri EF, Bunschoten
AE, Van Embden JD and Cousins D: Spacer oligonucleotide typing of
Mycobacterium bovis strains from cattle and other animals: A tool
for studying epidemiology of tuberculosis. J Clin Microbiol.
34:2734–2740. 1996.PubMed/NCBI
|
|
15
|
Meade KG, Gormley E, Park SD, Fitzsimons
T, Rosa GJ, Costello E, Keane J, Coussens PM and MacHugh DE: Gene
expression profiling of peripheral blood mononuclear cells (PBMC)
from Mycobacterium bovis infected cattle after in vitro antigenic
stimulation with purified protein derivative of tuberculin (PPD).
Vet Immunol Immunopathol. 113:73–89. 2006. View Article : Google Scholar : PubMed/NCBI
|
|
16
|
Meade KG, Gormley E, Doyle MB, Fitzsimons
T, O'Farrelly C, Costello E, Keane J, Zhao Y and MacHugh DE: Innate
gene repression associated with Mycobacterium bovis infection in
cattle: Toward a gene signature of disease. BMC Genomics.
8:4002007. View Article : Google Scholar : PubMed/NCBI
|
|
17
|
Marchant A, Goetghebuer T, Ota MO, Wolfe
I, Ceesay SJ, De Groote D, Corrah T, Bennett S, Wheeler J, Huygen
K, et al: Newborns develop a Th1-type immune response to
Mycobacterium bovis bacillus Calmette-Guérin vaccination. J
Immunol. 163:2249–2255. 1999.PubMed/NCBI
|
|
18
|
Divangahi M, Chen M, Gan H, Desjardins D,
Hickman TT, Lee DM, Fortune S, Behar SM and Remold HG:
Mycobacterium tuberculosis evades macrophage defenses by inhibiting
plasma membrane repair. Nat Immunol. 10:899–906. 2009. View Article : Google Scholar : PubMed/NCBI
|
|
19
|
Lee J, Remold HG, Ieong MH and Kornfeld H:
Macrophage apoptosis in response to high intracellular burden of
Mycobacterium tuberculosis is mediated by a novel
caspase-independent pathway. J Immunol. 176:4267–4274. 2006.
View Article : Google Scholar : PubMed/NCBI
|
|
20
|
Widdison S, Watson M and Coffey TJ: Early
response of bovine alveolar macrophages to infection with live and
heat-killed Mycobacterium bovis. Dev Comp Immunol. 35:580–591.
2011. View Article : Google Scholar : PubMed/NCBI
|