Introduction
Preoperative acute hypervolemic hemodilution (AHHD)
has been recommended as a cost-effective method of conserving
blood, which aims to avoid or reduce homologous blood transfusion
during surgical procedures (1). AHHD
was administered through fast infusion of crystalloid or colloids,
which is commonly 20–30% of blood volume after anesthesia. The
degree of hemodilution depends on the extent of the capacity of the
blood vessels' dilation (1). Fluid
dynamics showed that the volume expansion rate of AHHD can be
improved after anesthesia inducing vascular dilation; or according
to the Starling Rule, most of the infused fluid is transferred into
the extravascular space, decreasing the volume expansion rate and
at the same time posing a risk for interstitial edema (2). Propofol is frequently used for general
anesthesia due to its rapid onset and short-acting efficacy
(2). Previous studies have found
that changes in blood volume, regional organ blood flow, blood
chemistry, body fluid distribution and hemodynamics (3–7) can
alter the pharmacokinetic and pharmacodynamic profile of propofol
(8,9). In addition, studies have indicated that
hemodilution can increase the hypnotic potency of propofol in
humans as a result of a significant increase in the unbound
propofol plasma concentration and an increased cardiac output
causing changes in compartment volumes and drug delivery to the
effect-site (10,11). Other studies, however, have found the
opposite (9,12). The aim of the present study was to
determine the effect of AHHD on the EC50 of propofol at
loss of consciousness (LOC) and return of consciousness (ROC) in
patients under combined propofol general and epidural anesthesia.
The primary objective was to determine the EC50 at the
times of LOC and ROC, as well as the dose requirement of propofol,
whereas the secondary objective was to determine the LOC and ROC
times during the induction and recovery of anesthesia, with or
without AHHD.
Patients and methods
Patient recruitment
This study was approved by the Ethics Committee of
the First Affiliated Hospital of the College of Medicine (Zhejiang,
China) and written informed consent was obtained from each patient.
The inclusion criteria were patients with American Society of
Anesthesiologists classification I, aged 20–40 years and undergoing
elective hip arthroplasty surgery. The exclusion criteria were a
body mass index of <18 or >26 kg/m2, medical
conditions that could affect consciousness levels, such as stroke,
stupor or dementia, patients with cardiac or respiratory diseases,
abnormalities of hepatic or renal function or hypertension. None of
the patients suffered any disease or had received sedative or
opioid drugs recently. Those with anemia (hemoglobin concentration
<12 g/dl), bleeding diathesis, hypersensitivity to amide local
anesthetics, previous lumbar surgery and chronic back pain were
also excluded. The patient characteristics are shown in Table I. The subjects were randomly assigned
to either the control group (n=20) or the AHHD group (n=20).
Randomization was performed by the statistician according to a
random number generated by the computer. Following randomization,
an opaque, sealed, sequentially numbered envelope containing the
regimen of anesthesia and fluid was prepared for each participant
according to the study protocol.
 | Table I.Baseline patient characteristics. |
Table I.
Baseline patient characteristics.
| Characteristic | AHHD group, n=20 | Control group,
n=20 | P-value |
|---|
| Male/female, n/n | 9/11 |
10/10 | 1.000 |
| Agea, years | 33±5 | 32±7 | 0.500 |
| Weighta, kg |
59±10 |
61±11 | 0.600 |
| Heighta, cm | 164±7 | 166±8 | 0.433 |
| BMIa, kg/m2 |
21.9±3.0 |
22.1±3.0 | 0.874 |
| Maximum cephalad
level of analgesia |
T10(T9-T11) | T10
(T9-T11) | 0.717 |
Procedures
The patients were not premedicated prior to
anesthesia. On arrival in the operating theater, a catheter was
inserted in the radial artery to enable the continuous monitoring
of arterial blood pressure and for sample collection. One
intravenous cannula was inserted into a large forearm vein for the
infusion of anesthetics and fluid.
Once all the monitoring devices had been connected,
the patients were arranged in the left lateral decubitus position,
and an epidural catheter was inserted through a 17-gauge Tuohy
needle (Zhejiang Haisheng Medical Device Co. Ltd., Shaoxing, China)
at L2-L3 and advanced 3–4 cm. Once the
catheter had been aspirated to confirm that the placement was not
intrathecal or intravenous (IV), the catheter was secured and the
patients were returned to a supine position. A total of 3 ml
lidocaine solution (2%; Shanxi Jinxin Shuanghe Pharmaceutical Co.
Ltd., Jinxin, China) was injected through an epidural catheter as a
test dose. Five minutes later, 15 ml ropivacaine (Naropin®;
AstraZeneca, Sodertalje, Sweden) without epinephrine was
administered slowly through the catheter at a rate of 1 ml/sec. The
AHHD patients were given a loading dose of 10 ml/kg Ringer's
solution (Pharmacia, Shanghai, China) over 20 min, at the same time
as the epidural test dose. This infusion was followed by 6%
hydroxyethyl starch 130/0.4 (Fresenius SE & Co. KGaA, Bad
Homburg, Germany) over a period of 30 min. To simulate the
conditions of the AHHD group prior to the induction of anesthesia
to the greatest extent possible, patients in the control group were
placed in identical ambient conditions and evenly infused with ~5
ml/kg lactated Ringer's solution via a cubital vein cannula
During the study, electrocardiograms, invasive
arterial blood pressure, pulse oxygen saturation and partial
pressure of end-tidal carbon dioxide were continuously monitored.
The patients received oxygen through facemasks at a flow rate of 3
l/min. When a patient suffered dyspnea, appropriate respiratory
support was supplied. Hypotension was defined as a reduction in
systolic blood pressure by >30% of the pre-anesthetic value or a
systolic blood pressure of <90 mmHg. Patients with hypotension
received treatment of 6 mg IV ephedrine. Bradycardia was defined as
a heart rate (HR) of <55 bpm and was treated by administering
0.5 mg IV atropine. Hematocrit (Hct) and hemoglobin concentration
values were determined with a blood i-STAT analyzer (i-STAT Corp.,
East Windsor, NJ, USA) prior to and during the study. Total plasma
protein and albumin were also measured with an automatic
biochemical analyzer (Hitachi 7600; Hitachi Co. Ltd., Tokyo, Japan)
in the First Affiliated Hospital College of Medicine (Zhejiang,
China) central laboratory.
Following infusion, a target-controlled infusion
(TCI) of propofol was administered to all patients using a
Diprifusor TCI pump (Graseby 3500 pump; Graseby Medical Ltd.,
Watford, UK), incorporating a three-compartment pharmacokinetic
algorithm of the Marsh pharmacokinetic model (13). This system shows the predicted blood
and effect-site (an estimate of the drug concentration at its site
of action) propofol concentrations. Subsequent to entering the age,
weight and gender of the patient, the TCI was started to achieve a
target plasma concentration of propofol of 1.5 µg/ml. The plasma
concentration was selected rather than the effect-site
concentration TCI, as the propofol plasma concentration
equilibration with the hypothetical effect-site compartment
predicted by the Diprifusor was likely to have required 10 min. The
target concentration was increased in increments of 0.5 µg/ml every
30 sec until LOC occurred, and the target concentration was then
set to zero to discontinue the infusion; however the Diprifusor
remained switched on. The time to ROC following the discontinuation
of the infusion was determined by the response to the name of the
patient being loudly called at 30-sec intervals. The time to LOC,
predicted plasma and effect-site propofol concentrations and
propofol dose requirements for LOC were recorded. Following the
discontinuation of the infusion, the ROC time and predicted plasma
and effect-site concentrations of propofol at ROC were recorded. On
completion of the ROC evaluation, analgesia was assessed
bilaterally in the anterior axillary line by pinpricking using a
short beveled 25-gauge needle. Analgesia was defined as the
inability to detect a sharp pinprick. The maximum cephalad level of
analgesia (peak analgesia level) was then recorded for all
patients.
Study design
When a patient was recruited according to the
inclusion criteria, the statistician distributed an opaque, sealed,
sequentially numbered envelope to the anesthesiologist in the
trials the day before the study, which contained the regimen of
anesthesia and the fluid. Both the anesthesiologist and
investigator were blinded to the regimen of the experiment for the
specific patients. All of the patients and the personnel involved,
including the study designer, investigator and statistician, were
unaware of the subject assignments until the data analysis was
complete.
Statistical analysis
Quantitative variables are presented as the mean ±
standard deviation or median with interquartile range. Categorical
variables were analyzed using χ2 or Fisher exact tests.
Continuous variables were assessed with the Mann-Whitney U or
Student t-tests depending on the distribution of the data.
Repeated measures analysis of variance was used to compare the
difference between the times in the two groups. A P-value of
<0.05 was considered to indicate a statistically significant
difference and was adjusted for multiple comparisons when
appropriate. A quantal response model (probit analysis) was used to
calculate the EC0.5, EC50 and EC95
at each endpoint based on the predicted plasma and effect-site
propofol concentrations. The following software packages were used
to perform the analysis: Excel 2000 (Microsoft Corp., Redmond, MA,
USA) and SPSS software version 10.0 (SPSS, Inc., Chicago, IL, USA).
Since the EC50 changes of propofol at the time of LOC
during AHHD had not been previously examined, a convenient sample
size of 20 patients was selected. The statistically significant
decline in the value of the EC50 of propofol at LOC
indicated that the present study was adequately powered.
Results
Patient characteristics and laboratory
parameters
No statistically significant differences were found
between the two groups in terms of age, body weight, height or
maximum cephalad level of analgesia. In the AHHD group the Hct
levels and hemoglobin concentration decreased from 39 to 31% and
from 133.2 to 104.1 g/l, respectively. Compared with the
preoperative values, the postoperative levels of hemoglobin, Hct,
total protein and albumin were found to have decreased
significantly in the AHHD patients but were observed to have
remained stable in the control group. Significant differences in
the hemoglobin, Hct, total protein and albumin levels were found
between the two groups following the AHHD (Table II).
| Table II.Laboratory parameters of patients in
the AHHD and control groups before and after AHHD. |
Table II.
Laboratory parameters of patients in
the AHHD and control groups before and after AHHD.
| Parameter | Before AHHD | After AHHD |
|---|
| Hemodilution
group |
|
|
| Hb
(g/l) | 133.2±17.8 |
104.1±15.7a,b |
| Hct
(%) | 39±5 | 31±1a,b |
| TPP
(g/l) | 70.7±5.2 |
53.0±6.4a,b |
| Alb
(g/l) | 45.4±3.4 |
34.7±3.5a,b |
| Control group |
|
|
| Hb
(g/l) | 126.7±14.6 | 122.9±16.1 |
| Hct
(%) | 37±4 | 36±5 |
| TPP
(g/l) | 69.8±7.9 | 67.4±8.1 |
| Alb
(g/l) | 43.9±4.9 | 42.1±4.3 |
Primary objectives
Compared with the controls, the predicted plasma and
effect-site concentrations of propofol in the AHHD patients at LOC
were higher, resulting in higher EC50 values (P=0.001
and 0.025, respectively; Table
III). At ROC, the effect-site EC50 was 2.9 µg/ml
[95% confidence interval (CI), 2.8–3.0] in the AHHD patients and
2.5 µg/ml (95% CI, 2.2–2.6) in the control patients (P=0.001;
Table IV); however, no significant
difference was observed between the AHHD and control patients in
predicted blood EC50 (P=0.066; Table IV).
| Table III.Propofol concentration at the time of
LOC and LOC time. |
Table III.
Propofol concentration at the time of
LOC and LOC time.
| Parameter | Hemodilution group,
n=20 | Control group,
n=20 |
|---|
| Predicted blood
concentration, µg/ml |
|
|
|
EC0.5 | 4.4 (3.9–4.7) | 4.0 (3.3–4.3) |
|
EC50 | 5.4
(5.1–5.6)a | 4.8 (4.5–5.0) |
|
EC95 | 6.6
(6.3–7.1)b | 5.8 (5.5–6.6) |
| Effect-site
concentration, µg/ml |
|
|
|
EC0.5 | 1.8 (1.4–2.0) | 1.5 (1.1–1.7) |
|
EC50 | 2.5
(2.2–2.6)b | 2.1 (1.9–2.3) |
|
EC95 | 3.5
(3.3–3.9)b | 3.0 (2.8–3.5) |
| Propofol
requirements at LOC, mg/kg |
2.1±0.4b | 1.8±0.4 |
| LOC time, min |
4.2±0.8b | 3.6±1.0 |
| Table IV.Propofol concentration at the time of
ROC and ROC time. |
Table IV.
Propofol concentration at the time of
ROC and ROC time.
| Parameter | Hemodilution group,
n=20 | Control group,
n=20 |
|---|
| Predicted blood
concentration, µg/ml |
|
|
|
EC0.5 | 1.5 (1.2–1.7) | 1.4 (1.0–1.6) |
|
EC50 | 2.2 (2.0–2.3) | 2.0 (1.8–2.1) |
|
EC95 | 3.2 (2.9–3.6) | 2.9 (2.6–3.3) |
| Effect-site
concentration, µg/ml |
|
|
|
EC0.5 | 2.2 (1.9–2.4) | 1.9 (1.4–2.1) |
|
EC50 | 2.9
(2.8–3.0)a | 2.5 (2.2–2.6) |
|
EC95 | 3.8
(3.6–4.2)b | 3.3 (3.1–3.7) |
| ROC time, min |
4.0±1.3 |
3.4±1.0 |
Secondary objectives
The LOC time was significantly longer (4.2 min for
the AHHD patients and 3.6 min for the controls, P=0.04) and the
propofol requirement was significantly higher (2.1 mg/kg for the
AHHD patients and 1.8 mg/kg for the controls, P=0.008) in the AHHD
group compared with the control group (Table III); however, no significant
difference was found between the two groups with regard to the ROC
time (4.0 min for AHHD patients and 3.4 min for the controls,
P=0.08).
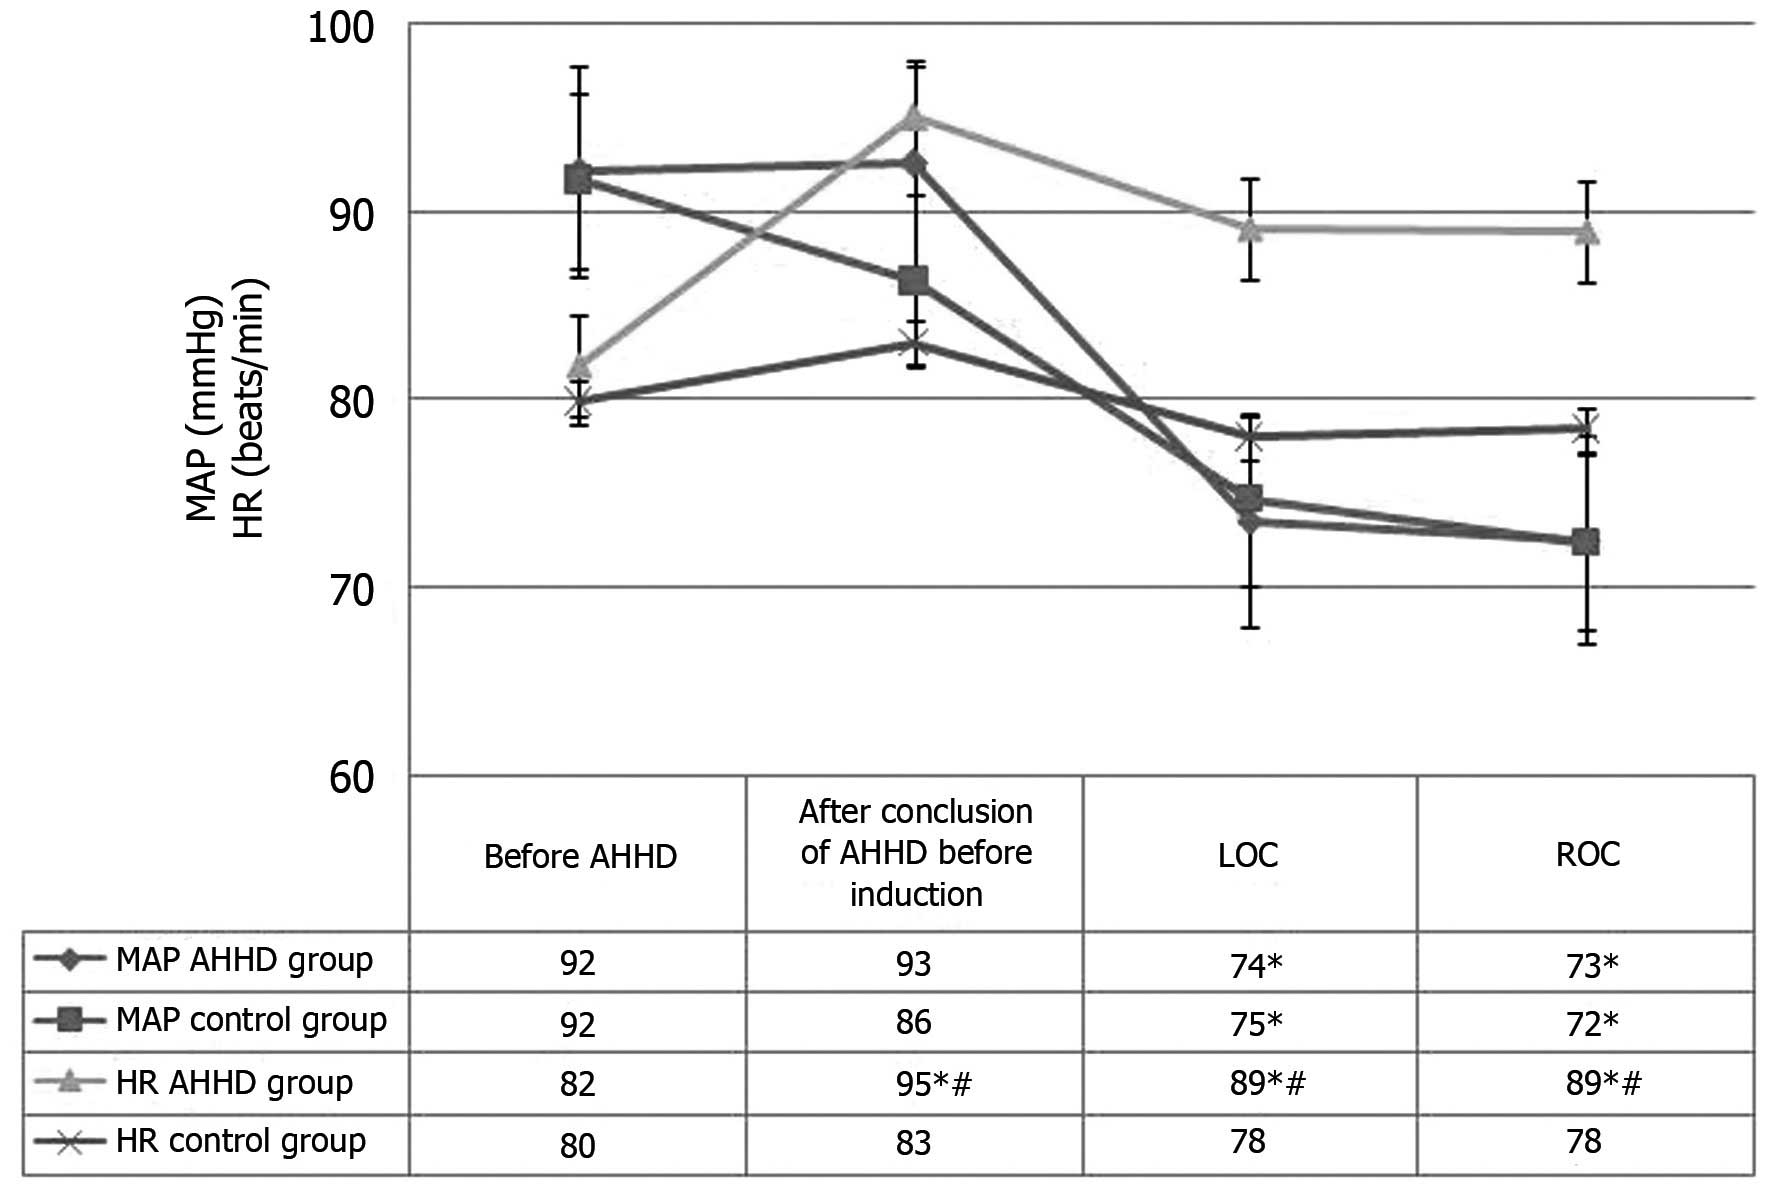
HR and blood pressure
A significant difference in HR was found between the
AHHD and control groups at the post-AHHD, LOC and ROC time-points,
with significantly higher values in the AHHD group. By contrast,
the blood pressure values were comparable between the two groups
(Fig. 1).
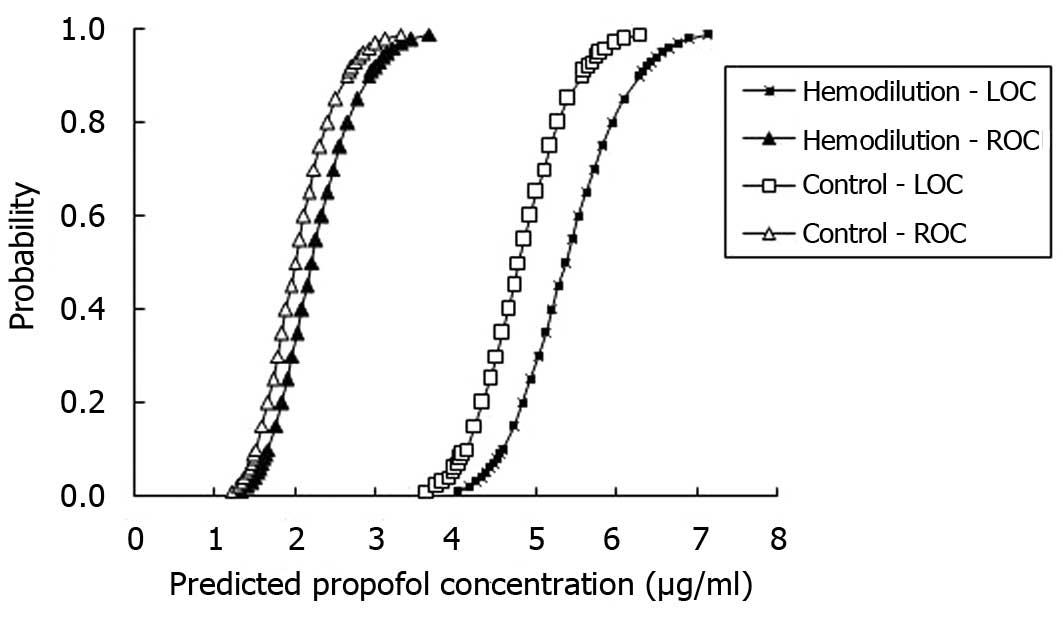
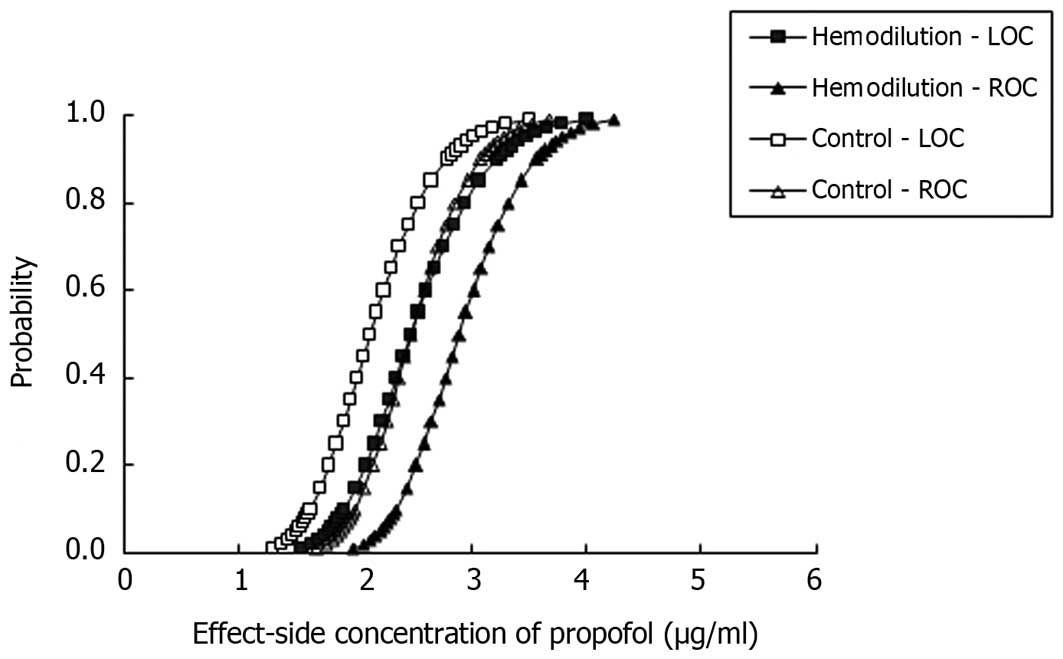
Propofol potency
As shown in Figs. 2
and 3, the curves for the
probability of LOC and ROC versus the predicted blood and
effect-site propofol concentrations were shifted to the right in a
parallel fashion for the AHHD group, which indicated that the
potency of propofol was decreased in patients undergoing AHHD.
Discussion
To the best of our knowledge, the present study is
the first to investigate the effect of AHHD of 6% hydroxyethyl
starch 130/0.4 on the EC50 of propofol in patients
during the induction of anesthesia using a TCI technique at the two
clinical endpoints of LOC and ROC. In this study, the effect-site
EC50 of propofol at LOC and ROC in patients undergoing
hemodilution was increased by 19 and 16%, respectively, compared
with the controls. The data also showed that, compared with the
control group, the LOC time was significantly longer and the
propofol requirement was significantly higher in the hemodilution
group, indicating a significant reduction in propofol potency with
AHHD. It is possible that the greater propofol requirement with
AHHD was due to the markedly increased blood volumes associated
with acute colloidal solutions of 6% hydroxyethyl starch 130/0.4.
In the present study, the Hct in the AHHD group decreased to a
level of 25–40% following the infusion of 6% hydroxyethyl starch
130/0.4 at a rate of 20 ml/kg over a period of 30 min. Kumar et
al (14) demonstrated that
hypervolemic haemodilution caused a reduction in the level of Hct
to ~30% following the infusion of 20 ml/kg gelofusine (4%), which
was consistent with the finding in the present study. The half-life
of 6% hydroxyethyl starch 130/0.4 is 4–6 h, and the starch can
maintain the state of hemodilution for a long duration. During
hemodilution, the blood viscosity is decreased and the cardiac
output and velocity of blood flow are increased; thus, the
distribution of drugs from the blood (the central compartment) to
the peripheral tissues, including the tissues with a rich blood
supply (shallow peripheral compartment) and the tissues with an
inadequate blood supply (deep peripheral compartment) is greater
than that from the peripheral compartment to the central
compartment. Consequently, the amount of drug delivered to the
brain (effect-site) is relatively small, leading to a reduction in
the propofol sedation/hypnotic effect (12). As a result, the increase in the
distribution of propofol during hemodilution causes the reduction
in the propofol concentration in the plasma. The propofol dose
should therefore be increased to achieve the same depth of
sedation/anesthesia.
Another relevant factor is that hemodilution is
considered to cause a higher plasma clearance of propofol, which is
associated with a lower plasma concentration of propofol (15). Propofol is mainly metabolized through
the liver, and most propofol metabolites are cleared through the
kidneys. As is well known, such factors as the hepatic blood
supply, drug uptake rate and the activity of liver metabolic
enzymes determine the propofol hepatic metabolism. Hypervolemic
hemodilution resulted in an augmentation of the blood volume,
thereby increasing the flow of blood to the liver, and then
consequently increasing the hepatic metabolism of propofol. By
contrast, propofol reduces cardiac output and liver perfusion
(16,17). Previous studies have indicated that,
during the induction of anesthesia with propofol, liver blood flow
is increased or remains unaltered (18,19). In
2001, Nollert et al (20)
showed in a pig study that both liver blood flow and Hct were
independent of influential factors of hepatic metabolism function.
Furthermore, Tang et al (12)
reported that the whole-body clearance and elimination-rate
constant of propofol were decreased significantly in the
hemodilution group. The present study showed that the LOC time was
significantly prolonged in the AHHD group, which may have been
associated with the aforementioned factors. Propofol is a highly
fat-soluble intravenous anesthetic that is generally found in
combination with plasma proteins, with a combination rate as high
as 96–98% and only a small amount of propofol existing in the free
form (21). The activity of drugs
depends on the degree of integration with the plasma protein, as
only free drugs are active; therefore, AHHD will have a far greater
impact on the effect of drugs exhibiting a high degree of plasma
protein binding. For intravenous and liver enzyme unrestricted
drugs, an increased non-associative fraction will not affect the
whole-body clearance, due to the high removal efficiency of the
drug; this means that the protein-binding rate does not restrict
their clearance. On the contrary, for the liver enzyme restricted
drugs, an increase in the unconjugated drug therefore gives rise to
a short, even, persistent rise in the concentration of unconjugated
drug in the plasma, which has important clinical significance for
drugs such as propofol with a narrow therapeutic window (22). In the present study, the total plasma
protein and albumin levels were both lower in the AHHD group than
those in the control group following AHHD, with decreases of 25 and
22%, respectively. Therefore, the unbound fraction and
concentration of propofol increased in the plasma during
hemodilution, which could have resulted in an enhanced effect of
propofol. Previous studies have demonstrated that the potency of
muscle relaxants is increased during AHHD, which is likely due to
the reduction in plasma protein conjugation and an increase in the
free-drug concentration (23,24). In
the current study, during the period of hemodilution, the impact of
the increase in plasma distribution and clearance overcame the
impact of the increase in free drug concentration on the hypnotic
effects of propofol.
In contrast to the findings in the present study,
Dahaba et al (25) showed
that the hypnotic potency of propofol was increased and the LOC
time was short in hemodilution patients. The removal of blood
during the hemodilution may be one of the reasons for the two
inconsistent results. In the study by Dahaba et al (25), hypovolemia was achieved by
bloodletting 20 ml/kg and then inputting the same volume of 6%
hydroxyethyl starch 130/0.4 in 0.9% NaCl. In the present study
there was no bloodletting prior to hemodilution; however, patients
were administered an equal quantity of 6% hydroxyethyl starch
130/0.4 in 0.9% NaCl. As a result, the concentration of plasma
protein decreased due to dilution without plasma protein loss.
Thus, the total plasma protein remained unchanged, and the total
combined propofol in the plasma was also unchanged. It is
considered likely that the concentration of the unbound drug did
not change the hypnotic potency of propofol.
Previous studies that have investigated the effect
of cardiac output on the plasma drug concentration of propofol have
shown that cardiac output is inversely proportional to the plasma
concentration of propofol (26–28). The
present study found that the HR increased by 16% compared with that
prior to hemodilution, and the mean arterial pressure (MAP)
remained unchanged. Following the induction of anesthesia in the
AHHD group, the HR increased by 14%, with no change in the MAP,
compared with the control group. Therefore, it can be inferred that
the propofol plasma concentrations were decreased during AHHD.
It must be emphasized that the aforementioned
EC50 values of this study were based on the calculated
plasma and effect-site concentrations of propofol by the
pharmacokinetic models installed in the TCI machine. Although a
previous study showed that the pharmacokinetics of propofol could
be changed by hemodilution (8), the
determination of the blood drug concentration of propofol was not
performed in the present study, as the TCI device was available for
the clinical practice of anesthesia with a relatively reliable
performance (29). The predicted
concentrations in the blood and effect-site that were shown in real
time provided the clinical anesthesiologist with a useful reference
during anesthesia (30,31).
The concept of a minimum alveolar concentration
(MAC) for inhalational anesthetics is well known and widely applied
in the clinic to guarantee adequate anesthesia for patients from
intraoperative awareness (32). A
similar concept applying to IV anesthetics is known as the median
effective concentration (EC50) (33). This is a practical clinical concept,
as it tends to predict the concentrations of the anesthetic agent
both in the plasma and in the effect-site simulated by different
pharmacokinetic models (32–34). The present results are reported as
the predicted effect-site concentrations, since this is the
physiologically relevant variable. The MAC and effect-site
concentrations of inhaled and IV anesthetics, respectively, can be
expressed for various endpoints, including movement, consciousness,
recall or hemodynamic responses. In this case, the endpoints were
loss and recovery of consciousness.
A limitation of the present study was that it would
have been possible to obtain the actual EC50 at LOC and
ROC if the blood concentrations of propofol had been measured.
Administering the normal saline-based 130/0.4 hydroxyethyl starch
with more chloride than balanced hetastarch is likely to have
affected the acid-base and electrolyte balance in the patients
(35). Furthermore, in the present
study, the effect of the two types of 6% hydroxyethyl starch on the
propofol requirement at LOC and the LOC time was not compared.
In conclusion, the predicted effect-site
EC50 of propofol at LOC and ROC was increased in
patients during AHHD of hydroxyethyl starch 130/0.4, which
indicated that the potency of propofol decreased and the target
concentration of propofol required to produce a comparable hypnotic
effect was increased when using the TCI system for propofol during
AHHD.
Acknowledgements
The study was supported by the Qianjiang Talents
Project of the Technology Office in Zhejiang (no. 2012R10033) and
the Clinical Scientific Research Funds of Zhejiang Provincial
Medical Association (no. 2012ZYC-A72), China.
References
|
1
|
Mielke LL, Entholzner EK, Kling M,
Breinbauer BE, Burgkart R, Hargasser SR and Hipp RF: Preoperative
acute hypervolemic hemodilution with hydroxyethylstarch: An
alternative to acute normovolemic hemodilution? Anesth Analg.
84:26–30. 1997. View Article : Google Scholar : PubMed/NCBI
|
|
2
|
Smith I, White PF, Nathanson M and
Gouldson R: Propofol: An update on its clinical use.
Anesthesiology. 81:1005–1043. 1994. View Article : Google Scholar : PubMed/NCBI
|
|
3
|
Liang H, Yang CX, Li H, Liu HZ and Wang
HB: Effects of preoperative acute hypervolemic hemodilution on
hypercoagulability of patients with colon cancer. Ai Zheng.
25:1256–1260. 2006.(In Chinese). PubMed/NCBI
|
|
4
|
Laks J, Pilon RN, Klovekorn WP, Anderson
W, MacCallum JR and O'Connor NE: Acute hemodilution: Its effects on
hemodynamics and oxygen transport in anesthetized man. Ann Surg.
180:103–109. 1974. View Article : Google Scholar : PubMed/NCBI
|
|
5
|
van den Oever HL, Dzoljic M, Ince C,
Hollmann MW and Mokken FC: Orthogonal polarization spectral imaging
of the microcirculation during acute hypervolemic hemodilution and
epidural lidocaine injection. Anesth Analg. 103:484–487. 2006.
View Article : Google Scholar : PubMed/NCBI
|
|
6
|
Kurdiumova NV, Parfenov AL, Fokin MS,
Grinenko EA, Eliava ShSh, Kheĭreddin AS and Sazonov IA: Intensive
care using hypervolemic hypertensive hemodilution in the acute
period of subarachnoidal hemorrhages in patients with arterial
aneurysms. Zh Vopr Neirokhir Im N N Burdenko. 2:48–53. 2006.(In
Russian). PubMed/NCBI
|
|
7
|
Saricaoglu F, Akinci SB, Celiker V and
Aypar U: The effect of acute normovolemic hemodilution and acute
hypervolemic hemodilution on coagulation and allogeneic
transfusion. Saudi Med J. 26:792–798. 2005.PubMed/NCBI
|
|
8
|
Zheng H, Wang J, Cao X, Zuo J and Liu J:
Effect of acute hypervolemic hemodilution on the pharmacokinetics
of propofol by target-controlled infusion. Zhonghua Ma Zui Xue Za
Zhi. 24:418–421. 2004.(In Chinese).
|
|
9
|
Tauzin-Fin P, Vinçon G, Houdek MC,
Demotes-Mainard F and Muscagorry JM: Pharmacokinetics of propofol
injected after deliberate preoperative hemodilution. Ann Fr Anesth
Reanim. 10:337–342. 1991.(In French). View Article : Google Scholar : PubMed/NCBI
|
|
10
|
Takizawa E, Takizawa D, Hiraoka H, Saito S
and Goto F: Disposition and pharmacodynamics of propofol during
isovolaemic haemorrhage followed by crystalloid resuscitation in
humans. Br J Clin Pharmacol. 61:256–261. 2006. View Article : Google Scholar : PubMed/NCBI
|
|
11
|
He M, Gao F and Tian YK: Effect of acute
non-normovolaemic hemodilution on sedation of propofol target
controlled infusion. Lin Chuang Ma Zui Xue Za Zhi. 28:837–840.
2012.(In Chinese).
|
|
12
|
Tang J, Wu G and Peng L: Pharmacokinetics
of propofol in patients undergoing total hip replacement: Effect of
acute hypervolemic hemodilution. Anaesthesist. 60:835–840. 2011.
View Article : Google Scholar : PubMed/NCBI
|
|
13
|
Marsh B, White M, Morton N and Kenny GN:
Pharmacokinetic model driven infusion of propofol in children. Br J
Anaesth. 67:41–48. 1991. View Article : Google Scholar : PubMed/NCBI
|
|
14
|
Kumar R, Chakraborty I and Sehgal R: A
prospective randomized study comparing two techniques of
perioperative blood conservation: Isovolemic hemodilution and
hypervolemic hemodilution. Anesth Analg. 95:1154–1161. 2002.
View Article : Google Scholar : PubMed/NCBI
|
|
15
|
Johnson KB, Egan TD, Kern SE, White JL,
McJames SW, Syroid N and Church T: The influence of hemorrhagic
shock on propofol: a pharmacokinetic and pharmacodynamic analysis.
Anesthesiology. 99:409–420. 2003. View Article : Google Scholar : PubMed/NCBI
|
|
16
|
Shrewsbury RP, Johnson LW and Oliver SR:
Influence of moderate haemodilution with fluosol or normal saline
on carbaryl disposition in Sprague-Dawley rats. J Pharm Pharmacol.
49:236–240. 1997. View Article : Google Scholar : PubMed/NCBI
|
|
17
|
Hiraoka H, Yamamoto K, Okano N, Morita T,
Goto F and Horiuchi R: Changes in drug plasma concentrations of an
extensively bound and highly extracted drug, propofol, in response
to altered plasma binding. Clin Pharmacol Ther. 75:324–330. 2004.
View Article : Google Scholar : PubMed/NCBI
|
|
18
|
Wouters PF, Van de Velde MA, Marcus MA,
Deruyter HA and Van Aken H: Hemodynamic changes during induction of
anesthesia with eltanolone and propofol in dogs. Anesth Analg.
81:125–131. 1995. View Article : Google Scholar : PubMed/NCBI
|
|
19
|
Leslie K, Sessler DI, Bjorksten AR and
Moayeri A: Mild hypothermia alters propofol pharmacokinetics and
increases the duration of action of atracurium. Anesth Analg.
80:1007–1014. 1995. View Article : Google Scholar : PubMed/NCBI
|
|
20
|
Nollert G, Sperling J, Sakamoto T, Jaeger
BR and Jonas RA: Higher hematocrit improves liver blood flow and
metabolism during cardiopulmonary bypass in piglets. Thorac
Cardiovasc Surg. 49:226–230. 2001. View Article : Google Scholar : PubMed/NCBI
|
|
21
|
Bhattacharya AA, Curry S and Franks NP:
Binding of the general anesthetics propofol and halothane to human
serum albumin high resolution crystal structures. J Biol Chem.
275:38731–38738. 2000. View Article : Google Scholar : PubMed/NCBI
|
|
22
|
Benet LZ and Hoener B: Changes in plasma
protein binding have little clinical relevance. Clin Pharmacol
Ther. 71:115–121. 2002. View Article : Google Scholar : PubMed/NCBI
|
|
23
|
Schuh FT: Influence of haemodilution on
the potency of neuromuscular blocking drugs. Br J Anaesth.
53:263–265. 1981. View Article : Google Scholar : PubMed/NCBI
|
|
24
|
Katz RL, Stirt J, Murray AL and Lee C:
Neuromuscular effects of atracurium in man. Anesth Analg.
61:730–734. 1982. View Article : Google Scholar : PubMed/NCBI
|
|
25
|
Dahaba AA, Rinnhofer S, Wang G, Xu X, Liu
XY, Wu XM, Rehak PH and Metzler H: Influence of acute normovolaemic
haemodilution on bispectral index monitoring and propofol dose
requirements. Acta Anaesthesiol Scand. 52:815–820. 2008. View Article : Google Scholar : PubMed/NCBI
|
|
26
|
Upton RN, Ludbrook GL, Grant C and
Martinez AM: Cardiac output is a determinant of the initial
concentrations of propofol after short-infusion administration.
Anesth Analg. 89:545–552. 1999. View Article : Google Scholar : PubMed/NCBI
|
|
27
|
Myburgh JA, Upton RN, Grant C and Martinez
A: Epinephrine, norepinephrine and dopamine infusions decrease
propofol concentrations during continuous propofol infusion in an
ovine model. Intensive care med. 27:276–282. 2001. View Article : Google Scholar : PubMed/NCBI
|
|
28
|
Kurita T, Morita K, Kazama T and Sato S:
Influence of cardiac output on plasma propofol concentrations
during constant infusion in swine. Anesthesiology. 96:1498–1503.
2002. View Article : Google Scholar : PubMed/NCBI
|
|
29
|
Glen JB: The development of ‘Diprifusor’:
A TCI system for propofol. Anesthesia. 53(Suppl 1): 13–21. 1998.
View Article : Google Scholar
|
|
30
|
Swinhoe CF, Peacock JE, Glen JB and Reilly
CS: Evaluation of the predictive performance of a ‘Diprifusor’ TCI
system. Anaesthesia. 53(Suppl 1): 61–67. 1998. View Article : Google Scholar : PubMed/NCBI
|
|
31
|
Irwin MG, Hui TW, Milne SE and Kenny GN:
Propofol effective concentration 50 and its relationship to
bispectral index. Anaesthesia. 57:242–248. 2002. View Article : Google Scholar : PubMed/NCBI
|
|
32
|
Smith C, McEwan AI, Jhaveri R, Wilkinson
M, Goodman D, Smith LR, Canada AT and Glass PS: The interaction of
fentanyl on the Cp50 of propofol for loss of consciousness and skin
incision. Anesthesiology. 81:820–828. 1994. View Article : Google Scholar : PubMed/NCBI
|
|
33
|
White M and Kenny GN: Intravenous propofol
anesthesia using a computerized infusion system. Anaesthesia.
45:204–209. 1990. View Article : Google Scholar : PubMed/NCBI
|
|
34
|
Shafer SL and Gregg KM: Algorithms to
rapidly achieve and maintain stable drug concentrations at the site
of drug effect with a computer-controlled infusion pump. J
Pharmacokinet Biopharm. 20:147–169. 1992. View Article : Google Scholar : PubMed/NCBI
|
|
35
|
Wilkes NJ, Woolf R, Mutch M, Mallett SV,
Peachey T, Stephens R and Mythen MG: The effects of balanced versus
saline-based hetastarch and crystalloid solutions on acid-base and
electrolyte status and gastric mucosal perfusion in elderly
surgical patients. Anesth Analg. 93:811–816. 2001. View Article : Google Scholar : PubMed/NCBI
|