Introduction
Chronic obstructive pulmonary disease (COPD) is a
condition characterized by persistent airflow limitation. The
disease is usually progressive and is a leading cause of morbidity
and mortality worldwide, with a prevalence between 0.5–4% depending
on the region and ~2.7 million deaths in 2000 (1,2).
Patients with COPD may have recurrent exacerbations that contribute
to the overall severity. Acute exacerbation of COPD (AECOPD) is an
acute event characterized by a worsening of the respiratory
symptoms of a patient (including dyspnea, cough and sputum
production) that is beyond normal day-to-day variations and that
requires additional therapy. AECOPD is associated with accelerated
loss of lung function and poor quality of life (2).
Computed tomography (CT) is frequently performed in
AECOPD to screen for pneumonia, lung cancer, pneumothorax and
hydrothorax; however, to the best of our knowledge, there are few
studies on the CT manifestation of AECOPD. Furthermore, only a
limited number of studies have investigated the pathology of COPD
exacerbations, since a lung biopsy is considered unnecessary and
unfeasible for patients in a poor condition (3,4). The
pathology of the lung can be well reflected using CT; therefore,
additional studies are required on the CT manifestation of
AECOPD.
Several factors can precipitate COPD exacerbations,
including infections and air pollution (4). The manifestation of COPD exacerbation
can be divided into two parts: The deterioration of COPD
manifestation (including symptoms of dyspnea, cough and sputum),
and the manifestation of lung infection (including symptoms of
fever and purulent sputum).
Numerous studies have demonstrated that the main
pathological changes in COPD include emphysema, airway wall
thickening and reduced lumen caliber (4–7). The
emphysema extent can be evaluated by the percentage of lung volume
occupied by low attenuation areas (LAA%) (8). Airways with an internal diameter <2
mm, which is below the resolution of CT, are the major sites of
airway obstruction in COPD; however, their dimensions are reflected
by the dimensions of large airways, which are easily measured on CT
scans (9). In addition, impaired
lung function has been demonstrated to be significantly correlated
with emphysema extent (LAA%) and bronchial dimensions (10).
Lung infection can manifest as lung infiltration,
which can be evaluated by radiography, although it is more clearly
evaluated by CT. Radiographic lung consolidation is common in
patients with AECOPD, which affects 36.3% of inpatients in the USA
(11). In the present study, three
aspects of the CT manifestation of AECOPD were investigated,
including the airway dimension, the extent of emphysema and lung
infiltration.
Patients and methods
Patients
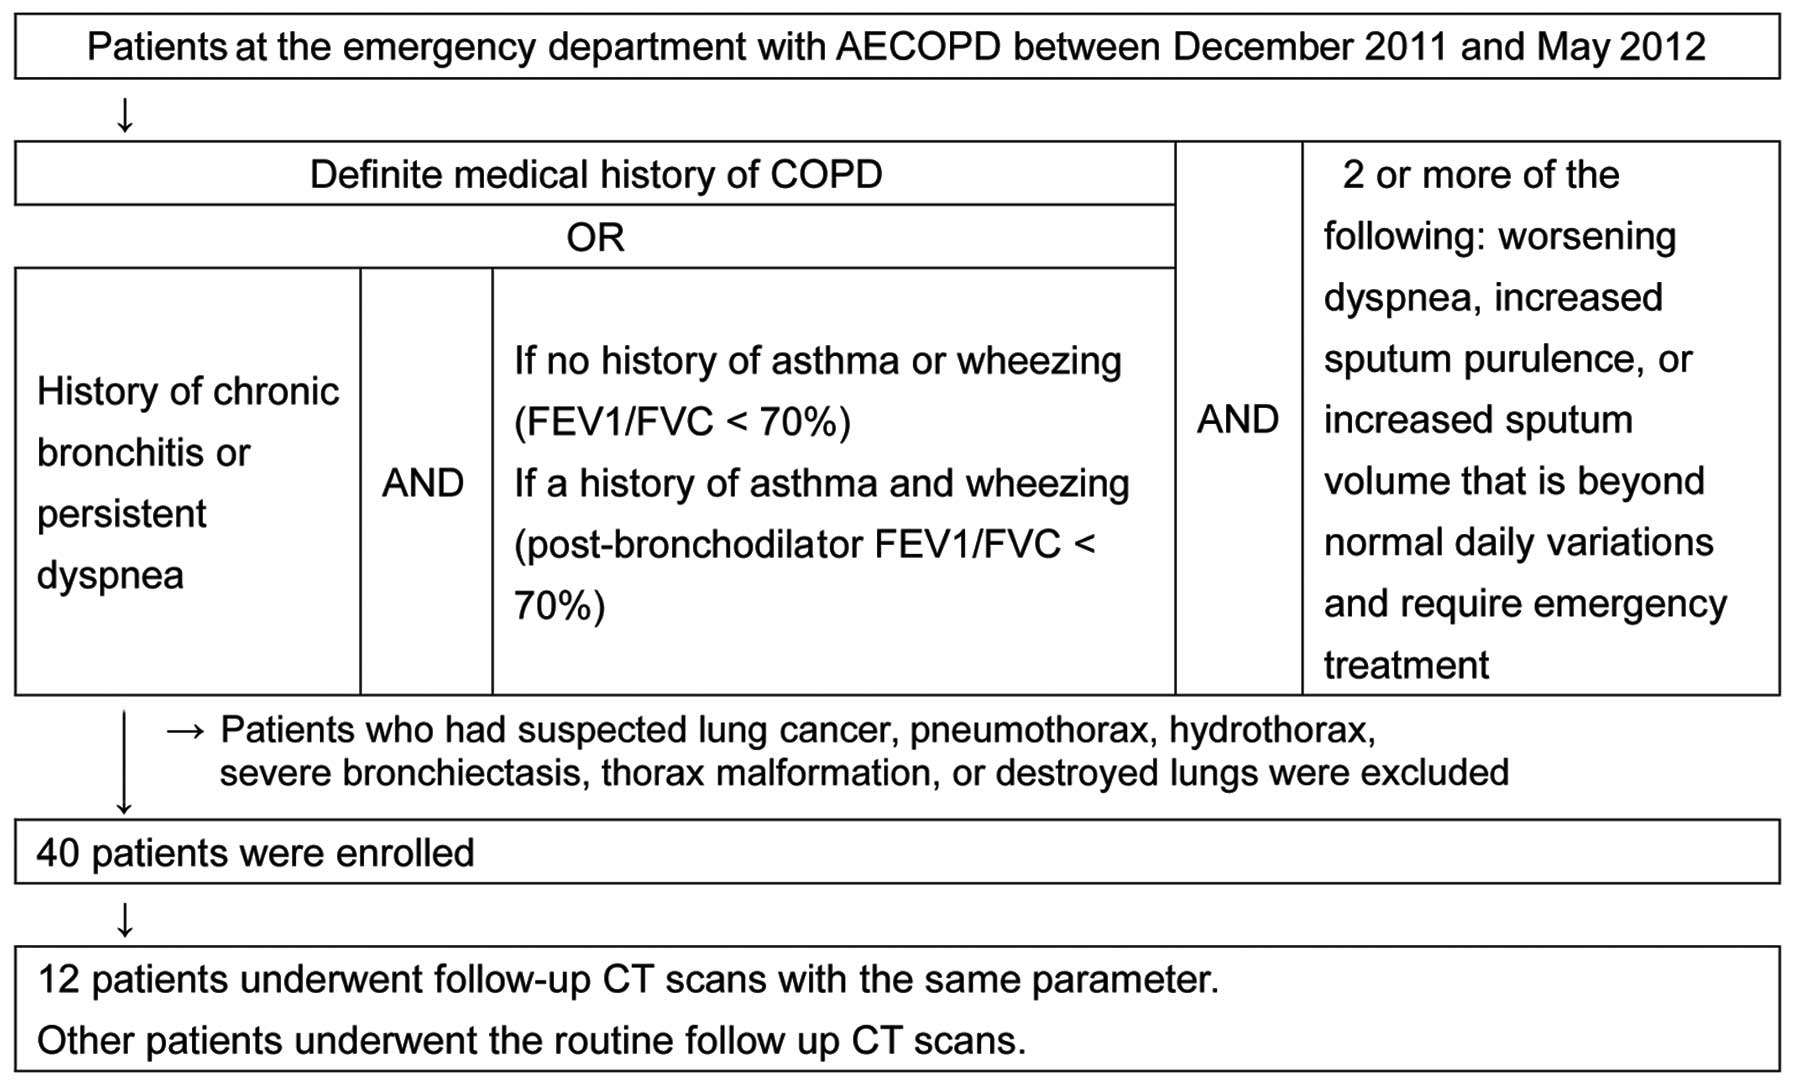
Patients with a primary diagnosis of AECOPD that
were admitted at the emergency department of Ruijin Hospital in
Shanghai, China between December 2011 and May 2012 were recruited
(Fig. 1). The Ethics Committee of
Ruijin Hospital approved the study protocol (approval no. 2009–23),
and all participants provided informed consent. The admitting
physician diagnosed the patients with AECOPD, based on the patient
presenting two of the following three characteristics: Increased
dyspnea, increased sputum volume or increased sputum purulence from
COPD that were beyond the normal day-to-day variations and required
emergency treatment (12). COPD was
diagnosed on the basis of a patient's history and spirometry
results. A diagnosis of COPD was considered based on the following
criteria: i) The patient had a clear medical history of COPD; ii)
the patient had history of chronic bronchitis or persistent dyspnea
and the lung function test performed in emergency department showed
a forced expiratory volume in 1 sec/forced vital capacity
(FEV1/FVC) of <70%. If the patients had a history of asthma or
wheezing, the bronchodilation test was performed. COPD was
considered only if the patient had persistent dyspnea,
post-bronchodialation FEV1/FVC of <70% (Fig. 1). Spirometry was performed using a
Cosmed® Spirolab-II spirometer (Cosmed Srl, Rome, Italy) and
Jaeger® MasterScreen Body/Diff system (CareFusion Corporation, San
Diego, CA, USA) in follow-up according to the American Thoracic
Society/European Respiratory guidelines (13). Whenever possible, the diagnosis was
confirmed by spirometry when the patients were in a stable
condition.
The exclusion criteria included the following: A
history of other respiratory illnesses, including lung cancer,
pneumothorax, hydrothorax, severe bronchiectasis, thorax
malformation, destroyed lung; illness (such as hemodynamic
instability) too severe to allow a patient to undergo routine
examinations; and patients that were admitted at the emergency
department for reasons other than COPD exacerbation. Routine
history recording, physical examinations and routine blood tests
were performed on the patients. The patients were treated in
accordance with the guidelines of the Global Initiative for Chronic
Obstructive Lung Disease (2).
CT scan acquisition
A chest CT scan without contrast media was performed
at the first visit and 3 months after the exacerbation. The scanner
(Light Speed 16; GE Medical Systems, Milwaukee, WI, USA) and
protocol used were according to those reported in a previous study
(14). The technical parameters were
as follows: Tube voltage, 120 kV; tube current, 220 mA; tube
rotation time, 0.8 sec; and 1.25 mm collimation. Images were
reconstructed using a standard algorithm: Section thickness,
1.25-mm; interval, 1.25 mm; and matrix, 512 × 512 (14). The patients were placed in a supine
position and held their breath during the scan following a deep
inspiration.
CT image analysis
Assessment of airway dimension
The B1 (which is the apical/apical-posterior
segmental bronchus of the upper lobe) and B10 (which is the
posterior basilar segmental bronchus of the lower lobe) bronchi of
both sides of the lung were selected, as well as the longest
bronchus visible at the subsegmental and the more distal
bifurcations. For each patient, the airway dimension was measured
every 2.5 mm or as dense as possible on the four bronchi from the
origin of the 3rd generation to the end of the 6th generation. The
generation of each site was registered. For all patients, the
average airway dimensions of each generation of each bronchus were
calculated. The dimensions were calculated on the plane
perpendicular to the long axis of the airway using the Airway
Inspector module of 3D Slicer, version 2.8 (Brigham and Women's
Hospital, Harvard Medical School, Boston, MA, USA) (15). The mean inner lumen area (Ai), mean
outer area of the bronchus (Ao), wall area percentage [WA%;
calculated as follows: WA% = (Ao-Ai)/Ao × 100)], mean outer and
inner radii, mean wall thickness (WT), mean wall, mean peak wall
and lumen attenuation values were calculated using the full width
at half-maximum algorithm (16).
Assessment of the emphysema severity and lung
volume
The commercial software Myrian, version 1.12
(Intrasense, Montpellier, France) was used to automatically
calculate the lung volume and LAA% with the acquiescent threshold
of −950 Hounsfield units (HU), in order to represent the severity
of emphysema, as performed in a previous study (17).
Assessment of lung infiltration
One pulmonologist and one radiologist reviewed the
CT images. Final decisions were reached by consensus. The presence
of a centrilobular or acinar shadow, air space consolidation with
lobular distribution or segmental distribution, ground-glass
attenuation with lobular distribution and thickening of the
interlobular septa (ILS) were assessed as in a previous study
(18). In addition, the extent of
each shadow or consolidation was calculated using the ‘ABC/2’
method, in which A is the greatest diameter on the largest shadow
slice, B is the diameter perpendicular to A, and C is the number of
axial slices with the shadow multiplied by the slice thickness
(19). The most severe type of lung
parenchymal infiltration was defined for each patient based on the
following order (in increasing severity): Centrilobular/acinar
shadow; lobular consolidation; and segmental/lobe consolidation for
CT image review. The total consolidation volume was calculated
using the formula Σ = the density of infiltration × volume of each
type of lung parenchymal infiltration, which included acinar shadow
and air space consolidation with lobular or segmental distribution.
Furthermore, the density of infiltration was an arbitrary score
based on the percentage of volume of focus occupied by a
consolidation. It was classified into four grades: 25, 50, 75 and
100%. The assessments were performed with the reviewers blinded to
the clinical and laboratory data of the patients.
Statistical analysis
The emphysema extent and the airway dimensions
between the exacerbation and the stable phase were compared by
paired sample Student's t-test. Comparisons of the mean airway
dimension or attenuation of the four bronchi in each generation
between the exacerbation and stable phases were analyzed by random
block design two-way analysis of variance. The correlation between
them was assessed by Pearson's correlation test, as they had a
normal distribution. In addition, the correlation of clinical
characteristics with the type or extent of lung infiltration was
assessed by Spearman's correlation. The association between ranked
data and dichotomic categorical variables was assessed by the
Mann-Whitney U-test. The association between dichotomic categorical
variables was assessed by χ2 test (exact method).
Statistical analyses were performed with SPSS software (version
17.0; SPSS Inc., Chicago, IL, USA). P<0.05 was considered to
indicate a statistically significant difference.
Results
Characteristics of AECOPD
patients
A total of 40 patients with AECOPD that underwent
follow-up CTs were included in the present study (Table I). The majority of the patients were
male (37/40) and former smokers, with a mean age of 75±11 years.
The FEV1/FVC [mean ± standard deviation (SD)] was 50±13% and the
predicted FEV1% (mean ± SD) was 42±21%. In total, 12 patients
underwent a follow-up CT using the same scan parameters and their
data were eligible for the quantitative CT image analysis. No
statistically significant differences in characteristics were
observed between the patients who underwent CT follow-up with the
same or different scan parameters.
 | Table I.Characteristics of the patients in
the study. |
Table I.
Characteristics of the patients in
the study.
| Patient
characteristics | All patients
(n=40) | Follow-up CT with
the same parameters (n=12) |
P-valuea |
|---|
| Male/total | 37 | 10 | 0.308 |
| Age, years |
75±11 | 74±8 | 0.801 |
| BMI,
kg/m2 | 20±3 | 21±3 | 0.474 |
| Smoking status | 35 | 10 | 0.209 |
| Current
smoker | 8 | 2 |
|
|
Ex-smoker | 27 | 8 | 1.000 |
|
Packs-year |
33±20 |
32±17 | 0.703 |
| Years
since quitting smoking |
14±13 | 11±7 | 0.418 |
| Clinical
presentations |
|
|
|
|
Increase in cough | 35 | 10 | 0.613 |
|
Increase in sputum volume | 34 | 11 | 1.000 |
|
Increase in sputum
purulence | 20 |
7 | 0.726 |
|
Increase in dyspnea | 39 | 11 | 1.000 |
|
Fever | 19 |
7 | 0.460 |
| Clinical score |
|
|
|
| CRB-65
score | 1 (1–1) | 1 (1–1) | 0.520 |
| mMRC
grade | 3 (2–4) | 4 (2–4) | 0.536 |
|
Performance status | 2 (1–3) | 1.5 (1.0–2.75) | 0.342 |
| CAT
score | 27±8 | 28±9 | 0.988 |
| Comorbidities |
|
|
|
|
Asthma |
3 | 0 | 0.543 |
|
Diabetes mellitus |
3 | 0 | 0.545 |
|
Hypertension | 15 | 4 | 1.000 |
|
Coronary artery disease | 10 | 3 | 1.000 |
|
Left-sided heart failure |
3 | 2 | 0.548 |
| Lung function test
during exacerbation |
|
|
|
| FEV1,
L |
1.08±0.52 |
1.16±0.49 | 0.379 |
| FEV1, %
predicted |
42±21 |
48±24 | 0.168 |
| FVC,
L |
2.17±0.75 |
2.29±0.72 | 0.337 |
|
FEV1/FVC, % |
50±13 |
52±13 | 0.499 |
| Blood test during
exacerbation |
|
|
|
| WBC
count, ×109/l |
9.1±4.5 |
8.9±5.0 | 0.700 |
| N% |
74±11 |
70±11 | 0.220 |
| Hb,
g/l | 136±18 | 135±10 | 0.914 |
| PLT
count, ×109/l | 206±65 | 186±91 | 0.337 |
| pH |
7.40±0.03 |
7.42±0.01 | 0.223 |
|
PaO2, kPa |
9.02±2.69 | 10.0±0.7 | 0.422 |
|
PaCO2, kPa |
5.57±0.95 |
5.55±0.22 | 0.976 |
Comparison of the airway dimensions
and attenuation between the acute exacerbation and the stable
phase
The absolute values of each airway dimension were
calculated separately for the generation and for the bronchus. At
exacerbation, the mean values of the WA% in the 3rd, 4th, 5th and
6th generations were significantly negatively correlated with FEV1
(r=0.673, P=0.016) and FEV1% predicted (r=0.668, P=0.018). The FEV1
was also significantly negatively correlated with the average mean
wall attenuation (r=0.677, P=0.016) and peak wall attenuation
(r=0.723, P=0.008). The predicted FEV1% was significantly
correlated with the average values of the inner radius (r=0.599,
P=0.040) and the Ai (r=0.594, P=0.042).
The mean wall attenuation increased during
exacerbation compared with the stable phase values in the 3rd
(−215±91 vs. −283±101 HU, respectively; P<0.001), 4th (−312±115
vs. −382±119 HU, respectively; P=0.001) and 5th (−414±138 vs.
−463±139 HU, respectively; P=0.027) generations of bronchi, with
statistically significant differences observed. In addition, the
peak wall attenuation increased during exacerbation, compared with
the stable phase values, in the 3rd (−128±105 vs. −212±111 HU,
P<0.001), 4th (−242±130 vs. −330±133 HU, P<0.001) and 5th
(−361±156 vs. −429±156 HU, P=0.008) generations of bronchi, with
statistically significant differences observed. Furthermore, the
lumen attenuation increased during exacerbation, compared with the
stable phase values, in the 3rd (−922±114 vs. −961±26 HU, P=0.02),
4th (−891±128 vs. −929±66 HU, P=0.032) and 6th generation of
bronchi (−863±118 vs. −912±67 HU, P=0.029). The WA% also increased
in the 3rd generation of bronchi during an exacerbation compared
with the stable phase (82.7±6.1 vs. 79.8±5.6%, respectively;
P=0.003), with a statistically significant difference observed. In
addition, the WA% in the 4th to 6th generations and wall thickness
tended to increase during the exacerbation. The inner radius and Ai
tended to decrease during the exacerbation (Fig. 2).
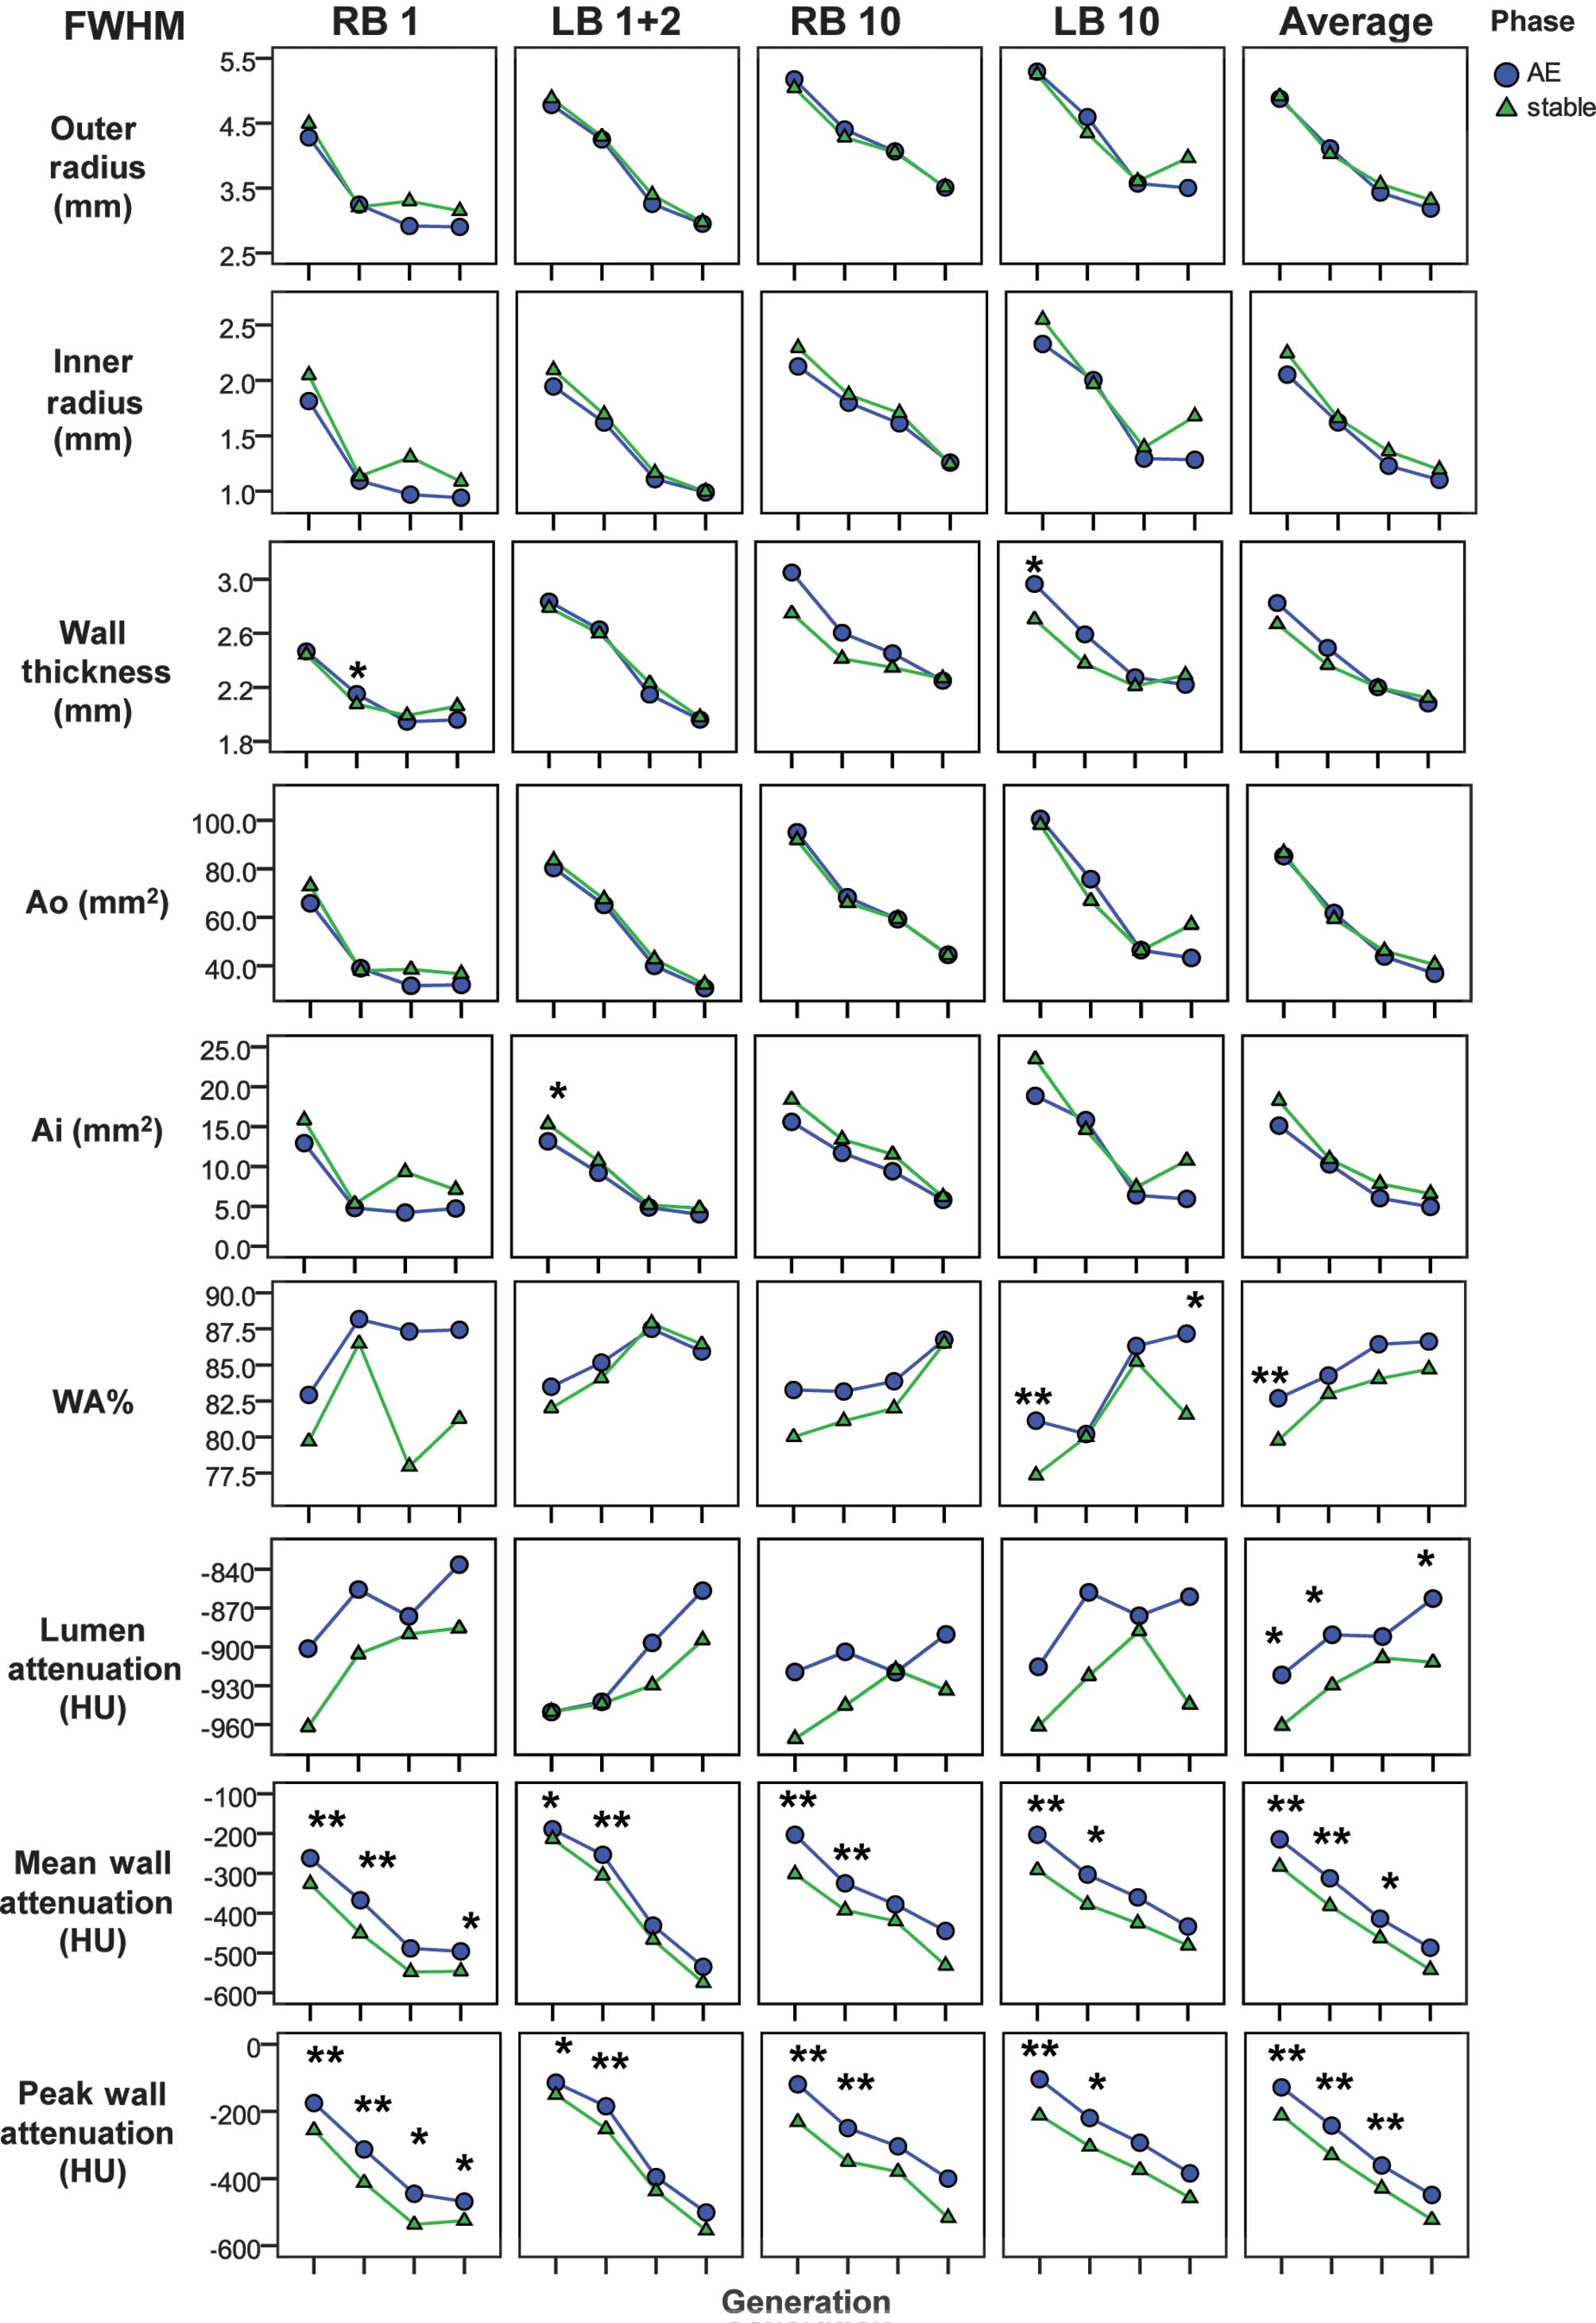 | Figure 2.Airway dimensions and attenuation
during the AE and stable phases of each generation. *P<0.05 and
**P<0.01 compare differences in the AE and stable phases in the
airway dimension or attenuation. AE, acute exacerbation; Ai, inner
luminal area; Ao, outer area of the bronchus; FWHM, full width at
half-maximum; WA%, wall area percentage; HU, Hounsfield units; LB
1+2, posterior apical bronchus of the left upper lobe; LB 10,
posterior basal bronchus of the left lower lobe; RB 1, apical
bronchus of the right upper lobe; RB 10, posterior basal bronchus
of the right lower lobe; average, mean value of the four
bronchi. |
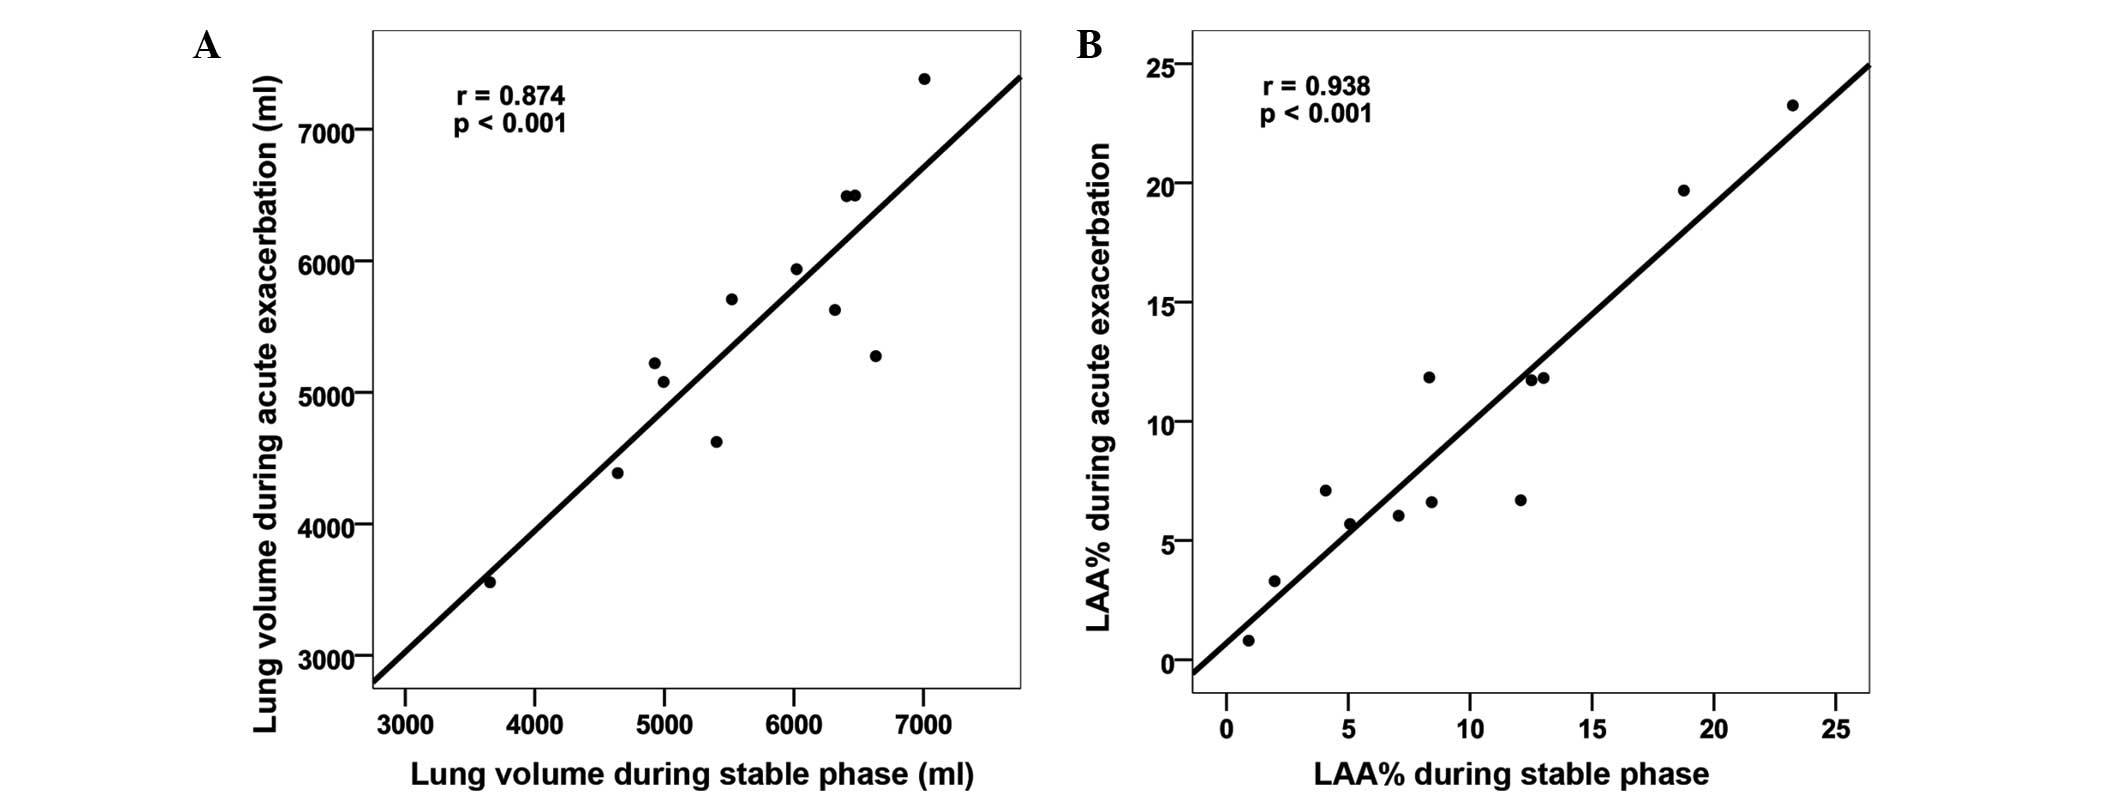
Comparison of the emphysema extent and
lung volume between the exacerbation and stable phases
The LAA% and lung volume during exacerbation were
correlated with LAA% and lung volume during the stable phase
(Fig. 3). No statistically
significant differences were observed in the LAA% and the lung
volume between the CT images obtained during exacerbation and
during the stable phase (Table
II).
| Table II.Comparison of the lung volume and the
LAA% on CT between the AE and the stable phases. |
Table II.
Comparison of the lung volume and the
LAA% on CT between the AE and the stable phases.
| Parameter | AE | Stable phase | P-value |
|---|
| Lung volume
(ml) | 5,482±1,038 | 5,666±985 | 0.237 |
| LAA% | 9.54±6.54 |
9.62±6.68 | 0.910 |
Assessment of lung infiltration
Table III shows the
incidence of specific CT findings of lung infiltration in the 39
patients with AECOPD (the CT images of one patient could not be
acquired from our image archiving system). In total, 24/39 patients
(61.5%) presented lung infiltration to some extent on CT. According
the follow-up CT, 23/39 patients with AECOPD (59.0%) presented lung
infiltration with absorption, while the lung infiltration was
present in only 1 lobe in 8/39 patients (20.5%) and in several
lobes in 15/39 patients (38.5%). Furthermore, the left lower lobe
(14/39 patients), right lower lobe (12/39 patients) and right upper
lobe (11/39 patients) were most frequently involved, whereas the
left upper lobe (5/39 patients) was less frequently involved. The
‘air space consolidation with lobular distribution’ was the most
frequent manifestation of lung infiltration (16/39 patients).
| Table III.Overall patterns, range and
distribution of lung infiltration on computed tomography (CT)
during exacerbation. |
Table III.
Overall patterns, range and
distribution of lung infiltration on computed tomography (CT)
during exacerbation.
| Lung infiltration
parameters | Original scan | Follow-up scan |
|---|
| Overall lung
infiltration | 24/39 | 23/39 |
| Pattern |
|
|
| Acinar
shadow | 8/39 | 7/39 |
| Air
space consolidation with lobular distribution | 19/39 | 16/39 |
|
Consolidation with segmental
distribution | 4/39 | 4/39 |
|
Ground-glass attenuation with
lobular distribution | 6/39 | 3/39 |
|
Ground-glass attenuation with
thickened interlobular or intralobular septa | 1/39 | 1/39 |
|
Thickening of the interlobular
septa | 5/39 | 4/39 |
| Range, lobes |
|
|
| 0 | 15/39 | 16/39 |
| 1 | 6/39 | 8/39 |
| 2 | 10/39 | 9/39 |
| 3 | 4/39 | 2/39 |
| 4 | 3/39 | 3/39 |
| 5 | 1/39 | 1/39 |
| Distribution |
|
|
| Right
upper lobe | 12/39 | 11/39 |
| Right
middle lobe | 8/39 | 7/39 |
| Right
lower lobe | 15/39 | 12/39 |
| Left
upper lobe | 5/39 | 5/39 |
| Left
lower lobe | 15/39 | 14/39 |
No changes were observed in the follow-up CT scans
of 3/6 cases with ‘ground-glass attenuation with lobular
distribution’ infiltration, 3/19 cases with ‘air space
consolidation with lobular distribution’ infiltration, 1/5 cases
with ‘thickening of the ILS’ infiltration and 1/8 cases with
‘acinar shadow’ infiltration (Table
IV).
| Table IV.Volume occupied by each type of lung
infiltration on the follow-up computed tomography scan. |
Table IV.
Volume occupied by each type of lung
infiltration on the follow-up computed tomography scan.
|
| With absorption
| No absorption
|
|---|
| Infiltration
pattern | N | Volume
(cm3) | N | Volume
(cm3) |
|---|
| Acinar shadow | 7 | 24±39 | 1 | 11 |
| Air space
consolidation with |
|
|
|
|
| lobular
distribution | 16 | 23±29 | 3 | 4±3 |
| Consolidation with
segmental distribution | 4 | 181±113 | 0 | NA |
| Ground-glass
attenuation with |
|
|
|
|
| lobular
distribution | 3 | 12±14 | 3 | 1±1 |
| Ground-glass
attenuation with thickened |
|
|
|
|
| interlobular or
intralobular septa | 1 | 143 | 0 | NA |
| Thickening of the
interlobular septa | 4 | 4±3 | 1 | 45 |
| Total volume | 22 | 11 (0.5–34) | 6 | 1.3 (0.6–10.3) |
Furthermore, no statistically significant
differences were observed in the risk of mortality (P=0.211),
number of main symptoms of AECOPD, body temperature, CRB-65 score
(confusion, respiratory rate of ≥30/min, systolic blood pressure of
<90 mmHg or diastolic blood pressure of ≤60 mmHg, and age of ≥65
years), WBC count and neutrophil percentage (N%) between the AECOPD
patients with and without lung infiltration. The N% was
significantly higher in patients with segmental distribution
consolidation compared with patients without segmental distribution
consolidation (88.2 vs. 72.4%, respectively; P=0.012; Table V). The number of lobes and the volume
occupied by the segmental distribution consolidation were
correlated with N%, with statistical significance. In addition, the
total volume of lung parenchymal consolidation was correlated with
the WBC count and N%. The number of lobes and volume occupied by
the ground-glass attenuation with thickened interlobular or ILS
were correlated with the highest body temperature. No significant
correlations were observed between the extent of acinar shadow, air
space consolidation with lobular distribution, ground-glass
attenuation with lobular distribution, thickening of the ILS and
signs of infection [including the number of main symptoms, body
temperature, WBC count, N% and the severity of exacerbation (such
as the CRB-65 score); Table
VI].
| Table V.Association between the existence of
lung parenchymal/interstitial infiltration and signs of
infection. |
Table V.
Association between the existence of
lung parenchymal/interstitial infiltration and signs of
infection.
| Infiltration
pattern | Patients with
infiltration | Patients without
infiltration | P-value |
|---|
| Acinar shadow |
|
|
|
| Number
of main symptoms | 2.5 (2–3) | 2.5 (2–3) | 0.952 |
| Fever
(T-37), °C | 0.4 (0–0.9) | 0.2 (0–1.4) | 0.851 |
|
CRB-65 | NA | 1 (0–1) | NA |
| WBC
count | 7.78
(6.68–9.21) | 8.12
(6.05–11.95) | 1 |
| N% | 75.6
(65.5–86.4) | 74.4
(64.8–82.2) | 0.584 |
| Air space
consolidation with lobular distribution |
|
|
|
| Number
of main symptoms | 3 (2–3) | 2 (2–3) | 0.467 |
| Fever
(T-37), °C | 0 (0–0.8) | 0.8 (0–1.2) | 0.641 |
|
CRB-65 | 1 (1–1) | 1 (0–1) | 0.677 |
| WBC
count | 8.35
(6.68–10.5) | 6.74
(6.44–10.1) | 0.776 |
| N% | 74.3
(65.5–86.0) | 74.5
(66.2–81.5) | 0.751 |
| Consolidation with
segmental distribution |
|
|
|
| Number
of main symptoms | 2.5 (2–3) | 2.5 (2–3) | 0.979 |
| Fever
(T-37), °C | 1.2 (0–2.5) | 0.2 (0–1.2) | 0.731 |
|
CRB-65 | 0.5 (0–1) | 1 (1–1) | 0.476 |
| WBC
count | 19.6
(11.79–27.41) | 7.63
(6.16–9.71) | 0.082 |
| N% | 89.1
(87.8–90.4) | 73.2
(63.3–81.5) | 0.012 |
| Ground-glass
attenuation with lobular distribution |
|
|
|
| Number
of main symptoms | NA | 2 (2–3) | NA |
| Fever
(T-37), °C | 1.2 (0.6–1.2) | 0 (0–1) | 0.688 |
|
CRB-65 | 1 (1–1.5) | 1 (0–1) | 0.219 |
| WBC
count | 6.44
(4.745–12.7) | 8.17
(6.57–10.1) | 0.549 |
| N% | 70.3
(66.8–81.65) | 74.5
(66.2–81.6) | 1 |
| Ground-glass
attenuation with thickened interlobular or intralobular septa |
|
|
|
| Number
of main symptoms | NA | 2.5 (2–3) | NA |
| Fever
(T-37), °C | NA | 0.2 (0–1.2) | NA |
|
CRB-65 | NA | 1 (0.5–1) | NA |
| WBC
count | NA | 8.12
(6.3–10.9) | NA |
| N% | NA | 74.4
(64.8–82.2) | NA |
| Thickening of the
intralobular septa |
|
|
|
| Number
of main symptoms | 3 (2.5–3) | 2 (2–3) | 0.654 |
| Fever
(T-37), °C | 1.2 (0.6–1.2) | 0 (0–1) | 0.218 |
|
CRB-65 | NA | 1 (0–1) | 0.673 |
| WBC
count | 7.2
(5.12–13.1) | 8.17
(6.44–10.1) | 0.787 |
| N% | 69.6
(66.4–81.3) | 74.5
(66.2–81.6) | 1 |
| Parenchyma
infiltration |
|
|
|
| Number
of main symptoms | 3 (2–3) | 2 (2–3) | 0.620 |
| Fever
(T-37), °C | 0.4 (0–1) | 0 (0–1.2) | 0.812 |
|
CRB-65 | 1 (1–1) | 1 (0–1) | 0.571 |
| WBC
count | 8.74
(7.20–11.8) | 6.74
(6.05–8.88) | 0.114 |
| N% | 79.6
(69.6–87.8) | 72.2
(64.8–76.2) | 0.285 |
| Interstitial
infiltration |
|
|
|
| Number
of main symptoms | 3 (2.5–3) | 2 (2–3) | 0.374 |
| Fever
(T-37), °C | 0.6 (0–1.2) | 0.2 (0–1.25) | 0.508 |
|
CRB-65 | 1 (1–1.5) | 1 (0–1) | 0.235 |
| WBC
count | 6.82
(4.74–13.1) | 8.26
(6.36–10.9) | 0.450 |
| N% | 70.0
(66.4–81.6) | 75.1
(63.8–82.2) | 0.827 |
| Overall
infiltration |
|
|
|
| Number
of main symptoms | 3 (2–3) | 2 (1.5–2) | 0.199 |
| Fever
(T-37)°C | 0.6 (0–1.2) | 0 (0–1.3) | 0.742 |
|
CRB-65 | 1 (1–1) | 0.5 (0–1) | 0.243 |
| WBC
count | 8.54
(6.30–12.3) | 6.74
(6.12–8.88) | 0.185 |
| N% | 77.0
(66.4–89.1) | 73.4
(63.8–76.2) | 0.280 |
| Table VI.Correlation between the index of lung
parenchymal/interstitial infiltration and signs of infection. |
Table VI.
Correlation between the index of lung
parenchymal/interstitial infiltration and signs of infection.
|
| Main symptoms | Body
temperature | CRB-65 | WBC count | N% |
|---|
|
|
|
|
|
|
|
|---|
| Characteristic | r | P-value | r | P-value | r | P-value | r | P-value | r | P-value |
|---|
| Most severe pattern
of lung parenchymal infiltration |
0.114 | 0.503 |
0.048 | 0.789 |
0.029 | 0.884 |
0.281 | 0.096 |
0.276 | 0.103 |
| Number of lobes
involved |
|
|
|
|
|
|
|
|
|
|
| Acinar
shadow | −0.001 | 0.994 | −0.036 | 0.841 |
0.300 | 0.121 | −0.012 | 0.946 | −0.114 | 0.508 |
| Air
space consolidation with lobular distribution |
0.128 | 0.452 | −0.030 | 0.865 |
0.130 | 0.509 |
0.145 | 0.400 |
0.130 | 0.448 |
|
Consolidation with segmental
distribution | −0.010 | 0.951 |
0.073 | 0.683 | −0.195 | 0.319 |
0.298 | 0.078 |
0.408 | 0.013 |
|
Ground-glass attenuation with
lobular distribution |
0.343 | 0.038 |
0.078 | 0.660 |
0.307 | 0.112 | −0.111 | 0.518 |
0.005 | 0.978 |
|
Ground-glass attenuation with
thickened interlobular or intralobular septa |
0.068 | 0.688 |
0.382 | 0.026 |
0.060 | 0.761 |
0.220 | 0.198 |
0.268 | 0.113 |
|
Thickening of the ILS |
0.091 | 0.591 |
0.231 | 0.188 |
0.108 | 0.583 | −0.053 | 0.758 | −0.005 | 0.978 |
|
Total |
0.263 | 0.116 |
0.089 | 0.617 |
0.318 | 0.099 |
0.257 | 0.131 |
0.239 | 0.159 |
| Volume
occupied |
|
|
|
|
|
|
|
|
|
|
| Acinar
shadow | −0.087 | 0.613 | −0.064 | 0.724 |
0.302 | 0.126 |
0.081 | 0.643 |
0.006 | 0.971 |
| Air
space consolidation with lobular distribution |
0.107 | 0.529 | −0.124 | 0.484 |
0.150 | 0.446 |
0.137 | 0.426 |
0.142 | 0.409 |
|
Consolidation with segmental
distribution |
0.000 | 0.996 |
0.083 | 0.642 | −0.205 | 0.295 |
0.305 | 0.071 |
0.406 | 0.014 |
|
Ground-glass attenuation with
lobular distribution |
0.342 | 0.038 |
0.078 | 0.661 |
0.307 | 0.113 | −0.129 | 0.452 | −0.011 | 0.948 |
|
Ground-glass attenuation with
thickened interlobular or intralobular septa |
0.057 | 0.738 |
0.386 | 0.024 |
0.060 | 0.761 |
0.220 | 0.198 |
0.268 | 0.113 |
|
Thickening of the ILS |
0.099 | 0.558 |
0.248 | 0.158 |
0.108 | 0.584 | −0.042 | 0.808 |
0.008 | 0.965 |
|
Total |
0.074 | 0.668 |
0.014 | 0.938 |
0.095 | 0.638 |
0.398 | 0.018 |
0.392 | 0.020 |
Discussion
To the best of our knowledge, no previous studies
have been conducted on the CT manifestation of AECOPD. Therefore,
the present study investigated the CT manifestation during an acute
exacerbation in patients with COPD.
The morphology of the airways from the 3rd to the
6th generation was examined and it was demonstrated that WA%, mean
wall, peak wall and lumen attenuations were increased during the
exacerbation. The increased peak wall attenuation is derived from a
true increase in the bronchial wall structure density and a
decrease in the contrast reduction caused by an increase in
bronchial wall thickness (20).
Therefore, the peak wall attenuation can be used to simultaneously
assess the overall situation of thickness and density. Yamashiro
et al (16) demonstrated that
peak bronchial wall attenuation is significantly correlated with
FEV1 in patients with COPD, particularly in the distal airways. In
addition, Lederlin et al (21) revealed that the mean wall attenuation
value, rather than other parameters of airway dimension and
emphysema extent, discriminated between smokers with and without
COPD, and between smokers without COPD and healthy controls.
Furthermore, the mean wall attenuation value was correlated with
pulmonary function test (PFT) results, and the correlation
coefficients of the mean wall attenuation value with each parameter
of PFT were greater compared with those obtained for any other
bronchial dimension (21).
In the present study, the mean peak bronchial wall
attenuation and mean bronchial wall attenuation were also the most
sensitive indices to differentiate between the AE and stable
phases.
Hasegawa et al (22) demonstrated that the WA% and Ai were
significantly correlated with the FEV1% predicted. Han et al
(14) also revealed that airway wall
thickness was correlated with the COPD exacerbation rate,
independent of the FEV1. In the present study, the WA% increased
significantly, the Ai tended to decrease and the bronchial wall
thickness tended to increase during an exacerbation; however, the
Ao did not appear to change. Bronchial wall thickening may be
caused by inflammatory infiltration in the mucosa and by mucus
secretion. The Ai decrease may be caused by the bronchial wall
thickening and bronchial spasm. The increase of WA% was a combined
effect of bronchial wall thickening and decrease in the Ai.
Emphysema extent is an important index in predicting
lung function and survival. In the present study, there was a good
correlation and no statistically significant difference in the LAA%
between the exacerbation phase and at 3 months after the
exacerbation. Previous studies have indicated that, in patients
with an exacerbation, the annual change in LAA% remains much
smaller compared with the basal LAA% (2.1/36.9%) (23). Therefore, the emphysema extent on CT
during exacerbation can also reflect the basal emphysema extent and
the irreversible part of airflow limitation of AECOPD to a certain
degree.
Although numerous clinical trials regarding AECOPD
have excluded patients with pneumonia (24–26), a
few patients with AECOPD present lung parenchymal consolidations.
The morbidity of lung parenchymal consolidation in AECOPD varied
across different studies: It was found to be 12% in a study in
Israel (27); 16% in the UK
(28); and 36.3% in the USA
(11), according to national audit
data.
The present study also revealed that 61.5% of
patients with AECOPD exhibited lung infiltration on the CT images,
which was, at least partly, absorbed at follow-up CT scans. These
data were clearly higher compared with those presented in previous
studies (27,28). This may be due to the higher
sensitivity of CT compared with chest radiography in diagnosing
pneumonia, particularly in patients with COPD (29); however, the clinical significance of
lung infiltration on a CT image with a negative radiograph image
remains unclear (30).
Lieberman et al (27) showed that AECOPD patients with
pneumonia generally manifest more severe clinical and laboratory
parameters, while pneumococcal and viral etiologies are more
common, compared with AECOPD patients without pneumonia. Several
studies also revealed that mortality is significantly higher in
pneumonic exacerbations than in non-pneumonic exacerbations
(28,31). The present study, however, showed no
significant differences in the risk of mortality, the number of
main symptoms of AECOPD, body temperature, CRB-65 score, WBC count
and N% between AECOPD patients with and without lung
infiltration.
The difference in the clinical significance of lung
infiltration between CT imaging and chest radiography may be due to
the small lung infiltration foci in CT not having definite clinical
significance; these foci are too inconspicuous to be noticed on
chest radiographs (29,32). The current results suggested that the
gap between AECOPD patients with and without lung infiltration is
not large. In addition, there may be a continuous spectrum between
pure AECOPD and AECOPD complicated by pneumonia.
The lung infiltration during AECOPD is not
necessarily associated with the exacerbation. For instance, in the
study by Lieberman et al (27), 15% of the chest radiographs of AECOPD
inpatients during exacerbation indicated pneumonia, although only
10% of the patients were classified as having pneumonia compared
with the follow-up radiograph. In the present study, 24/39 patients
(61.5%) with AECOPD were observed to have lung infiltration on CT
images during the exacerbation, and 23/39 patients (59.0%) with
AECOPD were assessed as having lung infiltration associated with
the exacerbation, which were at least partly absorbed. This may be
due to the misclassification of fibroproliferative foci and
vascular texture as lung infiltration on radiographs. Furthermore,
we hypothesize that CT may be more sensitive than chest radiography
in detecting the absorption of lung infiltration. Among the
different patterns of lung infiltration, the ground-glass
attenuation with lobular distribution, air space consolidation with
lobular distribution, and small foci may not always be associated
with the exacerbation; however, the consolidation with segmental
distribution and large foci are more likely to be associated with
the exacerbation.
The WBC count and N% indicated bacterial infection.
In the present study, the existence and the extent of consolidation
with segmental distribution were correlated with the N% value,
whereas the existence and the extent of acinar shadow, air space
consolidation with lobular distribution, ground-glass attenuation
and thickening of the ILS were not correlated. The total volume of
lung parenchymal infiltration was also correlated with the WBC
count and N%. This finding suggested that consolidation with
segmental distribution, rather than other types of lung
infiltration, may be associated with bacterial infection. The total
volume of lung parenchymal infiltration may be associated with the
severity of bacterial infection. This result is consistent with the
findings of previous studies, such as Tanaka et al (18) which revealed that bacterial pneumonia
frequently manifested as air space consolidation with segmental
distribution, whereas atypical pneumonia frequently manifested as
centrilobular shadow, acinar shadow, air space consolidation with
lobular distribution and ground-glass attenuation with lobular
distribution.
There are several limitations in the present study.
Firstly, the sample size was rather small. In addition, the
etiological diagnosis was unavailable for the patients with AECOPD
in the emergency department. The etiology of the exacerbation can
only be conjectured from its clinical manifestation, fever and
routine blood tests. Furthermore, a biopsy was not applicable for
patients with AECOPD, therefore, radiological and pathological
correlations could not be shown. Finally, CT images prior to the
exacerbation were unavailable.
In conclusion, the present study demonstrated that
during AECOPD, the WA%, mean wall and peak wall attenuations
increased and the Ai tended to decrease; however, the emphysema
extent did not change. Approximately 60% of patients presented lung
infiltration on CT images. The consolidation with segmental
distribution may be associated with bacterial infection; however,
acinar shadow and air space consolidation with lobular distribution
may not have an evident clinical significance.
Acknowledgements
This study was funded by grants from the Chronic
Disease Prevention and Treatment Programme of the Shanghai ShenKang
Hospital Development Centre, Shanghai, China (no. SHDC12012305) and
the 11th National 5-year Development Plan (no. 2008BAI52B00).
Glossary
Abbreviations
Abbreviations:
|
AECOPD
|
acute exacerbation of COPD
|
|
Ai
|
inner lumen area
|
|
Ao
|
outer area of the bronchus
|
|
COPD
|
chronic obstructive pulmonary
disease
|
|
CT
|
computed tomography
|
|
FEV1
|
forced expiratory volume in 1 sec
|
|
ILS
|
interlobular septa
|
|
N%
|
neutrophil percentage
|
|
WA%
|
wall area percentage
|
|
WBC
|
white blood cell
|
|
WT
|
wall thickness
|
References
|
1
|
Lopez AD, Shibuya K, Rao C, Mathers CD,
Hansell AL, Held LS, Schmid V and Buist S: Chronic obstructive
pulmonary disease, Current burden and future projections. Eur
Respir J. 27:397–412. 2006. View Article : Google Scholar : PubMed/NCBI
|
|
2
|
Global Strategy for the Diagnosis,
Management and Prevention of Chronic Obstructive Pulmonary Disease,
Global Initiative for Chronic Obstructive Lung Disease (GOLD).
2011.Available from: http://www.goldcopd.org/ and. http://www.goldcopd.org/uploads/users/files/GOLD_Report_2011_Feb21.pdf
|
|
3
|
Hogg JC and Timens W: The pathology of
chronic obstructive pulmonary disease. Annu Rev Pathol. 4:435–459.
2009. View Article : Google Scholar : PubMed/NCBI
|
|
4
|
Szilasi M, Dolinay T, Nemes Z and Strausz
J: Pathology of chronic obstructive pulmonary disease. Pathol Oncol
Res. 12:52–60. 2006. View Article : Google Scholar : PubMed/NCBI
|
|
5
|
Hogg JC: Pathophysiology of airflow
limitation in chronic obstructive pulmonary disease. Lancet.
364:709–721. 2004. View Article : Google Scholar : PubMed/NCBI
|
|
6
|
Snider GL: Chronic obstructive pulmonary
disease - a continuing challenge. Am Rev Respir Dis. 133:942–944.
1986.PubMed/NCBI
|
|
7
|
Dunnill MS, Massarella GR and Anderson JA:
A comparison of the quantitative anatomy of the bronchi in normal
subjects, in status asthmaticus, in chronic bronchitis, and in
emphysema. Thorax. 24:176–179. 1969. View Article : Google Scholar : PubMed/NCBI
|
|
8
|
Litmanovich D, Boiselle PM and Bankier AA:
CT of pulmonary emphysema - current status, challenges, and future
directions. Eur Radiol. 19:537–551. 2009. View Article : Google Scholar : PubMed/NCBI
|
|
9
|
Nakano Y, Wong JC, de Jong PA, Buzatu L,
Nagao T, Coxson HO, Elliott WM, Hogg JC and Paré PD: The prediction
of small airway dimensions using computed tomography. Am J Respir
Crit Care Med. 171:142–146. 2005. View Article : Google Scholar : PubMed/NCBI
|
|
10
|
Nakano Y, Muro S, Sakai H, Hirai T, Chin
K, Tsukino M, Nishimura K, Itoh H, Paré PD, Hogg JC and Mishima M:
Computed tomographic measurements of airway dimensions and
emphysema in smokers. Histopathology. Am J Respir Crit Care Med.
162:1102–1108. 2000. View Article : Google Scholar : PubMed/NCBI
|
|
11
|
Perera PN, Armstrong EP, Sherrill DL and
Skrepnek GH: Acute exacerbations of COPD in the United States,
Inpatient burden and predictors of costs and mortality. COPD.
9:131–141. 2012. View Article : Google Scholar : PubMed/NCBI
|
|
12
|
Burge S and Wedzicha JA: COPD
exacerbations: Definitions and classifications. Eur Respir J
(Suppl). 41:S46–S53. 2003.
|
|
13
|
Miller MR, Hankinson J, Brusasco V, Burgos
F, Casaburi R, Coates A, Crapo R, Enright P, van der Grinten CP,
Gustafsson P, et al: ATS/ERS Task Fore: Standardisation of
spirometry. Eur Respir J. 26:319–38. 2005. View Article : Google Scholar : PubMed/NCBI
|
|
14
|
Han MK, Kazerooni EA, Lynch DA, Liu LX,
Murray S, Curtis JL, Criner GJ, Kim V, Bowler RP, Hanania NA, et
al: COPD Gene Investigators: Chronic obstructive pulmonary disease
exacerbations in the COPD Gene study: Associated radiologic
phenotypes. Radiology. 261:274–282. 2011. View Article : Google Scholar : PubMed/NCBI
|
|
15
|
Estepar RSJ, Washko GG, Silverman EK,
Reilly JJ, Kikinis R and Westin CF: Airway inspector: An open
source application for lung morphometry in First International
Workshop on Pulmonary Image Processing. New York City, USA:
293–302. 2008.
|
|
16
|
Yamashiro T, Matsuoka S, Estépar RS,
Dransfield MT, Diaz A, Reilly JJ, Patz S, Murayama S, Silverman EK,
Hatabu H and Washko GR: Quantitative assessment of bronchial wall
attenuation with thin-section CT, An indicator of airflow
limitation in chronic obstructive pulmonary disease. AJR Am J
Roentgenol. 195:363–369. 2010. View Article : Google Scholar : PubMed/NCBI
|
|
17
|
Martinez CH, Chen YH, Westgate PM, Liu LX,
Murray S, Curtis JL, Make BJ, Kazerooni EA, Lynch DA, Marchetti N,
et al: COPD Gene Investigators: Relationship between quantitative
CT metrics and health status and BODE in chronic obstructive
pulmonary disease. Thorax. 67:399–406. 2012. View Article : Google Scholar : PubMed/NCBI
|
|
18
|
Tanaka N, Matsumoto T, Kuramitsu T, Nakaki
H, Ito K, Uchisako H, Miura G, Matsunaga N and Yamakawa K: High
resolution CT findings in community-acquired pneumonia. J Comput
Assist Tomogr. 20:600–608. 1996. View Article : Google Scholar : PubMed/NCBI
|
|
19
|
Kothari RU, Brott T, Broderick JP, Barsan
WG, Sauerbeck LR, Zuccarello M and Khoury J: The ABCs of measuring
intracerebral hemorrhage volumes. Stroke. 27:1304–1305. 1996.
View Article : Google Scholar : PubMed/NCBI
|
|
20
|
Washko GR, Dransfield MT, Estépar RS, Diaz
A, Matsuoka S, Yamashiro T, Hatabu H, Silverman EK, Bailey WC and
Reilly JJ: Airway wall attenuation, A biomarker of airway disease
in subjects with COPD. J Appl Physiol (1985). 107:185–191. 2009.
View Article : Google Scholar : PubMed/NCBI
|
|
21
|
Lederlin M, Laurent F, Dromer C, Cochet H,
Berger P and Montaudon M: Mean bronchial wall attenuation value in
chronic obstructive pulmonary disease, Comparison with standard
bronchial parameters and correlation with function. AJR Am J
Roentgenol. 198:800–808. 2012. View Article : Google Scholar : PubMed/NCBI
|
|
22
|
Hasegawa M, Nasuhara Y, Onodera Y, Makita
H, Nagai K, Fuke S, Ito Y, Betsuyaku T and Nishimura M: Airflow
limitation and airway dimensions in chronic obstructive pulmonary
disease. Am J Respir Crit Care Med. 173:1309–1315. 2006. View Article : Google Scholar : PubMed/NCBI
|
|
23
|
Tanabe N, Muro S, Hirai T, Oguma T, Terada
K, Marumo S, Kinose D, Ogawa E, Hoshino Y and Mishima M: Impact of
exacerbations on emphysema progression in chronic obstructive
pulmonary disease. Am J Respir Crit Care Med. 183:1653–1659. 2011.
View Article : Google Scholar : PubMed/NCBI
|
|
24
|
de Jong YP, Uil SM, Grotjohan HP, Postma
DS, Kerstjens HA and van den Berg JW: Oral or IV prednisolone in
the treatment of COPD. exacerbations. A randomized, controlled,
double-blind study. Chest. 132:1741–1747. 2007. View Article : Google Scholar : PubMed/NCBI
|
|
25
|
Aaron SD, Vandemheen KL, Hebert P, Dales
R, Stiell IG, Ahuja J, Dickinson G, Brison R, Rowe BH, Dreyer J, et
al: Outpatient oral prednisone after emergency treatment of chronic
obstructive pulmonary disease. N Engl J Med. 348:26182003.
View Article : Google Scholar : PubMed/NCBI
|
|
26
|
Maltais F, Ostinelli J, Bourbeau J, Tonnel
AB, Jacquemet N, Haddon J, Rouleau M, Boukhana M, Martinot JB and
Duroux P: Comparison of nebulized budesonide and oral prednisolone
with placebo in the treatment of acute exacerbations of chronic
obstructive pulmonary disease, A randomized controlled trial. Am J
Respir Crit Care Med. 165:6982002. View Article : Google Scholar : PubMed/NCBI
|
|
27
|
Lieberman D, Lieberman D, Gelfer Y,
Varshavsky R, Dvoskin B, Leinonen M and Friedman MG: Pneumonic vs
nonpneumonic acute exacerbations of COPD. Chest. 122:1264–1270.
2002. View Article : Google Scholar : PubMed/NCBI
|
|
28
|
Myint PK, Lowe D, Stone RA, Buckingham RJ
and Roberts CM: U.K. Histopathology. Respiration. 82:320–327. 2011.
View Article : Google Scholar : PubMed/NCBI
|
|
29
|
Hayden GE and Wrenn KW: Chest radiograph
vs. Histopathology. J Emerg Med. 36:266–270. 2009. View Article : Google Scholar : PubMed/NCBI
|
|
30
|
Mandell LA, Wunderink RG, Anzueto A,
Bartlett JG, Campbell GD, Dean NC, Dowell SF, File TM Jr, Musher
DM, Niederman MS, et al: Infectious Diseases Society of America;
American Thoracic Society: Infectious Diseases Society of
America/American Thoracic Society consensus guidelines on the
management of community-acquired pneumonia in adults. Clin Infect
Dis. 44((Suppl 2)): S27–S72. 2007. View
Article : Google Scholar : PubMed/NCBI
|
|
31
|
Steer J, Norman EM, Afolabi OA, Gibson GJ
and Bourke SC: Dyspnoea severity and pneumonia as predictors of
in-hospital mortality and early readmission in acute exacerbations
of COPD. Thorax. 67:117–121. 2012. View Article : Google Scholar : PubMed/NCBI
|
|
32
|
Syrjälä H, Broas M, Suramo I, Ojala A and
Lähde S: High-resolution computed tomography for the diagnosis of
community-acquired pneumonia. Clin Infect Dis. 27:358–363. 1998.
View Article : Google Scholar : PubMed/NCBI
|