Introduction
The Chinese herbal formulation Jianpijiedu (JPJD),
also known as Fuzheng Jiedu, has been proposed as a complementary
therapy for the treatment of hepatocellular carcinoma due to its
ability to enhance the absorption and transportation of nutrients
and to reduce tumor burden. A randomized clinical trial of patients
with hepatocellular carcinoma has shown that this formulation can
effectively promote quality of life and liver function if combined
with intra-arterial chemotherapy (1). Furthermore, studies have indicated that
JPJD can improve survival time, reduce pulmonary metastasis
(2) and maintain the body and
visceral weight of nude mice transplanted with human hepatocellular
carcinoma tissue (3). These previous
findings indicate that JPJD may be able to improve digestive and
absorptive functions and the quality of life in patients with
hepatocellular carcinoma.
Decreased food intake and diarrhea are common
clinical symptoms in patients with hepatocellular carcinoma, and
may lead to compromised immunity, acceleration of tumor growth and
nutrient deprivation (4–6). Differences in the expression of T cell
receptor Vβ-chain complementarity-determining region 3 (TCRVβCDR3),
which indicates the status of cell-mediated immunity, occur rapidly
following the immunological recognition of endogenous and exogenous
antigens by the immune system in malignant tumors (7–9).
However, few studies have investigated the changes in the TCRVβCDR3
repertoire in hepatocellular carcinoma.
In the present study, a food restriction combined
with laxative (FRL) rat model was established by alternate-day food
restriction (10,11) and the oral administration of
Glauber's salt (sodium sulfate; Na2SO4)
(12). The purpose of this was to
model the nutritional and digestive symptoms of patients with
hepatocellular carcinoma, which include diarrhea, vomiting and
anepithymia, and are relevant to a loss of immune function. On the
basis of this, the orthotopic hepatocellular carcinoma (OHC) model
was established (13,14). Subsequently, the FRL-OHC-model
animals received JPJD or thymopentin-5 (TP5) treatment. Differences
in the TCRVβCDR3 repertoires in the thymus, liver and
hepatocellular carcinoma tissues of the rats were analyzed to
elucidate the immunological mechanism underlying the anti-hepatoma
effects of JPJD.
Materials and methods
Experimental animals and cell
lines
This study was performed at the Medical Science
Experimentation Center of the Zhongshan School of Medicine of Sun
Yat-Sen University (Guangzhou, China). Male specific pathogen-free
(SPF) Lewis rats (age, 3–4 weeks; weight, 70±15 g) were purchased
from the Beijing Vital River Laboratory Animal Technology Co., Ltd.
(Beijing, China). Male SPF BALB/c nude rats (age, 4–6 weeks;
weight, 15±2 g) were purchased from the Guangdong Medical
Laboratory Animal Center (Guangzhou, China). All animals were
housed according to the national animal treatment guidelines
(http://www.gov.cn/gongbao/content/2011/content_1860757.htm)
and all experimental procedures were approved by the Committee on
the Use of Live Animals for Teaching and Research of Sun Yat-Sen
University and the Ethics Committee of the First Affiliated
Hospital of Sun Yat-Sen University [Approval no. Ethical
application (2013) No. 149]. The Walker 256 cell line was acquired
from the Cell Bank of the Laboratory Center of Sun Yat-Sen
University. Glauber's salt (Guangzhou Pharmaceuticals Corporation,
Guangzhou, China) containing 99.0% Na2SO4 was
dissolved in ultraviolet (UV)-disinfected saline to a concentration
of 2 g/ml.
Medicinal reagents
A Glauber's salt solution was prepared, as described
above. Concentrated JPJD cream was prepared, which was composed of
30 g Codonopsis (root), 15 g Poria, 15 g
Atractylodes (root), 6 g liquorice (Glycyrrhiza
glabra), 12 g Bupleurum (root) 15 g Curcuma
(root) and 30 g Scutellaria barbata (stem and leaf), which
were obtained from China Resources Sanjiu Medical &
Pharmaceutical Co., Ltd., Beijing, China). The sources, which were
identified according to the first part of the 1998 Chinese
Pharmacopoeia and combined according to the established ratio
(12), were concentrated using water
extraction and volatile oil collection. These procedures were
performed at the Science and Technology Industrial Park of
Guangzhou University of Chinese Medicine (Guangzhou, China).
Finally, the JPJD formulation was diluted into a concentrated
aqueous cream that contained 2 g crude components per ml. TP5
solution (10 mg; license no. H20058462; cat no. 20130806; Beijing
ShuangLu Pharmaceutical Co., Ltd., Beijing, China) was utilized for
injection.
Devices and reagents
TRIzol® reagent (15596-026; Thermo Fisher
Scientific, Shanghai, China); polymerase chain reaction (PCR)
amplification kit (DR011; Takara Biotechnology Co., Ltd., Dalian,
China); Hi-Di Formamide (Lot no. 1305031; serial no. 4404307),
GeneScan™ 600 LIZ® (Lot no. 1206023; serial no. 4408399) and an
Applied Biosystems 3500xL Genetic Analyzer (Thermo Fisher
Scientific); and GeneMarker® Genotyping software, version 2.2
(SoftGenetics LLC, State College, PA, USA) were used.
Primer sequences for TCRVβCDR3
analysis
The primer sequences were as reported in a previous
study by Douillard et al (15). They were synthesized using an ABI
3900 desktop high-throughput DNA synthesizer (Thermo Fisher
Scientific).
Study design
Male Lewis rats (age, 3–4 weeks), which were housed
under a temperature of 24–26°C at a 12-h light/dark cycle, were
randomized into five groups (n=15 per group) as follows: i) Control
group (group A), animals received 1 ml/100 g normal saline per day
intragastrically; ii) FRL-OHC group (group B), animals received
treatment to establish the FRL-OHC model; iii) low dose JPJD group
(group C), animals received treatment to establish the FRL-OHC
model and the intragastric administration of 37.5 g/kg JPJD per
day; iv) high dose JPJD group (group D), animals received treatment
to establish the FRL-OHC model and the intragastric administration
of 75 g/kg JPJD per day; and v) TP5 group (group E), animals
received treatment to establish the FRL-OHC model, an intramuscular
injection of 5 mg TP5 every 48 h and 1 ml/100 g normal saline per
day intragastrically. All rats were fed simultaneously. The FRL
model establishment procedure was terminated for animals in groups
B-E after 29 days. Following 7 days of free feeding, the OHC model
was then established in the relevant groups. Similarly, there was
17 days of free feeding and observation. Liver, thymus and
hepatocellular carcinoma samples were collected under anesthesia
immediately after the rats with OHC reached the ethical limits for
animal experimentation (lethargy, erect back hair, relative body
mass of 80%, fever or ascites). Anesthesia was induced via an
intraperitoneal injection of 10% chloral hydrate (3.5 ml/kg;
Sigma-Aldrich Shanghai Trading Co., Ltd., Shanghai, China). Samples
were stored at −80°C prior to analysis. Apparent FRL scale scores
and body mass were recorded daily in each group. Hepatocellular
carcinoma volume was calculated as follows: Maximal diameter (mm) ×
minimal diameter (mm)2/2. Visceral indices were
calculated as follows: Weight of the cancer-bearing liver or thymus
(g) or hepatocellular carcinoma volume × 100/final body weight (g).
Following the completion of the study, three rats from each group
were selected and their thymus, liver and hepatocellular carcinoma
tissues were harvested from the anesthetized rats to analyze the
spectral-type diversity of TCRVβCDR3 repertoire. For group A, the
three rats were selected at random, while for the other groups,
three rats with a maximal hepatocellular carcinoma diameter ≥10 mm
were selected from each group.
Establishment of the FRL model
Rats were housed individually at 23±1°C with a 12–12
h light-dark cycle and a feeding regimen of tap water ad
libitum and alternate-day food restriction (11). Rats received food between 9:00 a.m.
one day to 9:00 a.m. the following day. For the following 24 h, the
rats received water only. The rat diet accorded with the National
Standard of China, and consisted of water (10%), crude protein
(18%), crude fat (4%), crude fiber (5%), crude ash (8%), calcium
(1.2%) and phosphorus (1%). For each feeding period, 200 g food was
administered and the remaining food was measured on the next day to
calculate the food intake per 100 g body mass. Glauber's salt
solution (0.25 g/ml) (12) was
administered daily (1 ml/100 g) via oral gavage for 29 days prior
to feeding. The effect of the FRL modeling was evaluated according
to the apparent FRL scale (Table I)
based on factors including the degree of weight loss, tail
cleanliness and hair color and aggregation.
 | Table I.Evaluation of the apparent indices of
the food restriction combined with laxative model. |
Table I.
Evaluation of the apparent indices of
the food restriction combined with laxative model.
|
| Grading |
|---|
|
|
|
|---|
| Index | 1 | 2 | 3 | 4 |
|---|
| Relative body mass
(%) | ≥95 | 90–94 | 85–89 | <85 |
| Mental state | Normal | Irritable | Lethargic | Somnolent |
| Chill or fever | Normal | Curled up | Chill | Arched back,
trembling |
| Breathing | Normal | Panting | Dyspnea | Faint |
| Hair | Normal | Matted | Fluffy erect
hair | Brown erect hair |
| Feces | Normal | Loose | Wet and loose | Mucous |
In the apparent FRL model scale, the grading
criterion for relative body mass was developed according to the
limitation of 20% human weight loss (16). During the establishment of the FRL
model, rats in groups A and B were matched according to weight
(weight difference, ±5 g) for calculation of the relative body mass
(FRL rat weight/normal rat weight as a percentage). During the
period of FRL-OHC model establishment, the rats were 8–9 weeks old
and their weight gain reduced, thus another equation was required:
Relative body mass = final weight/weight prior to establishment of
the model. A total score of ≤6 on the apparent FRL model scale was
considered to be asymptomatic, 7–12 was mildly symptomatic, 13–18
was typically symptomatic and 19–24 was severely symptomatic.
Establishment of the OHC model
The OHC model was established according to
previously described procedures (13,14). In
brief, Walker-256 cells (1×10⁷) were transplanted
subcutaneously by an injection made in the neck of nude BALB/c
rats. Tumors were harvested after reaching a diameter of >1 cm.
First, the animals were anesthetized via an intraperitoneal
injection of 10% chloral hydrate (3.5 ml/kg; Sigma-Aldrich Shanghai
Trading Co., Ltd., Shanghai, China), then the thoracic and
abdominal cavities were opened and the tissues or organs were
carefully removed. Following the removal of necrotic tissue, the
tumor tissues were cut into 1-mm3 pieces. The tissue
fragments were then implanted into the FRL model Lewis rats to
establish the OHC model. Under inhalation anesthesia, a vertical
incision under the xiphoid was cut after sterilization. Inhalation
anesthesia was induced as follows: 4 ml ether (Tianjin Damao
Chemical Reagent Factory, Tianjin, China) were transferred to a
15-ml centrifuge tube (Becton Dickinson Medical Devices, Shanghai,
Co Ltd, Shanghai, China) and a cotton ball (Winner Medical Co.
Ltd., Shenzhen, China) was added and left to soak. Following
soaking, the cotton ball was moved close to the nose of the animal
inducing anesthesia. The anesthetic procedure lasted for a maximum
of 3 min. Subsequently, the liver of the rat was exposed and cancer
tissues were implanted using a 1-mm coarse needle (Cat. no. 305198;
Becton Dickinson Medical Devices Shanghai Co., Ltd., Shanghai,
China). Finally, the abdominal cavity was closed layer by layer
after hemostasis was achieved.
Detection of TCRVβCDR3 repertoire
Total RNA extraction, PCR analysis and TCRVβCDR3
repertoire detection were performed according to methods described
by Douillard et al (15) and
Venturi et al (17). An ABI
3500xL Genetic Analyzer was used for fragment analysis of the
TCRVβCDR3 repertoire according to the manufacturer's instructions
(18).
TCRVβCDR3 type analysis
TCRVβCDR3 fragment analysis data obtained using the
ABI 3500xL and GeneScan™ 600 LIZ® was imported into GeneMarker
software, version 2.2 (19). The
spectral diagram and related data of the 20 gene fragments of the
TCRVβCDR3 subfamily were obtained.
Data analysis of the TCRVβCDR3
repertoire
The diversities of the TCRVβCDR3 repertoire in the
thymus, liver and cancerous tissues in each group were compared
with the normal repertoire diversity and fragment sizes in the
thymus tissue in the control group (17,20).
Fluorescence peaks and their data that did not correspond to the
sites of the various TCRVβCDR3 subfamilies of the normal thymus
tissue were deleted to retain comparability between the groups.
Clonal types of the TCRVβCDR3 subfamily were
confirmed visually by three independent researchers. The normal
spectral-type of the TCRVβCDR3 subfamilies is a bell-shaped
quasi-Gaussian distribution; however, other non-Gaussian
distributions may appear, including a skewed-peak type, a no clonal
type (no peak detected) and a monoclonal type (one peak
detected).
Three samples were analyzed for each group. The
results indicated that for each group, the TCRVβCDR3 subfamily
spectral-types, expressed and unexpressed, of the thymus, liver and
cancerous tissues of the three samples were identical. During data
analysis, the number of the TCRVβCDR3 subfamilies, expressed and
unexpressed, was used as the raw data. Medians of the numbers of
the fluorescence peaks and clonal types (quasi-Gaussian
distribution, skewed-peak and monoclonal type) were used, while
means of Simpson's diversity index (Ds), area under the
fluorescence peak and relative fluorescence intensity of the each
peak were used for the analysis. The relative fluorescence
intensity (RI) was determined using the following formula: RI (%) =
(100 × area under the fluorescence peak of the target
fragment)/(total area under the fluorescence peak of the complete
subfamily). In the calculations, the area under the fluorescence
peak was expressed as 1×10⁻³ of the original value, and
the Ds value was expressed as 100-fold of the original value. As
these data involved only three samples, they were not analyzed
using statistical tests.
Statistical analysis
Data were analyzed using SPSS software, version 17.0
(SPSS, Inc., Chicago, IL, USA). Continuous measurement data were
expressed as the mean ± standard deviation. Analysis of variance
was used for the normally distributed measurement data. Rank sum
tests and Kaplan-Meier survival analysis were used for the
non-normally distributed measurement data. P<0.05 was considered
to indicate a statistically significant difference.
Results
General condition of the animals
Apparent FRL scale scores
The apparent FRL scale scores of the animals in
each group are presented in
Table
II
The apparent FRL scale score of the animals in group
A was <6 due to normal feeding without any intervention, while
the scores of the rats in groups B, C, D and E indicated that their
symptoms were moderate or severe.
Anatomical indices and differences in body
weight
The anatomical indices and changes of body weight
are presented in Table III. An
evident reduction in body weight gain was observed due to FRL model
establishment. The hepatocellular carcinoma volume (with the
exception of group A) and the hepatic and thymus indices of the
animals were observed to be similar in groups A, C and D, and
reduced compared with those in groups B and E. The body weight gain
was significantly increased in group A compared with the other
groups. In the rats subjected to OHC modeling, the body weight loss
of the rats in group B was the greatest while the body weight loss
of the rats in groups D and E was the lowest among the groups.
| Table III.Viscera index and changes in body
weight during model establishment (mean ± standard deviation). |
Table III.
Viscera index and changes in body
weight during model establishment (mean ± standard deviation).
|
|
|
|
| Body weight
change |
|---|
|
|
|
|
|
|
|---|
| Group | Hepatocellular
carcinoma volume index (mm3/g) | Hepatic index | Thymus index | FRL model | OHC model |
|---|
| A | – | 3.62±0.30 | 0.09±0.03 | 68.42±7.93 | 58.25±10.66 |
| B |
2.28±0.48a |
4.20±0.80a | 0.10±0.02 |
14.25±11.35b |
−19.25±11.79b |
| C | 1.77±0.64 | 3.86±0.34 | 0.09±0.02 |
12.33±15.64b |
−6.17±8.61b,c |
| D | 1.76±1.49 | 3.74±0.30 | 0.09±0.02 |
13.80±21.44b |
−2.2±2.95b–d |
| E |
2.22±0.59a |
4.21±0.49a | 0.10±0.02 |
14.75±11.47b |
−3.25±8.88b–d |
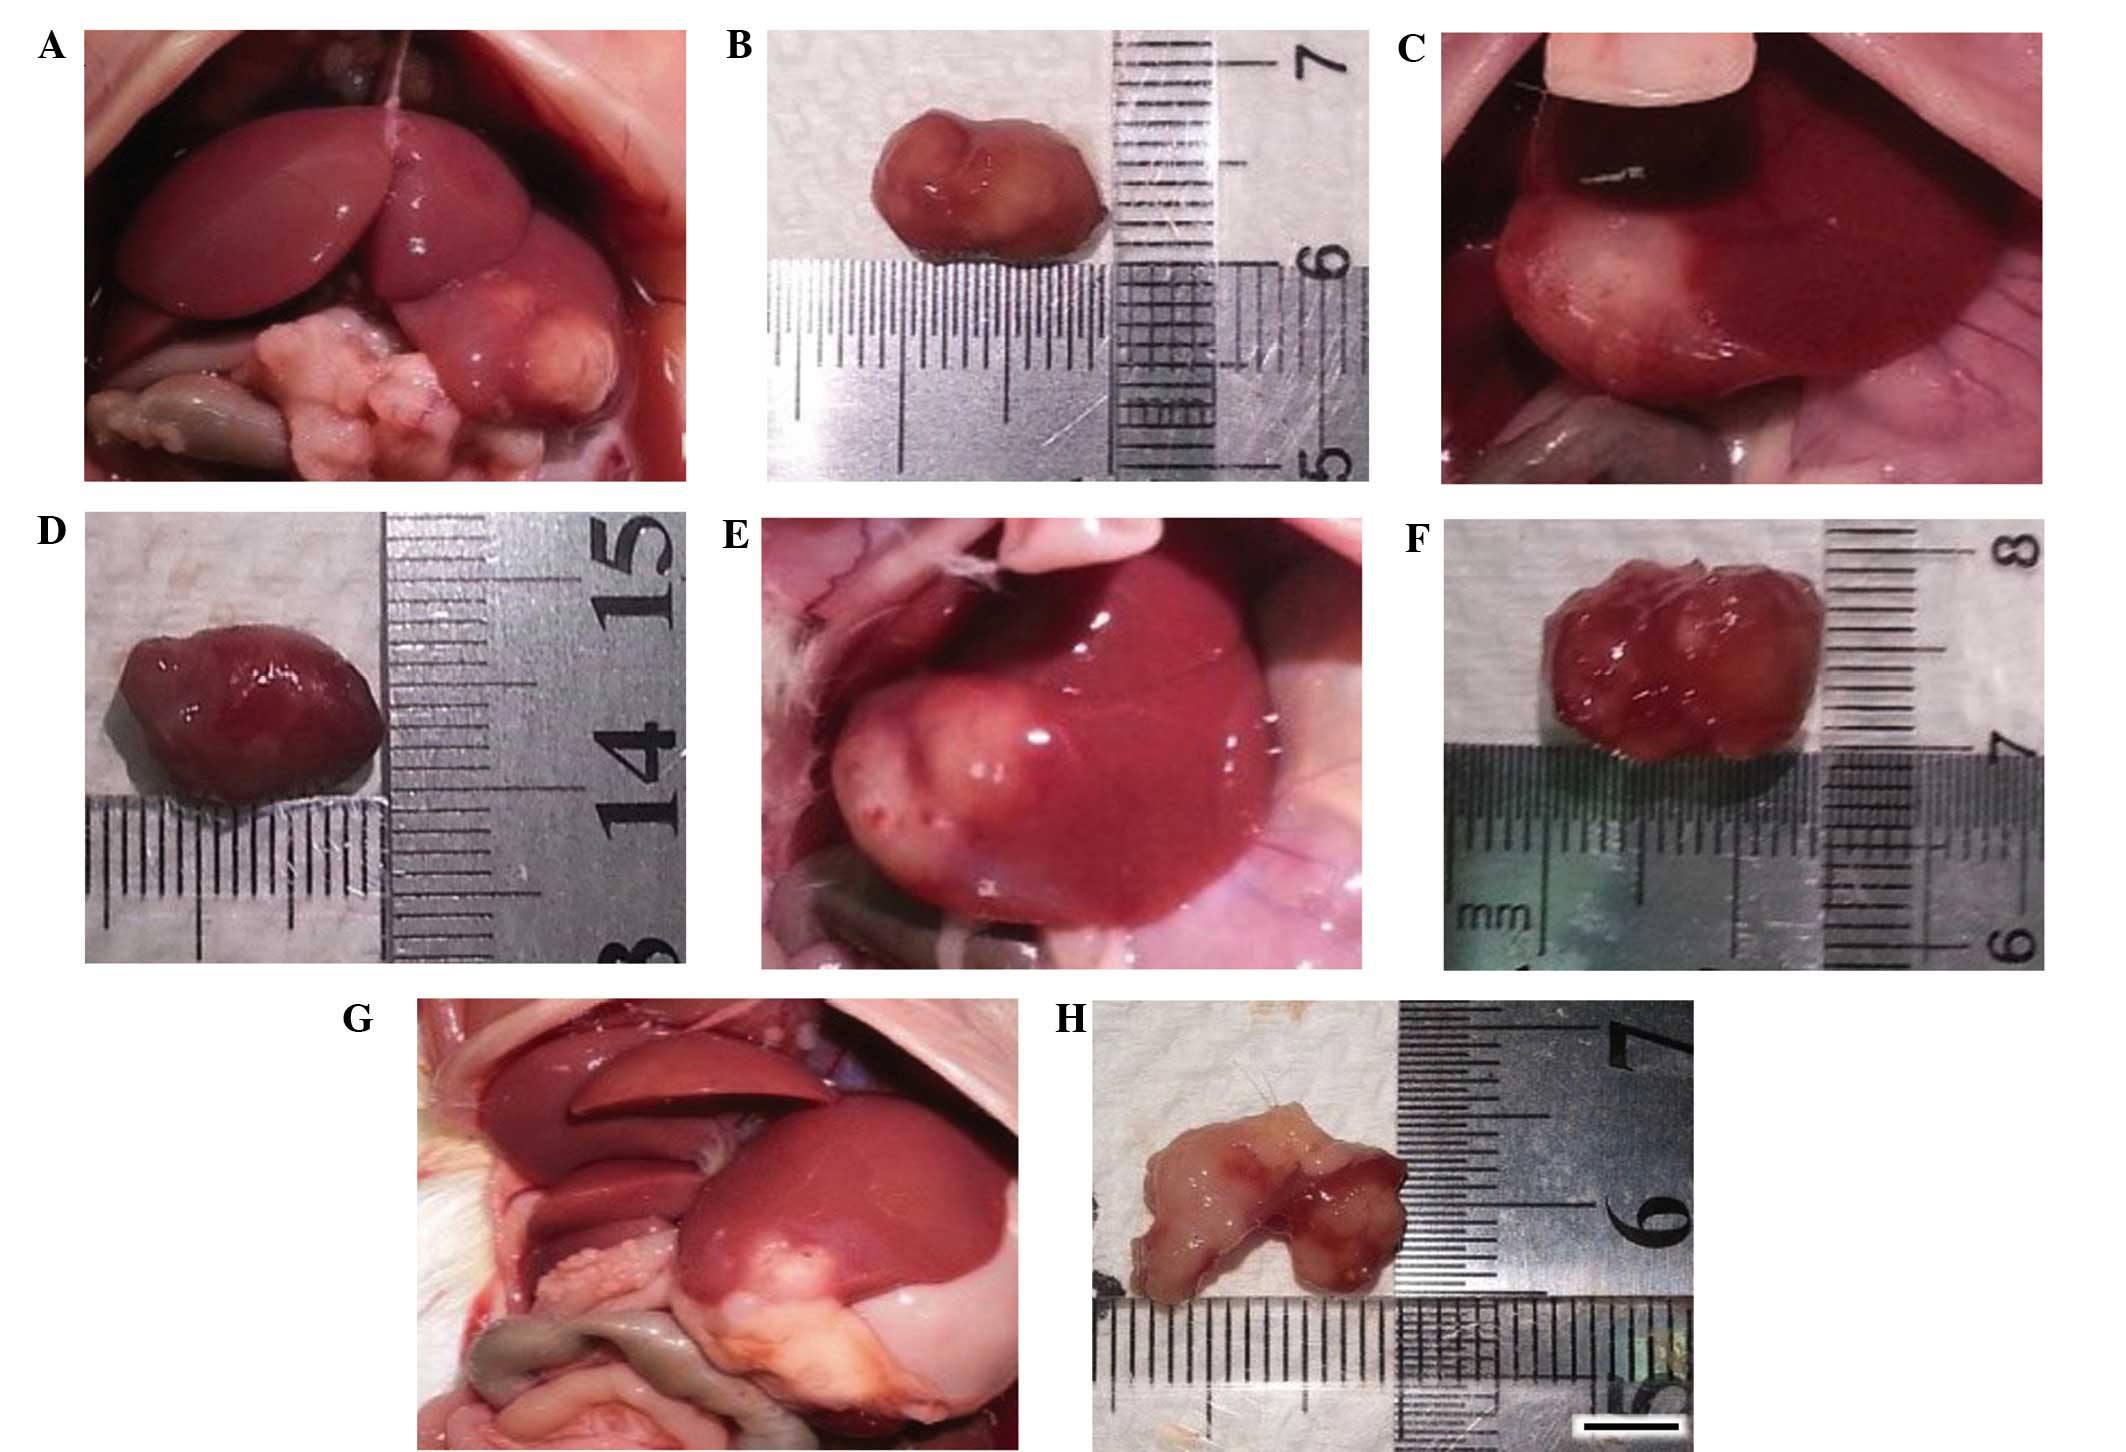
Hepatocellular carcinoma growth
The growth states of representative hepatocellular
carcinoma on day 17 in each group are presented in Fig. 1.
Spectral-type diversity of the
TCRVβCDR3 repertoire
Overview of the repertoire diversity of the
TCRVβCDR3 subfamily
A total of 20 TCRVβCDR3 subfamily repertoires were
obtained from the normal thymus tissue and 19 from the normal liver
tissue. Fragment sizes varied between 100 and 250 bp, and had a
quasi-Gaussian distribution (a normal or bell-shaped distribution).
FRL, OHC and FRL-OHC model establishment factors reduced the number
of subfamily clonal types, expression of fragments, diversity of
the TCRVβCDR3 repertoire and the Gaussian distribution rate, and
increased the skewed-peak and monoclonal types.
Expression of TCRVβCDR3 clonal types in the
thymus, liver and cancer tissues
The TCRVβCDR3 subfamilies V1, V2, V4, V6, V8, V11,
V13, V15, V17 and V18 were expressed in all the three tissues types
in all the groups. By contrast, the subfamily V7 was expressed in
the thymus tissue of group A, but not in the other tissues of the
control group or in any of the tissues in groups B, C, D and E.
In total, there were 8 TCRVβCDR3 subfamilies that
were not expressed in the thymus tissue, and 13 not expressed in
the liver tissue (group E > group D = group B > group C >
group A). V3 was not expressed in groups C, D or E, while V16 was
not expressed in groups B, D or E. However, there was a total of 18
unexpressed TCRVβCDR3 subfamilies in the cancer tissue (group B
> group C = group D > group E). V3 was not expressed in
groups B, C or E while V10 and V16 were not expressed in groups B,
C or D (Table IV).
| Table IV.Unexpressed TCRVβCDR3
subfamilies. |
Table IV.
Unexpressed TCRVβCDR3
subfamilies.
| Group | Thymus | Liver | Cancer |
|---|
| A | None | V7 | – |
| B | V7, V12, V14, V19,
V20 | V5, V7, V16 | V3, V5, V7, V9,
V10, V16 |
| C | V7 | V3, V7 | V3, V7, V10, V12,
V16 |
| D | V7 | V3, V7, V16 | V7, V9, V10, V16,
V20 |
| E | V7 | V3, V7, V12,
V16 | V3, V7 |
Numbers of TCRVβCDR3 subfamily fragments
expressed in the thymus, liver and hepatocellular carcinoma
tissues
The total peak numbers indicated that TCRVβCDR3
diversity was the greatest in the thymus tissue, followed by the
liver tissue and the hepatocellular carcinoma tissue. Specifically,
the numbers of TCRVβCDR3 subfamily fragments in the various tissues
were as follows: Thymus tissue, group A > group C > group D
> group E > group B; liver tissue, group A > group D >
group C > group E > group B; and hepatocellular carcinoma
tissue, group E > group D > group C > group B (Table V).
| Table V.Number of TCRVβCDR3 subfamily
fluorescence peaks (median). |
Table V.
Number of TCRVβCDR3 subfamily
fluorescence peaks (median).
|
| Thymus | Liver | Cancer |
|---|
|
|
|
|
|
|---|
| Subfamily | A | B | C | D | E | A | B | C | D | E | B | C | D | E |
|---|
| V1 | 12 | 2 | 9 | 7 | 7 | 3 | 1 | 2 | 1 | 2 | 1 | 1 | 2 | 6 |
| V2 | 11 | 7 | 8 | 10 | 8 | 7 | 2 | 3 | 4 | 5 | 3 | 5 | 6 | 6 |
| V3 | 11 | 3 | 9 | 6 | 4 | 5 | 2 | 0 | 0 | 0 | 0 | 0 | 4 | 0 |
| V4 | 11 | 5 | 8 | 7 | 8 | 7 | 4 | 1 | 3 | 5 | 4 | 4 | 4 | 6 |
| V5 | 11 | 6 | 9 | 8 | 8 | 7 | 0 | 3 | 4 | 2 | 0 | 3 | 5 | 7 |
| V6 | 9 | 8 | 8 | 9 | 7 | 5 | 1 | 4 | 4 | 3 | 3 | 5 | 5 | 7 |
| V7 | 8 | 0 | 0 | 0 | 0 | 0 | 0 | 0 | 0 | 0 | 0 | 0 | 0 | 0 |
| V8 | 12 | 7 | 9 | 9 | 8 | 9 | 6 | 5 | 4 | 3 | 3 | 3 | 6 | 6 |
| V9 | 11 | 5 | 9 | 9 | 9 | 5 | 1 | 4 | 2 | 1 | 0 | 1 | 0 | 3 |
| V10 | 13 | 1 | 7 | 7 | 7 | 8 | 3 | 2 | 3 | 3 | 0 | 0 | 0 | 5 |
| V11 | 13 | 3 | 7 | 7 | 8 | 6 | 1 | 1 | 3 | 1 | 1 | 2 | 3 | 3 |
| V12 | 11 | 0 | 7 | 7 | 1 | 3 | 1 | 3 | 2 | 0 | 1 | 0 | 3 | 5 |
| V13 | 10 | 1 | 7 | 8 | 8 | 5 | 1 | 3 | 2 | 2 | 2 | 2 | 5 | 6 |
| V14 | 10 | 0 | 9 | 7 | 7 | 6 | 5 | 5 | 4 | 2 | 2 | 5 | 4 | 7 |
| V15 | 13 | 1 | 8 | 7 | 7 | 6 | 5 | 3 | 6 | 4 | 8 | 5 | 5 | 4 |
| V16 | 10 | 1 | 7 | 7 | 6 | 8 | 0 | 1 | 0 | 0 | 0 | 0 | 0 | 4 |
| V17 | 11 | 1 | 8 | 7 | 5 | 5 | 5 | 5 | 4 | 5 | 3 | 3 | 4 | 4 |
| V18 | 11 | 1 | 9 | 8 | 9 | 6 | 4 | 3 | 5 | 2 | 4 | 3 | 6 | 6 |
| V19 | 9 | 0 | 8 | 7 | 8 | 7 | 1 | 1 | 4 | 2 | 2 | 2 | 1 | 6 |
| V20 | 13 | 0 | 8 | 7 | 8 | 5 | 1 | 1 | 3 | 3 | 3 | 2 | 0 | 6 |
| Total | 220 | 52 | 154 | 144 | 133 | 113 | 44 | 50 | 58 | 45 | 40 | 46 | 63 | 97 |
Analysis of TCRVβCDR3 repertoire
diversity in the thymus, liver and hepatocellular carcinoma
tissues
TCRVβCDR3 repertoire Ds values in thymus, liver
and hepatocellular carcinoma tissues
The TCRVβCDR3 repertoire Ds values in the thymus and
liver tissues of group A were the highest among the groups.
Additionally, in group A the thymus tissues exhibited an increased
Ds value compared with the liver tissues. The Ds values of
TCRVβCDR3 subfamily repertoires in the various tissues were ranked
as follows: Thymus tissue, group A > group C = group D >
group E > group B; liver tissue, group A > group D > group
C > group E > group B; and hepatocellular carcinoma tissue,
group E > group D > group C > group B (Table VI).
| Table VI.Comparison of Ds in each group (mean
± standard deviation). |
Table VI.
Comparison of Ds in each group (mean
± standard deviation).
| Group | Thymus | Liver | Hepatocellular
carcinoma |
|---|
| A | 95.35±1.29 | 95.23±0.59 | – |
| B | 91.55±1.28 | 93.45±0.71 | 92.56±0.99 |
| C | 95.31±1.29 | 94.94±0.58 | 94.01±0.93 |
| D | 95.31±1.26 | 95.04±0.56 | 94.06±0.94 |
| E | 95.08±1.33 | 94.55±0.61 | 95.12±0.99 |
Comparison of TCRVβCDR3 clonal types in the
thymus, liver and hepatocellular carcinoma tissues
The percentages of TCRVβCDR3 clonal types fitting a
quasi-Gaussian distribution ranked as follows: Thymus tissue, group
A > group C = group D > group E > group B; liver tissue,
group A > group E > group D > group C > group B; and
hepatocellular carcinoma tissue, group D > group E > group C
> group B. The skewed-peak distributions were as follows: Thymus
tissue, group B > group E > group A = group C = group D;
liver tissue, group D > group E > group C > group A >
group B; and hepatocellular carcinoma tissues, group B > group E
> group C = group D. The monoclonal types were as follows:
Thymus tissues, group B > group E > group C = group D = group
A; liver tissues, group B > group C > group E > group D
> group A (Table VII).
| Table VII.TCRVβCDR3 subfamily clonal types as
evaluated using the visual method, n (%). |
Table VII.
TCRVβCDR3 subfamily clonal types as
evaluated using the visual method, n (%).
|
| Quasi-Gaussian
distribution | Skewed-peak
distribution | Monoclonal
type |
|---|
|
|
|
|
|
|---|
| Group | Thymus | Liver | Hepatocellular
carcinoma | Thymus | Liver | Hepatocellular
carcinoma | Thymus | Liver |
|---|
| A | 20 (100.0) | 8 (42.11) | – | 0 (0.00) | 11 (57.89) | – | 0 (0.00) | 0 (0.00) |
| B | 5
(33.33) | 2 (11.77) | 2 (14.29) | 4
(26.67) | 7
(41.18) | 9
(64.29) | 6 (40.00) | 8 (47.06) |
| C | 19 (100.0) | 3 (16.67) | 6 (40.00) | 0 (0.00) | 11 (61.11) | 7
(46.67) | 0 (0.00) | 4 (22.22) |
| D | 19 (100.0) | 3 (17.65) | 7 (46.67) | 0 (0.00) | 13 (76.47) | 7
(46.67) | 0 (0.00) | 1 (5.89) |
| E | 15 (78.95) | 3 (18.75) | 8 (44.44) | 3
(15.79) | 11 (68.75) | 10 (55.56) | 1 (5.26) | 2 (12.50) |
Areas under the shared TCRVβCDR3 subfamily
fluorescence peaks and maximal RI values of all subfamilies of the
thymus, liver and hepatocellular carcinoma tissues
Table VIII shows
that the areas under the shared TCRVβCDR3 subfamily fluorescence
peaks were ranked as follows: Thymus tissues, group A > group C
> group E > group D > group B; liver tissues, group A >
group D > group E > group C > group B; and hepatocellular
carcinoma tissues, group E > group D > group C > group B.
The maximal RI values of all the subfamilies were ranked as
follows: Thymus tissues, group B > group E > group D >
group C > group A; liver tissues, group B > group C >
group E > group D > group A; and hepatocellular carcinoma
tissues, group B > group C > group D > group E.
| Table VIII.Total areas under the shared
TCRVβCDR3 subfamily fluorescence peaksa and maximal RI values of all
subfamilies. |
Table VIII.
Total areas under the shared
TCRVβCDR3 subfamily fluorescence peaksa and maximal RI values of all
subfamilies.
|
| Thymus | Liver | Hepatocellular
carcinoma |
|---|
|
|
|
|
|
|---|
| Group | Area | RI | Area | RI | Area | RI |
|---|
| A |
6,539.42±2,325.22 | 25.54±2.64 |
1,238.38±438.79 | 37.30±11.05 | – | – |
| B |
37.71±29.44 |
62.39±34.44 |
33.35±30.35 | 69.04±31.28 |
34.99±28.52 | 63.88±24.48 |
| C |
817.60±155.43 | 27.99±4.20 |
47.86±18.69 | 61.85±26.07 |
56.10±22.23 | 56.36±22.64 |
| D | 332.44±98.89 | 28.05±5.06 |
67.17±31.63 | 50.77±19.59 |
72.75±32.92 | 53.90±20.51 |
| E |
479.34±198.84 |
34.96±16.61 |
56.76±38.88 | 56.16±22.78 | 104.55±62.34 | 37.96±12.06 |
Discussion
According to the theory of traditional Chinese
medicine, JPJD exerts certain effects, including enhancement of the
absorption and transportation of nutrient substances and an
antitumor effect (2). However,
previous studies have indicated that JPJD can effectively promote
quality of life and survival time, but is not able to directly
inhibit tumor growth (2,3). Therefore, a hepatocellular carcinoma
model based on food restriction combined with laxative (FRL)
administration was established in the present study in order to
investigate the immunological mechanism underlying the potential
anti-hepatoma effects of JPJD with TCRVβCDR3 as the suggested
target.
FRL-OHC model establishment was observed to
significantly inhibit the body weight gain of the rats, leading to
a compensatory increase of the viscera and the proliferation of
hepatocellular carcinoma. The JPJD treatment appeared to maintain
the body weight and viscera in a normal state and inhibit the
proliferation of hepatocellular carcinoma, while treatment with TP5
alone did not. JPJD and TP5 were individually able to alleviate the
body weight reduction in FRL-OHC model animals.
The analysis of unexpressed TCRVβCDR3 subfamilies
indicated that almost all TCRVβCDR3 subfamilies were expressed in
the normal thymus and liver tissues. The numbers of TCRVβCDR3
subfamilies expressed in the thymus, liver and hepatocellular
carcinoma tissues were significantly reduced by FRL-OHC modeling,
and increased by the JPJD and TP5 treatments. Furthermore, JPJD
increased the number of expressed TCRVβCDR3 subfamilies more
markedly compared with TP5 in the liver tissues, while TP5
increased them to a greater extent in the hepatocellular carcinoma
tissues.
FRL-OHC model establishment significantly reduced
the numbers of fragments, Ds values and areas under the shared
TCRVβCDR3 subfamily fluorescence peaks in the thymus, liver and
hepatocellular carcinoma tissues, and these effects were attenuated
by the JPJD and TP5 treatments. Specifically, JPJD increased the
number of fragments, Ds values and area under the shared TCRVβCDR3
subfamily fluorescence peaks to a greater extent than did TP5 in
the liver tissues, whereas TP5 increased these parameters more
markedly in the hepatocellular carcinoma tissues.
A Gaussian distribution of T cells represents the
normal situation in healthy individuals, whereas a skewed-peak
distribution is indicative of an abnormality, such as
immunoinflammatory condition, or clonal hyperplasia due to the
stimulating effect of a tumor (20).
Analysis of the clonal distributions in the present study indicated
that JPJD and TP5 treatments significantly improved the
quasi-Gaussian distribution rate of the TCRVβCDR3 subfamilies in
the FRL-OHC model animals, and the effects of the JPJD were more
marked compared with those of TP5. In addition, regarding the
polyclonal skewed-peak type distribution, JPJD and TP5 increased
the skewed-peak distribution of TCRVβCDR3 subfamilies in the liver
tissues, while reducing it in the hepatocellular carcinoma tissues.
Furthermore, JPJD reduced the monoclonal rates of TCRVβCDR3
subfamilies to a greater extent compared with TP5 in the liver and
thymus tissues. Similarly, the ability of JPJD to lower the RI
value was higher compared with that of TP5 in the thymus tissues,
while the RI value-lowering effect of TP5 was higher compared with
that of JPJD in the hepatocellular carcinoma tissues.
Total areas under the shared TCRVβCDR3 subfamily
fluorescence peaks were highest in the control group thymus
tissues, while the RI values in these tissues were the lowest
(25.54±2.64%) amongst all the groups. The results indicated that
TCRVβCDR3 subfamily fluorescence peaks have a bell-shaped
distribution in a normal situation. By contrast, the total areas
under the shared TCRVβCDR3 subfamily fluorescence peaks declined in
the FRL-OHC model rats, with an increased RI value and a loss of
the Gaussian distribution, which was normalized by the JPJD and TP5
treatments.
In conclusion, the effects of JPJD and TP5 in the
treatment of the FRL-OHC model animals and the diversity of the
TCRVβCDR3 repertoire were as follows. High-dose JPJD (75 g/kg)
exhibited an improved effect compared with that of the low-dose
JPJD (37.5 g/kg) treatment. Furthermore, the effect of JPJD on the
FRL-OHC model rats was improved compared with that of TP5; however,
further studies are recommended in order to elucidate the specific
mechanism underlying the effects of JPJD and TP5 on the diversity
of the TCRVβCDR3 repertoire. TP5 is an immune-regulating drug that
functions by stimulating the maturation and differentiation of T
cells, and has been well utilized as a complementary therapy for
the treatment of hepatocellular carcinoma (21–26). In
the present study, TP5 appeared to alter the diversity of the
TCRVβCDR3 repertoire; however, the underlying mechanism and
clinical value of this effect require further study.
Acknowledgements
This research was supported by grants from the
National Natural Science Foundation of China for Young Scholars
(grant no. 81102581), the National Natural Science Foundation of
China (grant no. 81373500) and the Administration of Traditional
Chinese Medicine of Guangdong Province (grant no. 20141046).
References
|
1
|
Chen ZX, Zhang SJ, Hu HT, Sun BG and Yin
LR: Clinical study of method of strengthening body resistance and
disintoxication in patients with HCC of post-TACE. Zhongguo Zhong
Yao Za Zhi. 32:1211–1213. 2007.(In Chinese). PubMed/NCBI
|
|
2
|
Yin LR, Chen ZX, Zhang SJ, Sun BG, Liu YD
and Huang HZ: Expression of phosphatase and tensin homolog deleted
on chromosome ten in liver of athymic mice with hepatocellular
carcinoma and the effect of Fuzheng Jiedu Decoction. World J
Gastroenterol. 14:108–113. 2008. View Article : Google Scholar : PubMed/NCBI
|
|
3
|
Sun B, Meng J, Xiang T, Chen Z, Li Y, Lu
L, Zhang S and Chen X: Jianpijiedu fang improves survival of
hepatocarcinoma mice by affecting phosphatase and tensin homolog,
phosphoinositide 3-kinase and focal adhesion kinase. J Tradit Chin
Med. 33:479–485. 2013. View Article : Google Scholar : PubMed/NCBI
|
|
4
|
Taylor AK, Cao W, Vora KP, De La Cruz J,
Shieh WJ, Zaki SR, Katz JM, Sambhara S and Gangappa S: Protein
energy malnutrition decreases immunity and increases susceptibility
to influenza infection in mice. J Infect Dis. 207:501–510. 2013.
View Article : Google Scholar : PubMed/NCBI
|
|
5
|
Finn OJ: Cancer Immunology. N Engl J Med.
358:2704–2715. 2008. View Article : Google Scholar : PubMed/NCBI
|
|
6
|
Valdés-Ramos R and Benítez-Arciniega AD:
Nutrition and immunity in cancer. Br J Nutr. 98(Suppl 1):
S127–S132. 2007.PubMed/NCBI
|
|
7
|
Zhang M, Maiti S, Bernatchez C, Huls H,
Rabinovich B, Champlin RE, Vence LM, Hwu P, Radvanyi L and Cooper
LJ: A new approach to simultaneously quantify both TCR α- and
β-chain diversity after adoptive immunotherapy. Clin Cancer Res.
18:4733–4742. 2012. View Article : Google Scholar : PubMed/NCBI
|
|
8
|
Wang QJ, Hanada K, Feldman SA, Zhao Y,
Inozume T and Yang JC: Development of a genetically-modified novel
T-cell receptor for adoptive cell transfer against renal cell
carcinoma. J Immunol Methods. 366:43–51. 2011. View Article : Google Scholar : PubMed/NCBI
|
|
9
|
Kim JA, Rao P, Graor H, Rothchild K,
O'keefe C and Maciejewski JP: CDR3 spectratyping identifies clonal
expansion within T-cell subpopulations that demonstrate therapeutic
antitumor activity. Surgery. 136:295–302. 2004. View Article : Google Scholar : PubMed/NCBI
|
|
10
|
Islam S, Abély M, Alam NH, Dossou F,
Chowdhury AK and Desjeux JF: Water and electrolyte salvage in an
animal model of dehydration and malnutrition. J Pediatr
Gastroenterol Nutr. 38:27–33. 2004. View Article : Google Scholar : PubMed/NCBI
|
|
11
|
Duarte FO, Sene-Fiorese M, Cheik NC, Maria
AS, de Aquino AE Jr, Oishi JC, Rossi EA, de Garcia Oliveira, Duarte
AC and Dâmaso AR: Food restriction and refeeding induces changes in
lipid pathways and fat deposition in the adipose and hepatic
tissues in rats with diet-induced obesity. Exp Physiol. 97:882–894.
2012. View Article : Google Scholar : PubMed/NCBI
|
|
12
|
Editorial Committee of Chinese Herbs,
State Administration of Traditional Chinese Medicine of the
People's Republic of China. A Selection of Chinese Herbal
Medicines. I:(Shanghai). Shanghai Science and Technology Press.
57–60. 1998.(In Chinese).
|
|
13
|
Gong LS, Zhang YD and Liu S: Target
distribution of magnetic albumin nanoparticles containing
adriamycin in transplanted rat liver cancer model. Hepatobiliary
Pancreat Dis Int. 3:365–368. 2004.PubMed/NCBI
|
|
14
|
Chen JH, Ling R, Yao Q, Wang L, Ma Z, Li
Y, Wang Z and Xu H: Enhanced antitumor efficacy on hepatoma-bearing
rats with adriamycin-loaded nanoparticles administered into hepatic
artery. World J Gastroenterol. 10:1989–1991. 2004. View Article : Google Scholar : PubMed/NCBI
|
|
15
|
Douillard P, Pannetier C, Josien R,
Menoret S, Kourilsky P, Soulillou JP and Cuturi MC: Donor-specific
blood transfusion-induced tolerance in adult rats with a dominant
TCR-Vbeta rearrangement in heart allografts. J Immunol.
157:1250–1260. 1996.PubMed/NCBI
|
|
16
|
Fearon K, Strasser F, Anker SD, Bosaeus I,
Bruera E, Fainsinger RL, Jatoi A, Loprinzi C, MacDonald N,
Mantovani G, et al: Definition and classification of cancer
cachexia: An international consensus. Lancet Oncol. 12:489–495.
2011. View Article : Google Scholar : PubMed/NCBI
|
|
17
|
Venturi V, Kedzierska K, Turner SJ,
Doherty PC and Davenport MP: Methods for comparing the diversity of
samples of the T cell receptor repertoire. J Immunol Methods.
321:182–195. 2007. View Article : Google Scholar : PubMed/NCBI
|
|
18
|
Kirkham A, Haley J, Haile Y, Grout A,
Kimpton C, Al-Marzouqi A and Gill P: High-throughput analysis using
AmpFlSTR® Identifiler® with the Applied Biosystems 3500xl Genetic
Analyzer. Forensic Sci Int Genet. 7:92–97. 2013. View Article : Google Scholar : PubMed/NCBI
|
|
19
|
Hulce D, Li X, Snyder-Leiby T, Johathan CS
and Liu GeneMarker®: Genotyping Software: Tools to Increase the
Statistical Power of DNA Fragment Analysis. J Biomol Tech.
22(Suppl): S35–S36. 2011.
|
|
20
|
Lu J, Basu A, Melenhorst JJ, Young NS and
Brown KE: Analysis of T-cell repertoire in hepatitis-associated
aplastic anemia. Blood. 103:4588–4593. 2004. View Article : Google Scholar : PubMed/NCBI
|
|
21
|
Goldstein G and Audhya TK: Thymopoietin to
thymopentin: Experimental studies. Surv Immunol Res. 4(Suppl 1):
1–10. 1985.PubMed/NCBI
|
|
22
|
Reggiani PC, Morel GR, Cónsole GM,
Barbeito CG, Rodriguez SS, Brown OA, Bellini MJ, Pléau JM, Dardenne
M and Goya RG: The thymus-neuroendocrine axis: Physiology,
molecular biology and therapeutic potential of the thymic peptide
thymulin. Ann NY Acad Sci. 1153:98–106. 2009. View Article : Google Scholar : PubMed/NCBI
|
|
23
|
Wang Y, Ke XY, Khara JS, Bahety P, Liu S,
Seow SV, Yang YY and Ee PL: Synthetic modifications of the
immunomodulating peptide thymopentin to confer anti-mycobacterial
activity. Biomaterials. 35:3102–3109. 2014. View Article : Google Scholar : PubMed/NCBI
|
|
24
|
Petronella P, Ferrone R, Freda F and
Valeriani G: Thymopentin and immune response in patients with
cancer. Minerva Chir. 44:2017–2020. 1989.(In Italian). PubMed/NCBI
|
|
25
|
Li T, Li ZW and Wen HC: Study on the
efficacy and safety of high dose thymopentin combined with
trans-artery chemoembolization for primary liver cancer. Zhonghua
Zhong Liu Za Zhi. 29:941–942. 2007.(In Chinese). PubMed/NCBI
|
|
26
|
Li J, Cheng Y, Zhang X, Zheng L, Han Z, Li
P, Xiao Y, Zhang Q and Wang F: The in vivo immunomodulatory and
synergistic anti-tumor activity of thymosin α1-thymopentin fusion
peptide and its binding to TLR2. Cancer Lett. 337:237–247. 2013.
View Article : Google Scholar : PubMed/NCBI
|