Introduction
Free radicals are products of normal metabolism,
including reactive oxygen species (ROS) such as superoxide anion
radical (O2•-), hydroxyl radical (OH•) and peroxyl radical
(RO2•), and reactive nitrogen species (RNS), such as
nitric oxide and the peroxynitrite radical (ONOO•) (1). Free radicals participate in several
cellular functions, such as the regulation of signaling pathways
and gene expression, and apoptosis (1,2).
Endogenous sources of free radicals include the mitochondrial
respiratory chain, inflammation, peroxisomes and cytochrome P450
(3). In addition, there are
exogenous sources of ROS and RNS generation, such as smoking, air
pollution, ultraviolet light and ionizing radiation (4). Free radicals are highly reactive
species and can react with biological macromolecules (e.g., DNA,
proteins and lipids), causing damage to these molecules (1). Living organisms have defense systems
against free radicals, including antioxidant enzymes such as
catalase (CAT), glutathione peroxidase (GPx), superoxide dismutase
(SOD) and paraoxonase 1 (PON1), as well as non-enzymatic
antioxidant compounds, such as glutathione (GSH), vitamins C and E,
uric acid and ubiquinone (1).
However, the overproduction of free radicals may lead to an
imbalance in which the amount of ROS/RNS exceeds the antioxidant
capacity, leading to oxidative stress associated with several
pathophysiological conditions and diseases (1,5).
One of the pathophysiological conditions associated
with oxidative stress is metabolic syndrome (MetS) (6). MetS is defined as a cluster of
cardiovascular and type 2 diabetes (T2D) risk factors (7). MetS is diagnosed when a patient has at
least three of the following risk factors: hyperglycemia, high
blood pressure, high triglyceride levels, low high-density
lipoprotein (HDL) cholesterol levels and obesity (7). There is evidence supporting the
hypothesis that increased levels of oxidative stress may play an
important role in MetS-related manifestations, including
atherosclerosis and hypertension (8,9).
Furthermore, oxidative stress is related with adiposity and insulin
resistance in patients with MetS, suggesting that it is a crucial
factor in the evolution of this pathological condition and not just
a consequence (6,10,11).
As is already known, MetS may lead to the
development of T2D, one of the most common metabolic disorders
worldwide (12). T2D is
characterized by hyperglycemia (i.e., high blood glucose levels)
which occurs due to insulin resistance, that is, the cellular
failure to respond normally to the insulin hormone (12). A number of studies have demonstrated
that oxidative stress is associated with T2D, and particularly with
its complications (12,13). In particular, some symptoms of T2D,
such as hyperglycemia, insulin resistance and dyslipidemia induce
oxidative stress through different mechanisms, such as increased
advanced glycation end products (AGEs), inflammation, increased
polyol pathway flux, increased hexosamine pathway flux and
increased mitochondrial superoxide production (12–15). The
increased levels of oxidative stress occurring in patients with T2D
in turn aggravate some of the associated complications,
particularly those involving the cardiovascular and neural system
(12,14,16).
Although the role of oxidative stress in diabetic complications has
been established, its role as an etiological factor has not yet
been fully elucidated (12,17).
Since oxidative stress is associated with MetS and
T2D, its assessment in patients suffering from these disorders is
useful for monitoring their progress and treatment, as well as for
ameliorating the health-associated complications. Several
biomarkers have been used for assessing oxidative stress levels in
humans (18). However, the
assessment of the redox status remains a time-consuming and
impractical method in clinical settings, and thus there is a great
need for developing new markers (19). In our previous studies, we measured a
new marker, static oxidation reduction potential (sORP), in plasma
using the RedoxSYS Diagnostic System for assessing oxidative stress
induced by either physiological or pathophysiological conditions
(20–23). sORP is the standard potential between
a working electrode and a reference electrode with no driving
current (or an extremely small current) which is proportional to
the balance of reductants and oxidants and is what is classically
termed ORP (i.e., a homeostatic parameter capturing the current
balance of oxidants and reductants in a biological specimen). Low
sORP values mean that the biological sample is in the normal range
of oxidative stress, while higher than normal sORP values mean that
the biological sample is in a higher state of oxidative stress.
The aim of the present study was to examine the
effectiveness of sORP for assessing oxidative stress in patients
having symptoms of both MetS and T2D. Moreover, conventional
oxidative stress markers, such as thiobarbituric acid reactive
substances (TBARS), GSH levels, CAT activity, protein carbonyl
(CARB) levels and total antioxidant capacity (TAC) were measured in
the blood of the patients in order to compare and correlate them
with sORP.
Subjects and methods
Subjects
A total of 75 adult subjects manifesting both MetS
and T2D, as well as 35 normal subjects participated in the present
study. All experimental procedures were performed in accordance
with the European Union Guidelines laid down in the 1964
Declaration of Helsinki and were approved by the Institutional
Review Board of the University of Thessaly (Larissa, Greece).
Blood collection and handling
The participants visited the Standard Centre of
Bioassays, ‘Hartografoi Hygeias’ in Athens (Greece) and blood
samples were collected. Blood samples were drawn from a forearm
vein of seated individuals and stored in ethylenediaminetetraacetic
acid (EDTA; Becton-Dickinson, Franklin Lakes, NJ, USA) tubes for
measuring the levels of TBARS, CARB and GSH, TAC, and CAT activity,
and in heparin tubes for dertermining sORP. The samples were then
centrifuged immediately at 1,370 × g for 10 min at 4°C and
erythrocytes were divided from the plasma. The erythrocytes were
lysed with distilled water (1:1 v/v), inverted and centrifuged at
4,020 × g for 15 min at 4°C, and the erythrocyte lysate was then
collected for the measurement of CAT activity. A small amount of
erythrocyte lysate (500 µl) was treated with 5% trichloroacetic
acid (TCA; Sigma-Aldrich, Munich, Germany) (1:1 v/v), vortexed and
centrifuged at 28,000 × g for 5 min at 4°C. The supernatants were
then removed and the procedure was repeated in the same way.
Subsequently, the clear supernatants were transferred to new
Eppendorf tubes and were used for the determination of GSH levels.
Plasma and erythrocyte lysates were stored at −80°C until further
analysis.
Assesment of sORP using the Luoxis
RedoxSYS diagnostic system
The sORP value was determined using the RedoxSYS
diagnostic system (Luoxis Diagnostics, Inc., Englewood, CO, USA) as
previously described (22). This
marker exhibits the intergrated balance between oxidants and
reductants in a specimen and is presented in mV. In this new and
innovative method, 20 µl of plasma are applied to disposable
sensors designed by Luoxis Diagnostics, Inc., which are then
inserted into the RedoxSYS diagnostic system, and the sORP value is
reported within 4 min.
Assessment of the levels of TBARS, GSH
and CARB, TAC, and CAT activity
For the determination of the TBARS levels, the assay
was based on the method described in the study by Keles et
al (24). TBARS is a commonly
and frequently used method to determine lipid peroxidation.
According to this method, 100 µl of plasma were mixed with 500 µl
of 35% TCA (Merck KGaA, Darmstadt, Germany) and 500 µl of Tris-HCl
(Sigma-Aldrich, St. Louis, MO, USA; 200 mM, pH 7.4) and incubated
for 10 min at room temperature. One milliliter of 2 M sodium
sulfate (Na2SO4) and 55 mM TBA solution were
added and the samples were incubated at 95°C for 45 min. The
samples were cooled on ice for 5 min and were vortexed following
the addition of 1 ml of 70% TCA. The samples were centrifuged at
15,000 × g for 3 min and the absorbance of the supernatant was read
at 530 nm using a spectrophotometer (Hitachi U-1900; serial no.
2023-029; Hitachi, Tokyo, Japan). A baseline absorbance was taken
into account by running a blank along with all samples during the
measurement. The calculation of the TBARS concentration was based
on the molar extinction coefficient of malondialdehyde.
The concentration of CARB, an index of protein
oxidation, was determined based on the method described in the
study by Patsoukis et al (25). In this assay, 50 µl of 20% TCA were
added to 50 µl of plasma and this mixture was incubated in an ice
bath for 15 min and centrifuged at 15,000 × g for 5 min at 4°C. The
supernatant was discarded and 500 µl of 10 mM
2,4-dinitrophenylhydrazine (DNPH; Sigma-Aldrich, Munich, Germany)
(in 2.5 N HCl) for the sample, or 500 µl of 2.5 N HCl for the
blank, were added to the pellet. The samples were incubated in the
dark at room temperature for 1 h with intermittent vortexing every
15 min and were centrifuged at 15,000 × g for 5 min at 4°C. The
supernatant was discarded and 1 ml of 10% TCA was added, vortexed
and centrifuged at 15,000 × g for 5 min at 4°C. The supernatant was
discarded and 1 ml of ethanol-ethyl acetate (1:1 v/v) was added,
vortexed and centrifuged at 15,000 × g for 5 min at 4°C. This
washing step was repeated twice. The supernatant was discarded and
1 ml of 5 M urea (pH 2.3) was added, vortexed and incubated at 37°C
for 15 min. The samples were centrifuged at 15,000 × g for 3 min at
4°C and the absorbance was read at 375 nm. The calculation of the
CARB concentration was based on the molar extinction coefficient of
DNPH. Total plasma protein was assayed using the Bradford protein
assay.
The GSH levels were measured based on the method
previously described in the study by Reddy et al (26). A total of 20 µl of erythrocyte lysate
was treated with 5% TCA, mixed with 660 µl of 67 mM sodium
potassium phosphate (pH 8) and 330 µl of 1 mM 5,5-dithiobis-2
nitrobenzoate (DTNB; Sigma-Aldrich, Munich, Germany). The samples
were incubated in the dark at room temperature for 45 min and the
absorbance was read at 412 nm using a spectrophotometer (Hitachi
U-1900; serial no. 2023-029; Hitachi). The GSH concentration was
calculated relative to a calibration curve made using commercial
standards.
The measurement of CAT activity was based on the
method described by Aebi (27). In
particular, 4 µl οf erythrocyte lysate (diluted 1:10) were added to
2,991 µl οf 67 mM sodium potassium phosphate (pH 7.4) and the
samples were incubated at 37°C for 10 min. A total of 5 µl of 30%
hydrogen peroxide (H2O2) was added to the
samples and the change in absorbance was immediately read at 240 nm
using a spectrophotometer (Hitachi U-1900; serial no. 2023-029;
Hitachi) for 130 sec. The determination of CAT activity was based
on the molar extinction coefficient of
H2O2.
Finally, the determination of TAC was based on the
method described in the study by Janaszewska and Bartosz (28). In this assay, 20 µl of plasma were
added to 480 µl of 10 mM sodium potassium phosphate (pH 7.4) and
500 µl of 0.1 mM 2,2-diphenyl-1-picrylhydrazyl (DPPH) free radical.
The samples were then incubated in the dark for 30 min at room
temperature and then centrifuged at 20,000 × g for 3 min. The
absorbance was read at 520 nm using a spectrophotometer (Hitachi
U-1900; serial no. 2023-029; Hitachi). TAC is presented as mmol of
DPPH reduced to 2,2-diphenyl-1-picrylhydrazine by receiving one
hydrogen atom from the antioxidants of plasma.
Statistical analysis
For statistical analysis, data were analyzed by
one-way ANOVA followed by Dunnett's test for multiple pairwise
comparisons. The level of statistical significance was set at
P<0.05. For all statistical analyses, SPSS software version 13.0
(SPSS, Inc., Chicago, IL, USA) was used. Data are presented as the
means + standard error of the mean (SEM).
Results
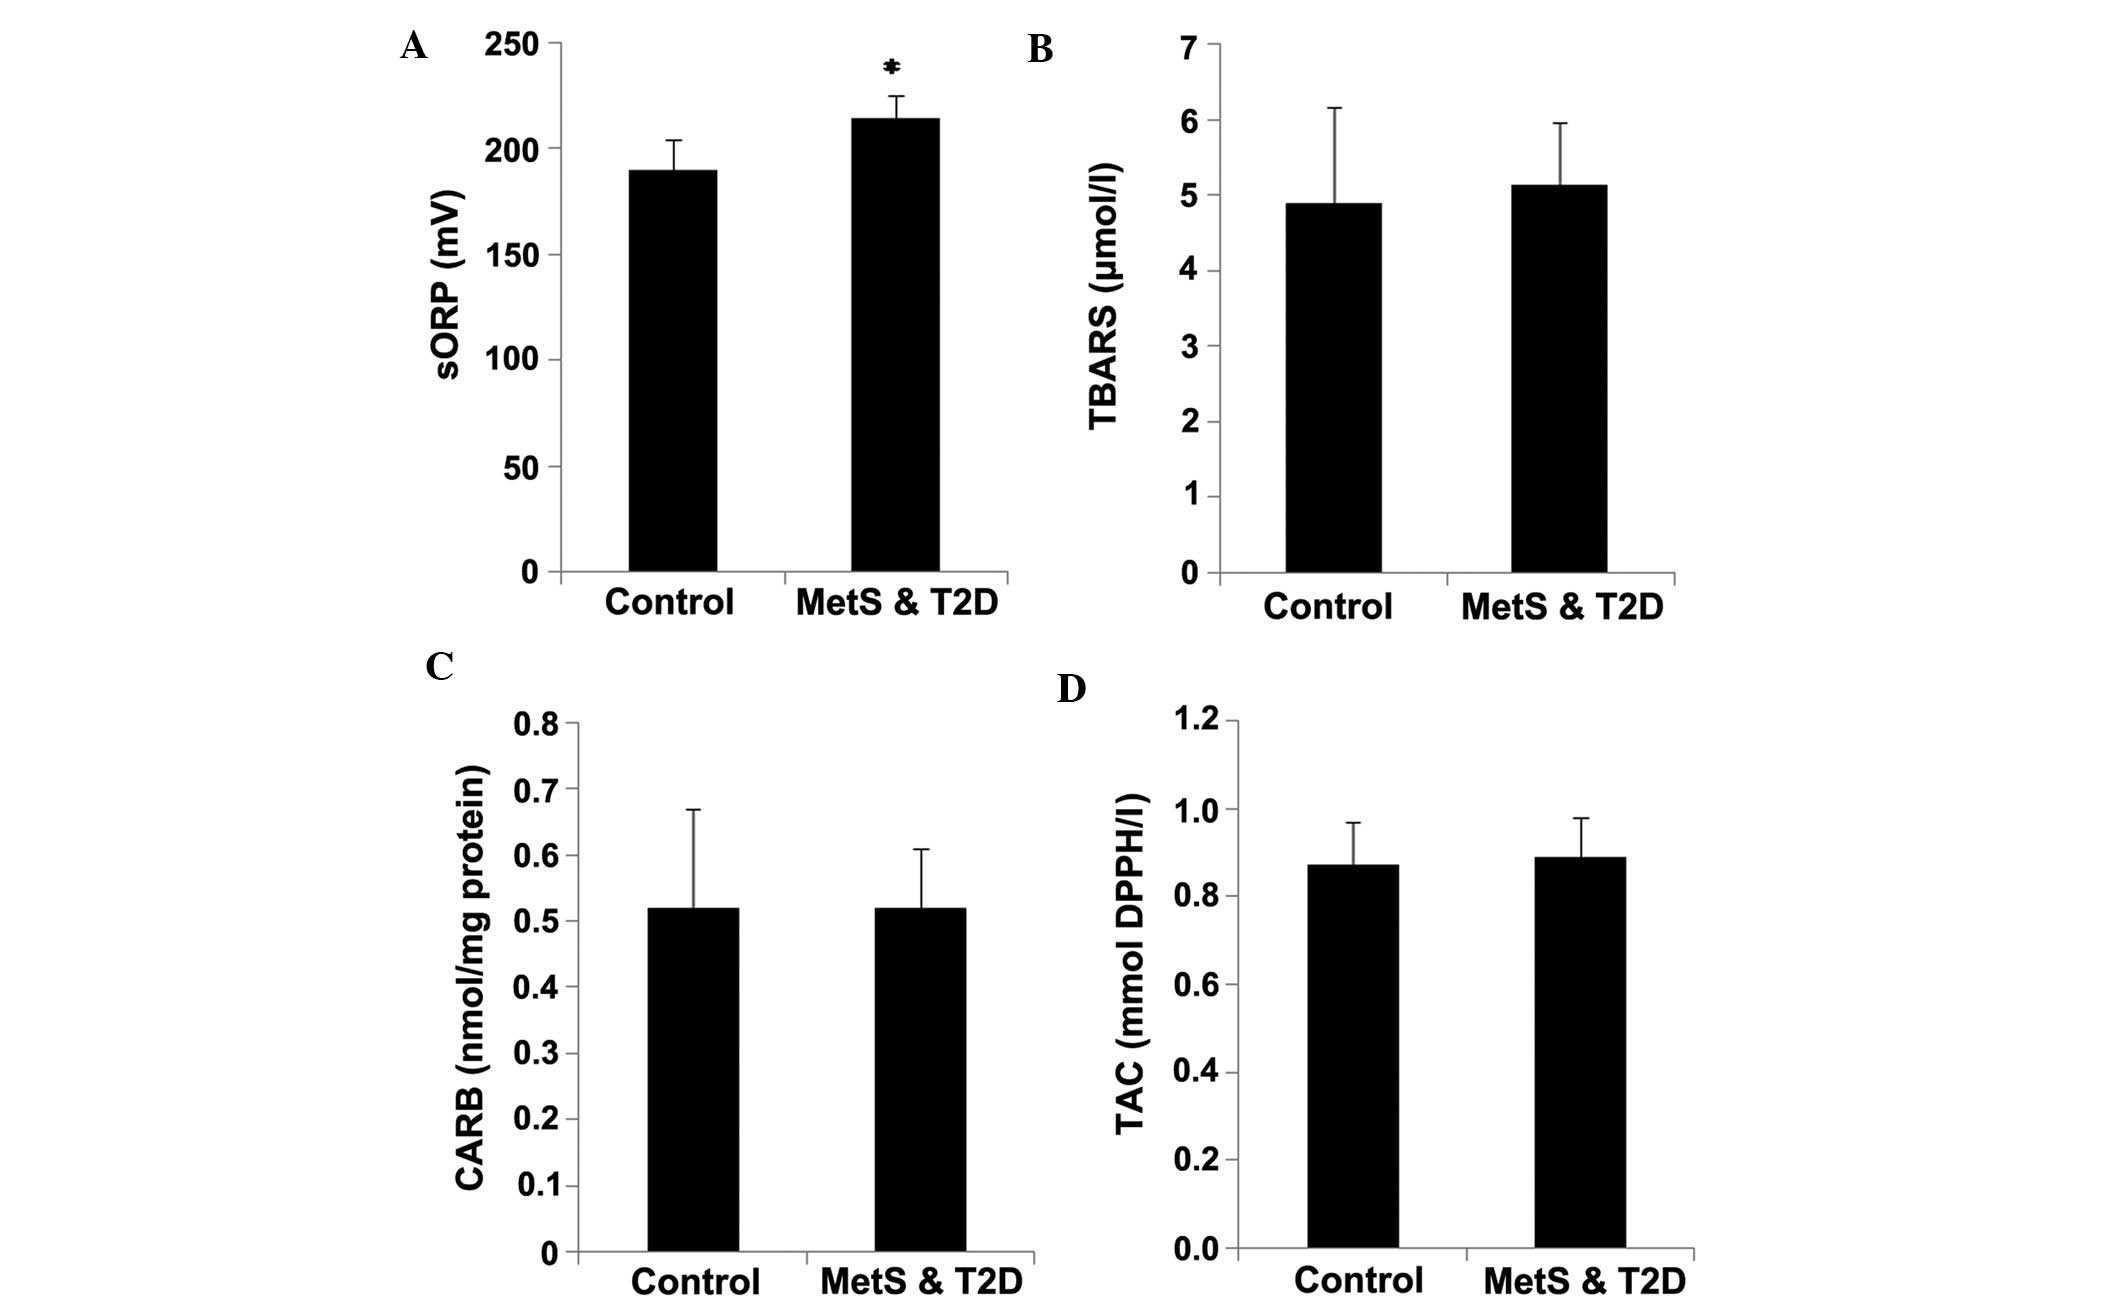
The results revealed that the sORP values in plasma
were significantly (P<0.05) higher by 13.4% in the patients with
MetS and T2D compared to the controls, indicating an increase in
oxidative stress (Fig. 1A). No
statistically significant differences were observed in the CARB and
TBARS levels, and TAC in the plasma between the patients with MetS
and T2D and the controls (Fig.
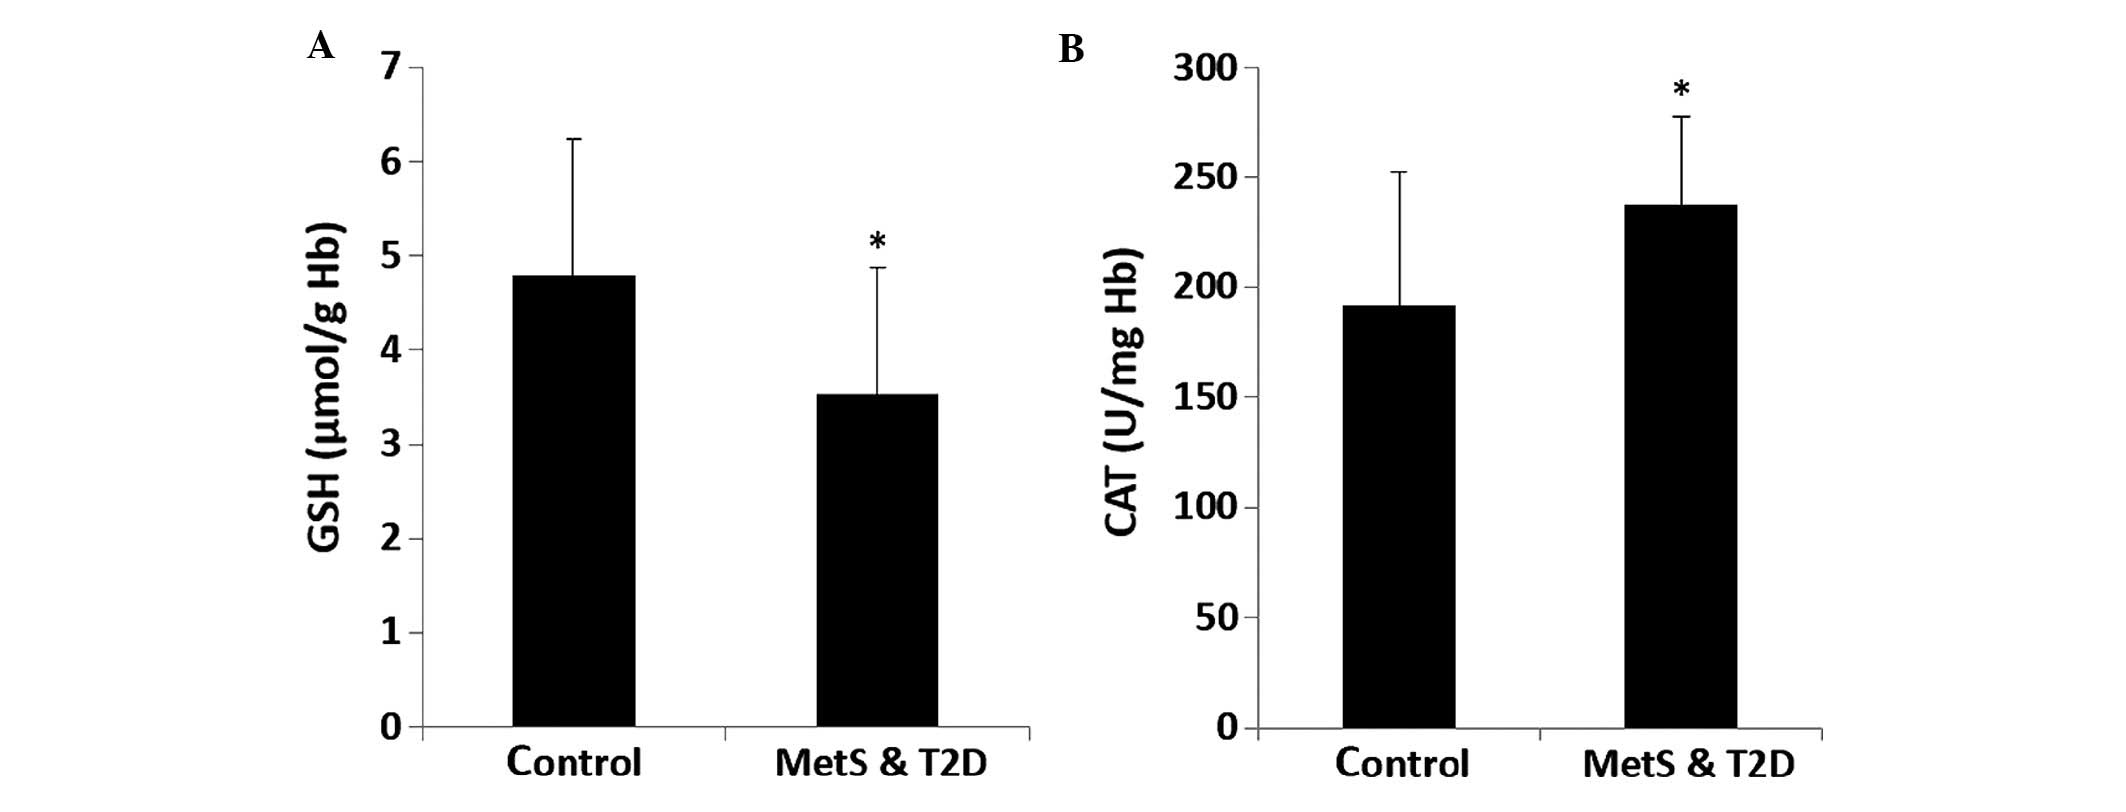
1B–D). The GSH levels in erythrocytes were significantly
(P<0.05) lower by 27.7% in the patients with MetS and T2D
compared to the controls (Fig. 2A).
CAT activity in erythrocytes was significantly (P<0.05) higher
by 23.3% in the patients with MetS and T2D compared to the controls
(Fig. 2B).
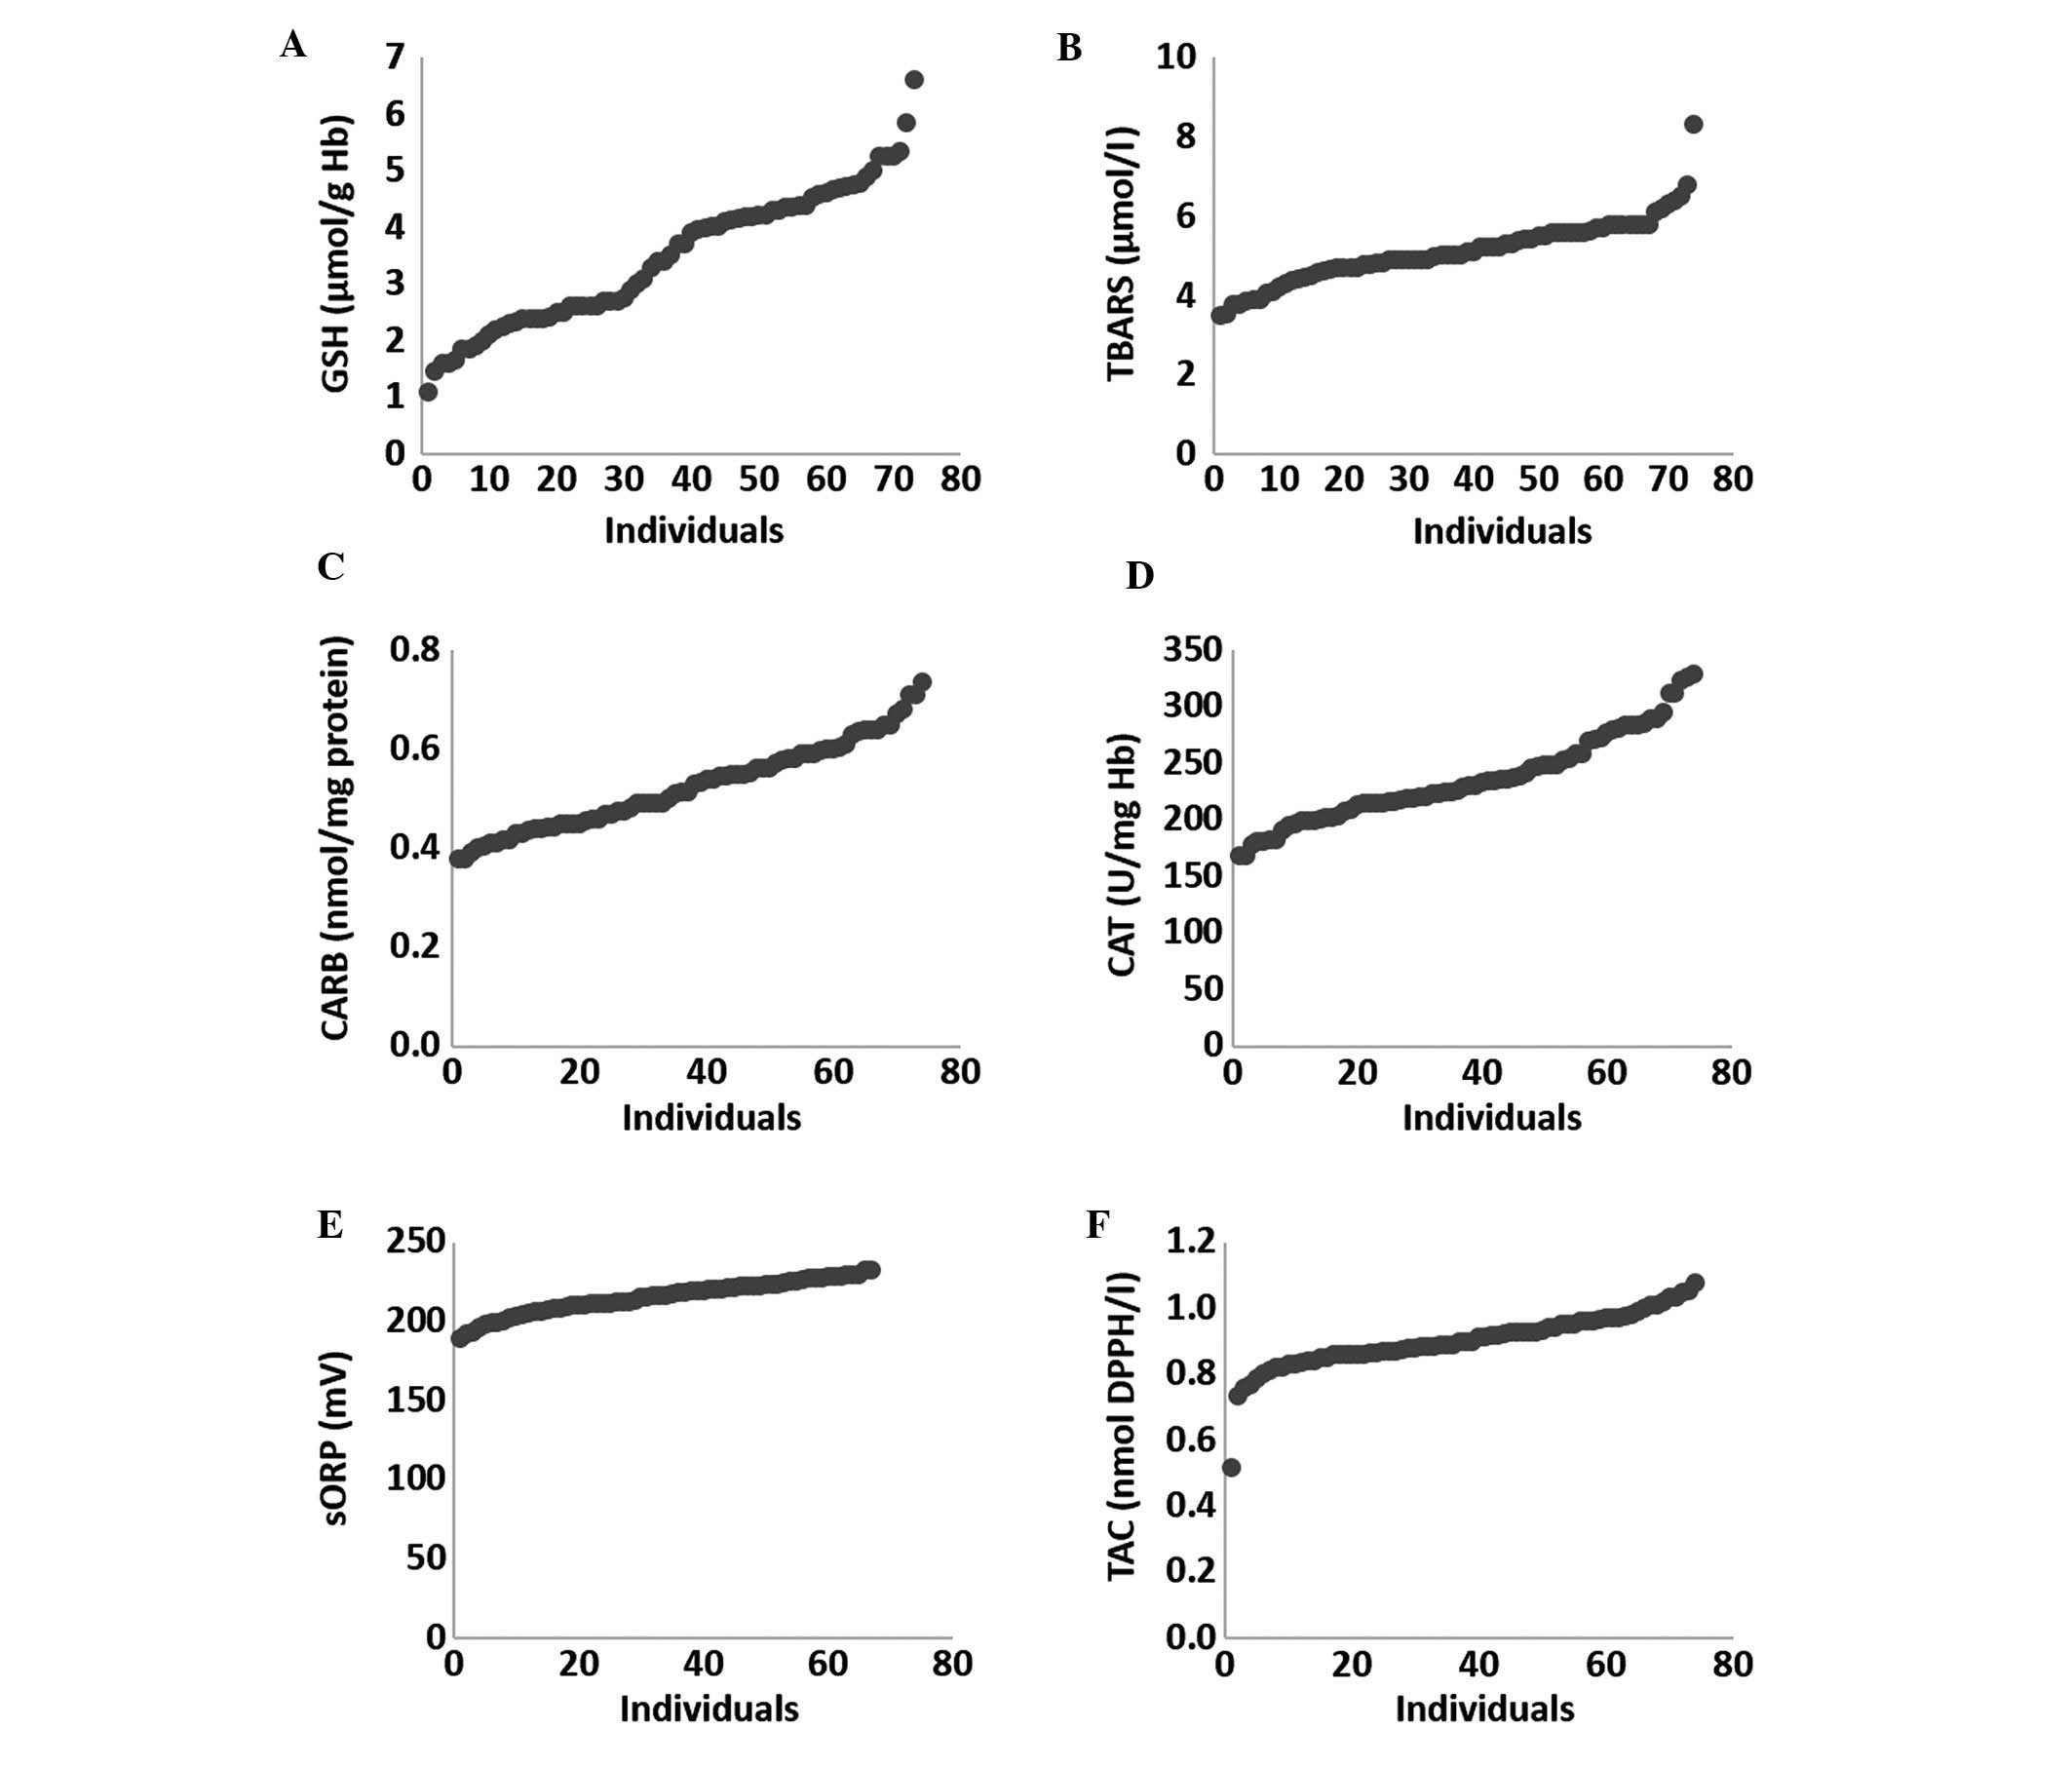
In a previous study, we found that the induction of
oxidative stress exhibited great variability between different
individuals, since the outcome of an oxidant stimulus may be
affected by several different factors (e.g., genetic, physiological
and biochemical) (21,29). Based on this observation, the
individual variability of the tested oxidative stress markers
within the patients with MetS and T2D was examined (Fig. 3). Among these markers, the GSH marker
exhibited the greatest variability, since there was a 6-fold
difference between the lowest value and the highest value (Fig. 3A). GSH was also one of the three
markers that exhibited a significant difference in its levels
between the patients with MetS and T2D and the controls. In
addition, GSH is considered one of the most important endogenous
antioxidant molecules and a major contributor to the cellular redox
status of living organisms (30).
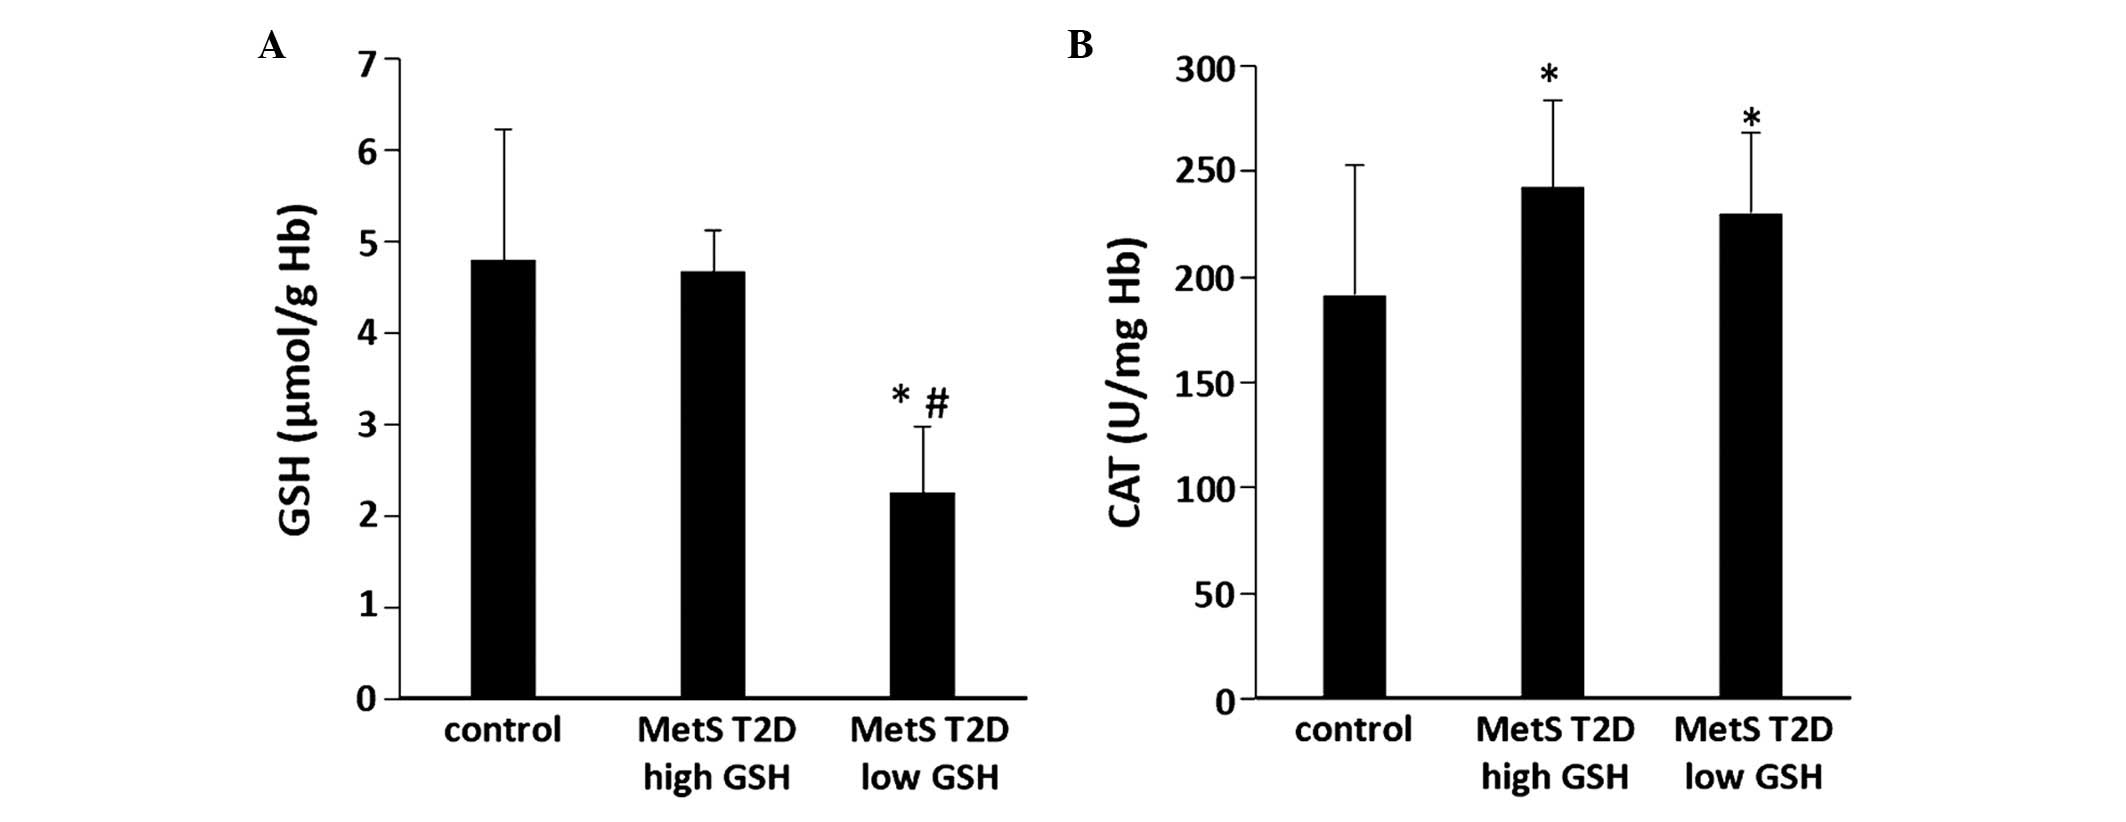
Thus, the patients with MetS and T2D were divided into 2 subgroups,
the first one with low GSH levels (n=31; GSH <3 µmol/g Hb) and
the second one with high GSH levels (n=35; GSH >4 µmol/g Hb).
Nine patients had intermediate GSH values, that is, between 3.1 and
3.9 µmol/g Hb, and thus they were not included in any of the 2
subgroups, so as to have a clear distinction of patients as regards
the GSH levels. Between the average values of these 2 GSH groups,
there was a statistically significant (P<0.05) difference (by
51.7%) in GSH levels in erythrocytes (Fig. 4A). Moreover, the GSH levels were
significantly (P<0.05) lower (by 52.9%) in the low GSH group
compared with the controls (Fig.
4A). In addition, in these 2 GSH groups, the differences
between the other oxidative stress markers were also examined.
There were no significant differences observed in CAT activity in
erythrocytes between the 2 GSH groups (Fig. 4B). However, CAT activity was
significantly (P<0.05) higher in the low and high GSH groups by
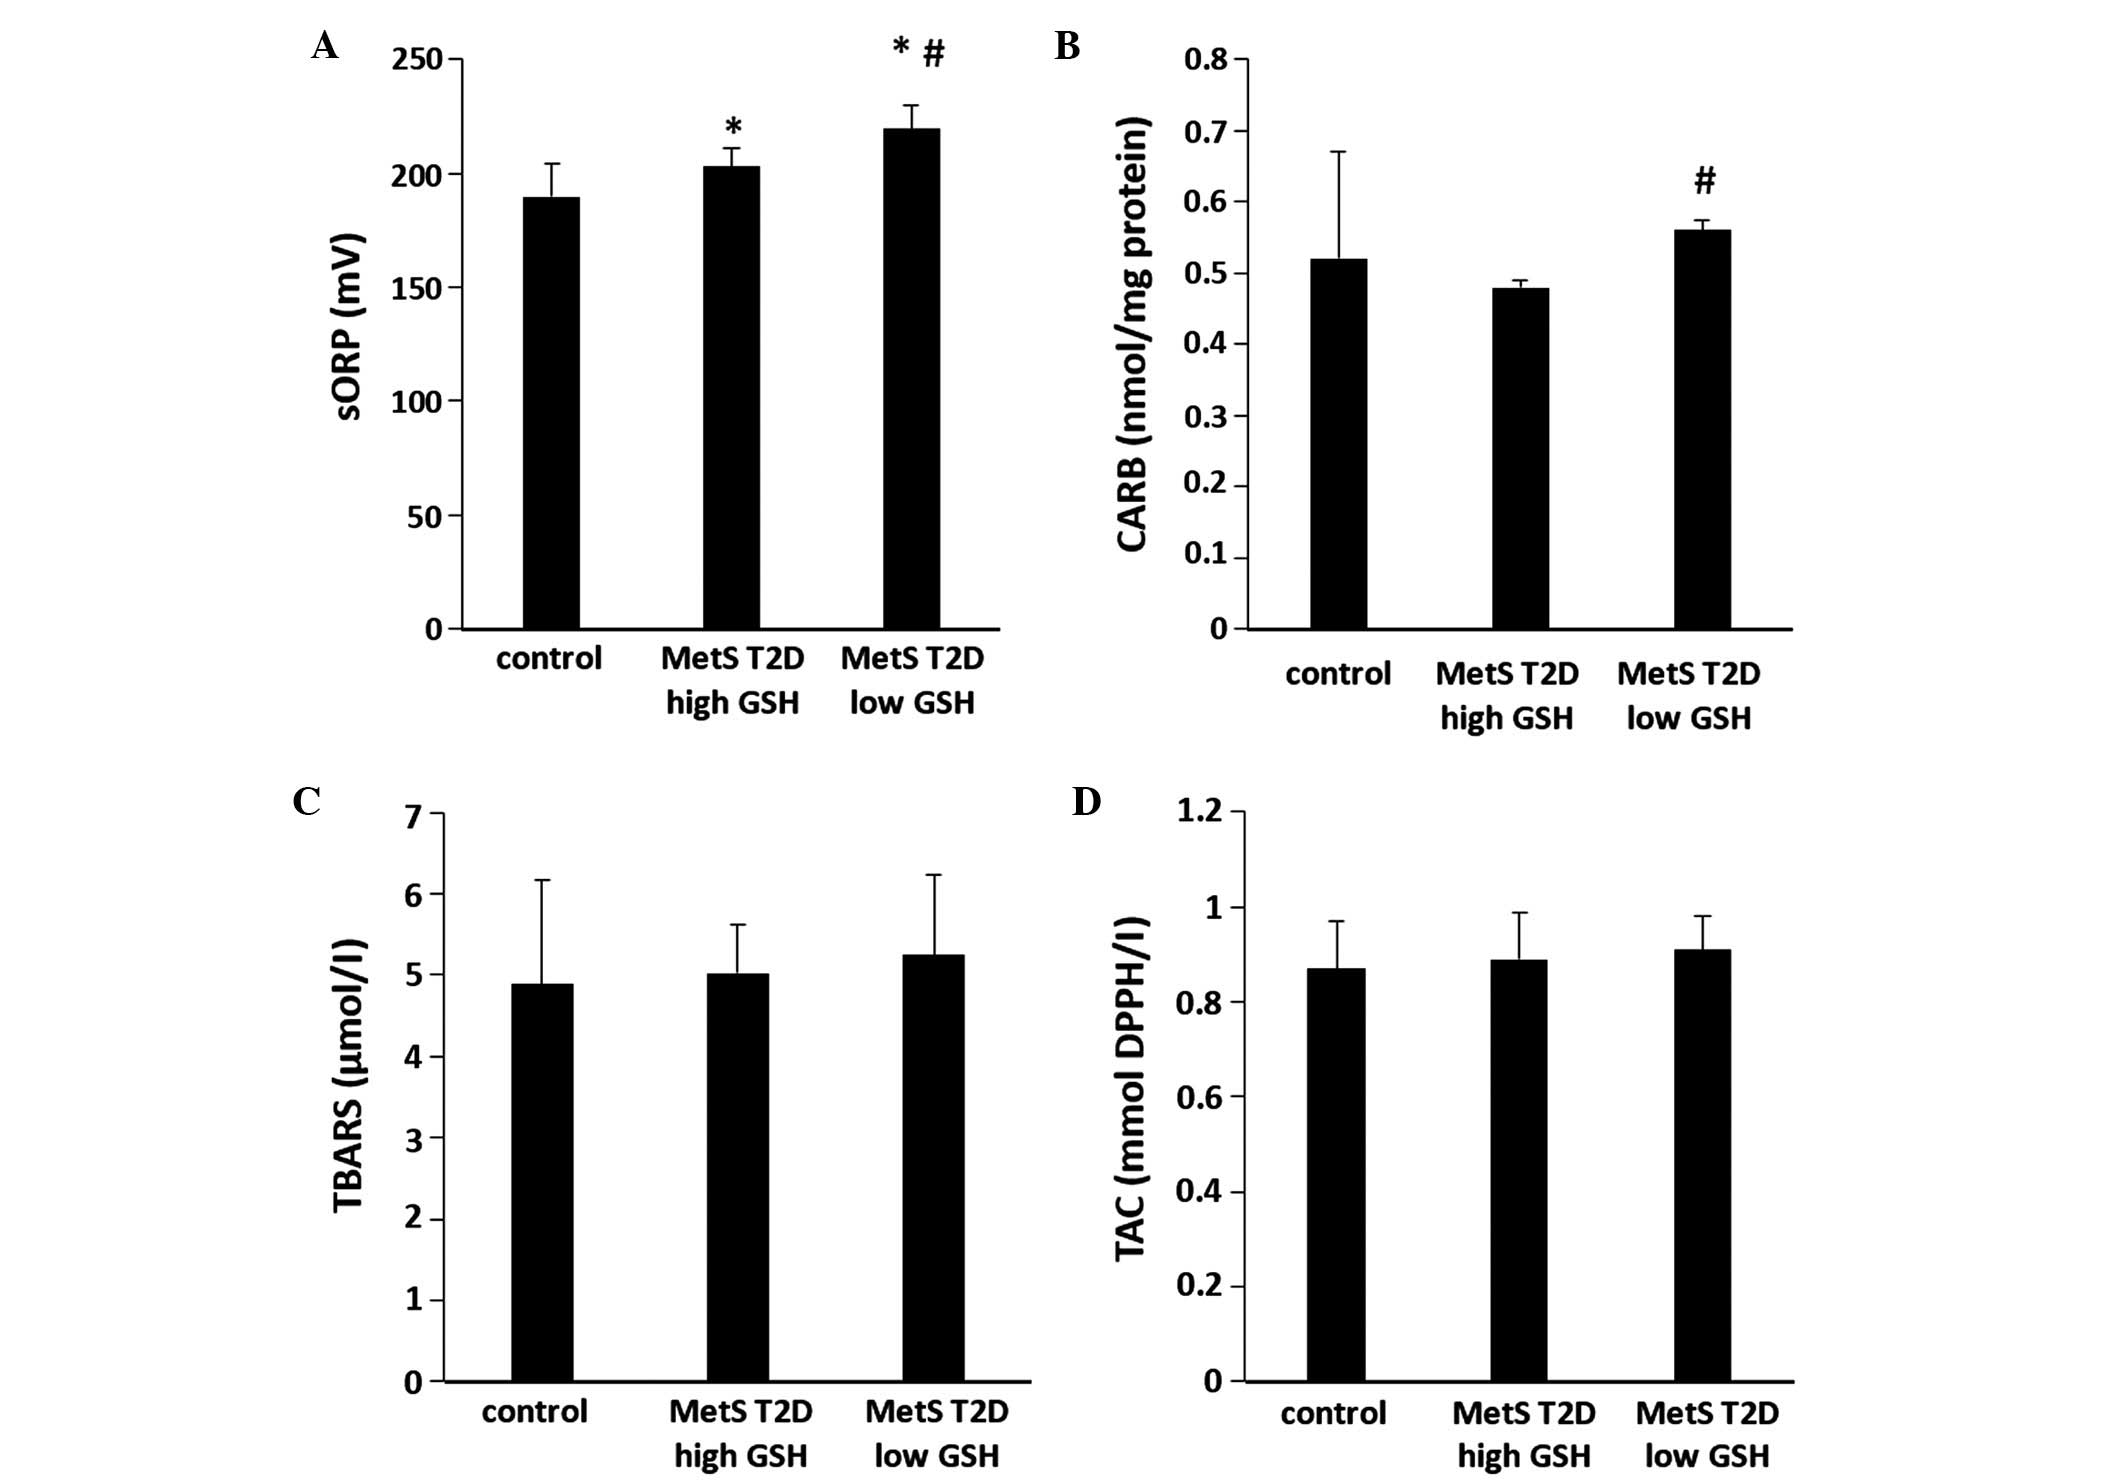
20.4 and 26.7%, respectively than in the controls (Fig. 4B). The sORP values in the plasma of
the patients in the low GSH group were significantly (P<0.05)
higher (by 8.1%) compared with those of the patients in the high
GSH group (Fig. 5A). Moreover, the
sORP values were significantly (P<0.05) higher in the patients
in the low and high GSH groups (by 15.6 and 6.9%, respectively)
compared with the controls (Fig.
5A). In addition, the CARB levels in plasma were significantly
(P<0.05) higher (by 16.7%) in the low GSH group compared with
the high GSH group (Fig. 5B). There
were no significant differences observed in TBARS and TAC levels in
plasma between the 2 GSH groups (Fig. 5C
and D).
Discussion
MetS is a cluster of medical conditions, including
abdominal obesity and insulin resistance, plus any two of the
following four factors: i) increased triglyceride levels, ii)
decreased HDL cholesterol levels, iii) increased blood pressure,
and iv) increased fasting blood glucose levels (7). The prevalence of MetS is approximately
22.9% in the US population and up to 36% of Europeans aged between
40–55 suffer from the disease (31,32).
MetS is also a risk factor for developing T2D, another type of
metabolic disorder, characterized basically by elevated blood
glucose levels due to insulin resistance and affects approximately
380 million individuals worldwide (12). Both of these disorders are also
associated with oxidative stress, a pathophysiological condition in
which there is an overbalance of free radicals production against
antioxidant mechanisms (12,13,33,34).
Oxidative stress occurring in patients with MetS and T2D may
further aggravate the associated complications, particularly those
involving the cardiovascular system (14,16,35,36).
Thus, the assessment of oxidative stress in patients with MetS and
T2D is considered useful for monitoring their health status
(37–39). In previous studies, we demonstrated
that the determination of the sORP values in plasma, a new marker
of oxidative stress, was effective for assessing the redox status
in different physiological conditions and diseases (20–23).
Thus, the aim of the present study was to examine the effectiveness
of sORP for assessing oxidative stress in patients manifesting both
MetS and T2D.
The results revealed that the sORP values in plasma
were significantly higher in the patients with MetS and T2D
compared with the controls, suggesting the induction of oxidative
stress in the patients affected by these two metabolic disorders.
In our previous studies, we observed increased sORP values in
patients with sepsis and in conditions of strenuous
exercise-induced oxidative stress (21–23).
The significantly lower GSH levels in the
erythrocytes of the patients with MetS and T2D compared with the
controls also supported the induction of oxidative stress in the
patients with MetS and T2D. Another study also reported decreased
GSH levels in patients with MetS (40). Likewise, a decrease in GSH levels in
human erythrocytes and serum has been demonstrated in other studies
on patients with T2D (41–43). GSH is one of the most important
antioxidant mechanisms in living organisms, and thus low GSH levels
are associated with oxidative stress and the manifestation of
various diseases (30,44,45). As
regards the mechanisms through which T2D is associated with low GSH
levels, it has been suggested that in hyperglycemia, glucose is
used in the polyol pathway, resulting in a decrease in nicotinamide
adenine dinucleotide phosphate-oxidase (NADPH), which is necessary
for the GSH reductase enzyme to regenerate GSH from oxidized
glutathione (GSSG) (46).
In this study, the patients with MetS and T2D
exhibited a significant increase in CAT activity compared to the
controls. CAT is the main regulator of hydrogen peroxide
metabolism, which is associated with diabetes mechanisms, such as
the expression of glucose receptor and insulin secretion (47). Other studies have demonstrated
conflicting results, reporting either a decrease (47), increase (48) or no change (49) in CAT activity in hyperglycemic
conditions. It has been proposed that an organism may increase CAT
activity in some cells, such as erythrocytes in order to protect
itself from free radical-induced cell damage in diabetic
conditions, particularly in cells with low CAT activity, such as
pancreatic beta cells (50). Thus,
increase in CAT activity may also indicate the induction of
oxidative stress in patients with MetS and T2D, as similarly shown
by sORP and GSH markers.
However, in this study, no differences were observed
in the TBARS and CARB levels (indicating lipid peroxidation and
protein oxidation, respectively), in plasma between the patients
with MetS and T2D and the controls. Although studies have
demonstrated that T2D is accompanied by increased lipid
peroxidation, the latter is not a prerequisite for MetS (42,51). On
the contrary, it seems that for some unclear reason, lipid
peroxidation may even be decreased in MetS (52). Thus, the co-occurrence of both MetS
and T2D in the patients may explain the absence of increased TBARS
levels in their plasma. Moreover, no increase was observed in the
CARB levels in the patients with MetS and T2D compared with the
controls, although protein oxidation is considered a characteristic
of either MetS or T2D (51,53). This absence of increase in CARB
levels may be explained by the fact that advanced oxidation protein
products (AOPPs) instead of CARB have been shown to be the most
appropriate marker for protein oxidation in MetS (51). AOPPs have also been reported to be
increased in T2D (54). AOPPs are
generated by the action of chloraminated oxidants (e.g.,
hypochlorous acid and chloramines) produced by myeloperoxidase in
activated neutrophils during oxidative stress (55). CARB are produced on protein side
chains (particarly of Pro, Arg, Lys and Thr) when they are oxidized
(18).
Furthermore, TAC marker did not differ significantly
between the patients with MetS and T2D and the controls. Since TAC
is considered a marker of the total redox status, this finding was
in contrast to the induction of oxidative stress indicated by other
markers (actually, TAC would be expected to be reduced). However,
this result may be explained when considering that TAC is based on
the assessment of the reductant compounds, which along with the
antioxidant enzymes constitute the antioxidant defense mechanisms.
Although some antioxidants (e.g., GSH) are reduced in MetS and T2D
disorders, some others such as uric acid have been reported to be
increased (51). Uric acid
accounting for approximately 60% of the antioxidant activity in
human plasma is believed to be increased in MetS subjects as
insulin may reduce uric acid elimination in the urine (51,56).
Thus, although TAC may remain unchanged due to this parallel
increase and decrease in different antioxidants in MetS and T2D
conditions, oxidative stress occurs as oxidant compounds are
increased more than the antioxidants. For this reason, and as we
have suggested previously (21,23), the
sORP marker may be a better marker than TAC for assessing the total
redox status, since the former is based on the evaluation of the
difference between oxidants and reductants while the latter only on
the reductants (i.e., antioxidants).
In this study, the patients with MetS and T2D
exhibited great variations in the values of oxidative stress
markers, particularly those of GSH, and thus the patients were
divided into 2 subgroups, one with low GSH (<3 µmol/g Hb) and
the other with high GSH (>4 µmol/g Hb) levels. The statistical
comparison of the average values of oxidative stress markers
between the two subgroups indicated that the low GSH group had
significantly higher sORP levels than the high GSH group,
suggesting greater oxidative stress in the former group compared to
the latter. This finding was also supported by the higher protein
oxidation levels as shown by CARB in the low GSH group compared
with the high GSH group. There were no significant differences
observed in TAC, and in the CAT and TBARS levels between the two
GSH groups. Since oxidative stress has been associated with the
severity of complications in patients with either MetS or T2D
(33–36), the observed variation of the
induction of oxidative stress in such subjects emphasizes the need
for assessing their redox status. Namely, higher oxidative stress
levels in patients with MetS and T2D may be an alarming sign for
applying appropriate interventions (e.g., antioxidant
supplementation), so as to reduce the aggravation of complications
(12,37). Among the two oxidative stress markers
assessing total redox status (i.e., sORP and TAC), sORP seems to be
a suitable marker for assessing oxidative stress levels in patients
with MetS and T2D, since it was associated with lower GSH and
higher CARB levels.
Moreover, the assessment of the redox status may be
important in prediabetic conditions. According to a new theory
suggested by Watson (57) and
Sharoff et al (58), there
may be a close association between T2D and the redox status.
According to this theory, a main cause of diabetes is a reductive
environment in the endoplasmic reticulum, impairing disulphide bond
formation needed to stabilize the 3D conformation of
physiologically active proteins (57). Namely, an oxidative environment seems
to be required for the proper folding and the normal function of
proteins. Major evidence supporting this theory is that the
membranous sacs of the endoplasmic reticulum of insulin-resistant
rodents contain higher amount of unfolded polypeptides and many
fewer S-S bonds than normal endoplasmic reticulum (59,60).
Moreover, it has been demonstrated that supplementation with
antioxidant decreased the ability of exercise to make cells more
sensitive to insulin (61). In
addition, subjects carrying mutations impairing the synthesis of
antioxidant molecules manifested increased insulin sensitivity
(62). Based on this theory, our
findings showing that oxidative stress levels varied greatly among
MetS and T2D subjects emphasize the need for the assessment of
redox status in prediabetic subjects, which may help to discern
those with reductive redox status from those with oxidative one,
and so to make the appropriate interventions. It has often been
suggested without distinction the antioxidant supplementation in
prediabetic subjects, although as explained above this may be
harmful for those having a reductive redox status. In future
studies, we will investigate the association between the redox
status and clinical signs of prediabetic subjects.
In conclusion, the present results suggest that sORP
may be an effective marker for assessing oxidative stress in MetS
and T2D patients, since it was higher in these subjects compared to
control ones. Moreover, sORP was effective for discerning the
oxidative stress levels among MetS and T2D patients, since it was
associated with low GSH and high CARB levels. Thus, the use of such
a marker may be useful for identifying eagerly high oxidative
stress levels in MetS and T2D patients, and consequently reducing
complications by making the appropriate interventions. Moreover,
sORP may be useful for discerning high from low oxidative stress
levels in prediabetic subjects, which may also determine the type
of intervention.
Glossary
Abbreviations
Abbreviations:
|
CAT
|
catalase
|
|
EDTA
|
ethylenediaminetetraacetic acid
|
|
GSH
|
glutathione
|
|
H2O2
|
hydrogen peroxide
|
|
MetS
|
metabolic syndrome
|
|
ROS
|
reactive oxygen species
|
|
sORP
|
static oxidation reduction
potential
|
|
TAC
|
total antioxidant capacity
|
|
TBA
|
thiobarbituric acid
|
|
TBARS
|
thiobarbituric acid reactive
substances
|
|
TCA
|
trichloro-acetic acid
|
|
T2D
|
type 2 diabetes
|
References
|
1
|
Halliwell B: The wanderings of a free
radical. Free Radic Biol Med. 46:531–542. 2009. View Article : Google Scholar : PubMed/NCBI
|
|
2
|
Ghosh J and Myers CE: Inhibition of
arachidonate 5-lipoxygenase triggers massive apoptosis in human
prostate cancer cells. Proc Natl Acad Sci USA. 95:13182–13187.
1998. View Article : Google Scholar : PubMed/NCBI
|
|
3
|
Valko M, Leibfritz D, Moncol J, Cronin
MTD, Mazur M and Telser J: Free radicals and antioxidants in normal
physiological functions and human disease. Int J Biochem Cell Biol.
39:44–84. 2007. View Article : Google Scholar : PubMed/NCBI
|
|
4
|
Orient A, Donkó A, Szabó A, Leto TL and
Geiszt M: Novel sources of reactive oxygen species in the human
body. Nephrol Dial Transplant. 22:1281–1288. 2007. View Article : Google Scholar : PubMed/NCBI
|
|
5
|
Mylonas C and Kouretas D: Lipid
peroxidation and tissue damage. In Vivo. 13:295–309.
1999.PubMed/NCBI
|
|
6
|
Ford ES, Mokdad AH, Giles WH and Brown DW:
The metabolic syndrome and antioxidant concentrations: findings
from the Third National Health and Nutrition Examination Survey.
Diabetes. 52:2346–2352. 2003. View Article : Google Scholar : PubMed/NCBI
|
|
7
|
Jahan-Mihan A, Rodriguez J, Christie C,
Sadeghi M and Zerbe T: The Role of Maternal Dietary Proteins in
Development of Metabolic Syndrome in Offspring. Nutrients.
7:9185–9217. 2015. View Article : Google Scholar : PubMed/NCBI
|
|
8
|
Hansson GK: Inflammation, atherosclerosis,
and coronary artery disease. N Engl J Med. 352:1685–1695. 2005.
View Article : Google Scholar : PubMed/NCBI
|
|
9
|
Schleicher E, Weigert C, Rohrbach H,
Nerlich A, Bachmeier B and Friess U: Role of glucoxidation and
lipid oxidation in the development of atherosclerosis. Ann N Y Acad
Sci. 1043:343–354. 2005. View Article : Google Scholar : PubMed/NCBI
|
|
10
|
Urakawa H, Katsuki A, Sumida Y, Gabazza
EC, Murashima S, Morioka K, Maruyama N, Kitagawa N, Tanaka T, Hori
Y, et al: Oxidative stress is associated with adiposity and insulin
resistance in men. J Clin Endocrinol Metab. 88:4673–4676. 2003.
View Article : Google Scholar : PubMed/NCBI
|
|
11
|
Katsuki A, Sumida Y, Urakawa H, Gabazza
EC, Murashima S, Nakatani K, Yano Y and Adachi Y: Increased
oxidative stress is associated with serum levels of triglyceride,
insulin resistance, and hyperinsulinemia in Japanese metabolically
obese, normal-weight men. Diabetes Care. 27:631–632. 2004.
View Article : Google Scholar : PubMed/NCBI
|
|
12
|
Nikooyeh B and Neyestani TR: Oxidative
stress, type 2 diabetes and vitamin D: Past, present and future.
Diabetes Metab Res Rev: Sep. 26:2015(Epub ahead of print).
|
|
13
|
Giacco F and Brownlee M: Oxidative stress
and diabetic complications. Circ Res. 107:1058–1070. 2010.
View Article : Google Scholar : PubMed/NCBI
|
|
14
|
Folli F, Corradi D, Fanti P, Davalli A,
Paez A, Giaccari A, Perego C and Muscogiuri G: The role of
oxidative stress in the pathogenesis of type 2 diabetes mellitus
micro- and macrovascular complications: avenues for a
mechanistic-based therapeutic approach. Curr Diabetes Rev.
7:313–324. 2011. View Article : Google Scholar : PubMed/NCBI
|
|
15
|
Ha CY, Kim JY, Paik JK, Kim OY, Paik Y-H,
Lee EJ and Lee JH: The association of specific metabolites of lipid
metabolism with markers of oxidative stress, inflammation and
arterial stiffness in men with newly diagnosed type 2 diabetes.
Clin Endocrinol (Oxf). 76:674–682. 2012. View Article : Google Scholar : PubMed/NCBI
|
|
16
|
Yorek MA: The role of oxidative stress in
diabetic vascular and neural disease. Free Radic Res. 37:471–480.
2003. View Article : Google Scholar : PubMed/NCBI
|
|
17
|
Aroor AR and DeMarco VG: Oxidative stress
and obesity: the chicken or the egg? Diabetes. 63:2216–2218. 2014.
View Article : Google Scholar : PubMed/NCBI
|
|
18
|
Dalle-Donne I, Rossi R, Colombo R,
Giustarini D and Milzani A: Biomarkers of oxidative damage in human
disease. Clin Chem. 52:601–623. 2006. View Article : Google Scholar : PubMed/NCBI
|
|
19
|
Ogino K and Wang DH: Biomarkers of
oxidative/nitrosative stress: An approach to disease prevention.
Acta Med Okayama. 61:181–189. 2007.PubMed/NCBI
|
|
20
|
Stagos D, Goutzourelas N, Bar-Or D,
Ntontou AM, Bella E, Becker AT, Statiri A, Kafantaris I and
Kouretas D: Application of a new oxidation-reduction potential
assessment method in strenuous exercise-induced oxidative stress.
Redox Rep. 20:154–162. 2015. View Article : Google Scholar : PubMed/NCBI
|
|
21
|
Stagos D, Goutzourelas N, Ntontou AM,
Kafantaris I, Deli CK, Poulios A, Jamurtas AZ, Bar-Or D and
Kouretas D: Assessment of eccentric exercise-induced oxidative
stress using oxidation-reduction potential markers. Oxid Med Cell
Longev. 2015:2046152015. View Article : Google Scholar : PubMed/NCBI
|
|
22
|
Spanidis Y, Goutzourelas N, Stagos D,
Kolyva AS, Gogos CA, Bar-Or D and Kouretas D: Assessment of
oxidative stress in septic and obese patients using markers of
oxidation-reduction potential. In Vivo. 29:595–600. 2015.PubMed/NCBI
|
|
23
|
Spanidis Y, Goutzourelas N, Stagos D,
Mpesios A, Priftis A, Bar-Or D, Spandidos DA, Tsatsakis AM, Leon G
and Kouretas D: Variations in oxidative stress markers in elite
basketball players at the beginning and end of a season. Exp Ther
Med. 11:147–153. 2016.PubMed/NCBI
|
|
24
|
Keles MS, Taysi S, Sen N, Aksoy H and
Akçay F: Effect of corticosteroid therapy on serum and CSF
malondialdehyde and antioxidant proteins in multiple sclerosis. Can
J Neurol Sci. 28:141–143. 2001.PubMed/NCBI
|
|
25
|
Patsoukis N, Zervoudakis G, Panagopoulos
NT, Georgiou CD, Angelatou F and Matsokis NA: Thiol redox state
(TRS) and oxidative stress in the mouse hippocampus after
pentylenetetrazol-induced epileptic seizure. Neurosci Lett.
357:83–86. 2004. View Article : Google Scholar : PubMed/NCBI
|
|
26
|
Reddy YN, Murthy SV, Krishna DR and
Prabhakar MC: Role of free radicals and antioxidants in
tuberculosis patients. Indian J Tuberc. 51:213–218. 2004.
|
|
27
|
Aebi H: Catalase in vitro. Methods
Enzymol. 105:121–126. 1984. View Article : Google Scholar : PubMed/NCBI
|
|
28
|
Janaszewska A and Bartosz G: Assay of
total antioxidant capacity: Comparison of four methods as applied
to human blood plasma. Scand J Clin Lab Invest. 62:231–236. 2002.
View Article : Google Scholar : PubMed/NCBI
|
|
29
|
Bloomer RJ and Fisher-Wellman KH: Blood
oxidative stress biomarkers: influence of sex, exercise training
status, and dietary intake. Gend Med. 5:218–228. 2008. View Article : Google Scholar : PubMed/NCBI
|
|
30
|
Ristoff E and Larsson A: Oxidative stress
in inborn errors of metabolism: lessons from glutathione
deficiency. J Inherit Metab Dis. 25:223–226. 2002. View Article : Google Scholar : PubMed/NCBI
|
|
31
|
Wilson PWF and Grundy SM: The metabolic
syndrome: practical guide to origins and treatment: Part I.
Circulation. 108:1422–1424. 2003. View Article : Google Scholar : PubMed/NCBI
|
|
32
|
Balkau B, Charles MA, Drivsholm T, et al:
European Group For The Study Of Insulin Resistance (EGIR):
Frequency of the WHO metabolic syndrome in European cohorts, and an
alternative definition of an insulin resistance syndrome. Diabetes
Metab. 28:364–376. 2002.PubMed/NCBI
|
|
33
|
Furukawa S, Fujita T, Shimabukuro M, Iwaki
M, Yamada Y, Nakajima Y, Nakayama O, Makishima M, Matsuda M and
Shimomura I: Increased oxidative stress in obesity and its impact
on metabolic syndrome. J Clin Invest. 114:1752–1761. 2004.
View Article : Google Scholar : PubMed/NCBI
|
|
34
|
Roberts CK and Sindhu KK: Oxidative stress
and metabolic syndrome. Life Sci. 84:705–712. 2009. View Article : Google Scholar : PubMed/NCBI
|
|
35
|
Ceriello A and Motz E: Is oxidative stress
the pathogenic mechanism underlying insulin resistance, diabetes,
and cardiovascular disease? The common soil hypothesis revisited.
Arterioscler Thromb Vasc Biol. 24:816–823. 2004. View Article : Google Scholar : PubMed/NCBI
|
|
36
|
Armutcu F, Ataymen M, Atmaca H and Gurel
A: Oxidative stress markers, C-reactive protein and heat shock
protein 70 levels in subjects with metabolic syndrome. Clin Chem
Lab Med. 46:785–790. 2008. View Article : Google Scholar : PubMed/NCBI
|
|
37
|
Akbar S, Bellary S and Griffiths HR:
Dietary antioxidant interventions in type 2 diabetes patients: A
meta-analysis. Br J Diabetes Vasc Dis. 11:62–68. 2011. View Article : Google Scholar
|
|
38
|
Neyestani TR, Shariatzadeh N, Gharavi A,
Kalayi A and Khalaji N: Physiological dose of lycopene suppressed
oxidative stress and enhanced serum levels of immunoglobulin M in
patients with Type 2 diabetes mellitus: A possible role in the
prevention of long-term complications. J Endocrinol Invest.
30:833–838. 2007. View Article : Google Scholar : PubMed/NCBI
|
|
39
|
Neyestani TR, Shariat-Zadeh N, Gharavi A,
Kalayi A and Khalaji N: The opposite associations of lycopene and
body fat mass with humoral immunity in type 2 diabetes mellitus: A
possible role in atherogenesis. Iran J Allergy Asthma Immunol.
6:79–87. 2007.PubMed/NCBI
|
|
40
|
Vávrová L, Kodydková J, Zeman M,
Dušejovská M, Macášek J, Staňková B, Tvrzická E and Zák A: Altered
activities of antioxidant enzymes in patients with metabolic
syndrome. Obes Facts. 6:39–47. 2013. View Article : Google Scholar : PubMed/NCBI
|
|
41
|
Hakki Kalkan I and Suher M: The
relationship between the level of glutathione, impairment of
glucose metabolism and complications of diabetes mellitus. Pak J
Med Sci. 29:938–942. 2013.PubMed/NCBI
|
|
42
|
Seghrouchni I, Drai J, Bannier E, Rivière
J, Calmard P, Garcia I, Orgiazzi J and Revol A: Oxidative stress
parameters in type I, type II and insulin-treated type 2 diabetes
mellitus; insulin treatment efficiency. Clin Chim Acta. 321:89–96.
2002. View Article : Google Scholar : PubMed/NCBI
|
|
43
|
Ciuchi E, Odetti P and Prando R:
Relationship between glutathione and sorbitol concentrations in
erythrocytes from diabetic patients. Metabolism. 45:611–613. 1996.
View Article : Google Scholar : PubMed/NCBI
|
|
44
|
Mazzetti AP, Fiorile MC, Primavera A and
Lo Bello M: Glutathione transferases and neurodegenerative
diseases. Neurochem Int. 82:10–18. 2015. View Article : Google Scholar : PubMed/NCBI
|
|
45
|
Pérez S, Pereda J, Sabater L and Sastre J:
Redox signaling in acute pancreatitis. Redox Biol. 5:1–14. 2015.
View Article : Google Scholar : PubMed/NCBI
|
|
46
|
Lee AY and Chung SS: Contributions of
polyol pathway to oxidative stress in diabetic cataract. FASEB J.
13:23–30. 1999.PubMed/NCBI
|
|
47
|
Góth L: Reactive oxygen species, hydrogen
peroxide, catalase and diabetes mellitus. Redox Rep. 11:281–282.
2006. View Article : Google Scholar : PubMed/NCBI
|
|
48
|
Weidig P, McMaster D and Bayraktutan U:
High glucose mediates pro-oxidant and antioxidant enzyme activities
in coronary endothelial cells. Diabetes Obes Metab. 6:432–441.
2004. View Article : Google Scholar : PubMed/NCBI
|
|
49
|
Manea A, Constantinescu E, Popov D and
Raicu M: Changes in oxidative balance in rat pericytes exposed to
diabetic conditions. J Cell Mol Med. 8:117–126. 2004. View Article : Google Scholar : PubMed/NCBI
|
|
50
|
Tiedge M, Lortz S, Drinkgern J and Lenzen
S: Relation between antioxidant enzyme gene expression and
antioxidative defense status of insulin-producing cells. Diabetes.
46:1733–1742. 1997. View Article : Google Scholar : PubMed/NCBI
|
|
51
|
Venturini D, Simão ANC and Dichi I:
Advanced oxidation protein products are more related to metabolic
syndrome components than biomarkers of lipid peroxidation. Nutr
Res. 35:759–765. 2015. View Article : Google Scholar : PubMed/NCBI
|
|
52
|
Sohet FM, Neyrinck AM, Dewulf EM, Bindels
LB, Portois L, Malaisse WJ, Carpentier YA, Cani PD and Delzenne NM:
Lipid peroxidation is not a prerequisite for the development of
obesity and diabetes in high-fat-fed mice. Br J Nutr. 102:462–469.
2009. View Article : Google Scholar : PubMed/NCBI
|
|
53
|
Tabak O, Gelisgen R, Erman H, Erdenen F,
Muderrisoglu C, Aral H and Uzun H: Oxidative lipid, protein, and
DNA damage as oxidative stress markers in vascular complications of
diabetes mellitus. Clin Invest Med. 34:E163–E171. 2011.PubMed/NCBI
|
|
54
|
Cakatay U: Protein oxidation parameters in
type 2 diabetic patients with good and poor glycaemic control.
Diabetes Metab. 31:551–557. 2005. View Article : Google Scholar : PubMed/NCBI
|
|
55
|
Witko-Sarsat V, Friedlander M,
Capeillère-Blandin C, Nguyen-Khoa T, Nguyen AT, Zingraff J, Jungers
P and Descamps-Latscha B: Advanced oxidation protein products as a
novel marker of oxidative stress in uremia. Kidney Int.
49:1304–1313. 1996. View Article : Google Scholar : PubMed/NCBI
|
|
56
|
Muscelli E, Natali A, Bianchi S, Bigazzi
R, Galvan AQ, Sironi AM, Frascerra S, Ciociaro D and Ferrannini E:
Effect of insulin on renal sodium and uric acid handling in
essential hypertension. Am J Hypertens. 9:746–752. 1996. View Article : Google Scholar : PubMed/NCBI
|
|
57
|
Watson JD: Type 2 diabetes as a redox
disease. Lancet. 383:841–843. 2014. View Article : Google Scholar : PubMed/NCBI
|
|
58
|
Sharoff CG, Hagobian TA, Malin SK, Chipkin
SR, Yu H, Hirshman MF, Goodyear LJ and Braun B: Combining
short-term metformin treatment and one bout of exercise does not
increase insulin action in insulin-resistant individuals. Am J
Physiol Endocrinol Metab. 298:E815–E823. 2010. View Article : Google Scholar : PubMed/NCBI
|
|
59
|
Ron D and Harding HP: Protein-folding
homeostasis in the endoplasmic reticulum and nutritional
regulation. Cold Spring Harb Perspect Biol. 4:42012. View Article : Google Scholar
|
|
60
|
Nardai G, Stadler K, Papp E, Korcsmáros T,
Jakus J and Csermely P: Diabetic changes in the redox status of the
microsomal protein folding machinery. Biochem Biophys Res Commun.
334:787–795. 2005. View Article : Google Scholar : PubMed/NCBI
|
|
61
|
Ristow M, Zarse K, Oberbach A, Klöting N,
Birringer M, Kiehntopf M, Stumvoll M, Kahn CR and Blüher M:
Antioxidants prevent health-promoting effects of physical exercise
in humans. Proc Natl Acad Sci USA. 106:8665–8670. 2009. View Article : Google Scholar : PubMed/NCBI
|
|
62
|
Schoenmakers E, Agostini M, Mitchell C,
Schoenmakers N, Papp L, Rajanayagam O, Padidela R, Ceron-Gutierrez
L, Doffinger R, Prevosto C, et al: Mutations in the selenocysteine
insertion sequence-binding protein 2 gene lead to a multisystem
selenoprotein deficiency disorder in humans. J Clin Invest.
120:4220–4235. 2010. View Article : Google Scholar : PubMed/NCBI
|