Introduction
Coronary artery disease is a defect with a narrowing
of the coronary arteries that supply blood and oxygen to the heart
(1). Off-pump coronary artery bypass
(OPCAB) surgery, in which veins or arteries are grafted to the
coronary arteries to bypass atherosclerotic narrowing and improve
the blood supply to the heart muscle, reduces the risk of mortality
from coronary artery disease (2).
However, coronary patients who have undergone OPCAB grafting often
suffer from disorders of coagulation and hemostasis (3). Therefore, it is necessary to research
the molecular mechanisms underlying the effect of OPCAB.
Expression profile analyses have been used to
examine the myocardial stress response to cardiac surgery (4–6). In
addition, molecular biology studies have confirmed that several
genes, including interleukin 6 (IL6), IL8 and activating
transcription factor 3 (ATF3), and certain biological processes are
associated with the effect of OPCAB grafting. IL6 and IL8 proteins,
released by ischemic cardiac myocytes, are induced following acute
ischemia (5,7). Moreover, Tomic et al found that
the expression of IL6 tended to increase after OPCAB grafting
(8), and Ghorbel et al showed
that ventricular heart cells may undergo alterations in chemokine
and plasma cytokine levels following OPCAB surgery (9). Furthermore, several important miRNA
regulatory relationships in OPCAB samples have been investigated.
For example, microRNA (MIR)-494 targets the 3′ untranslated region
of ATF3 reporter and decreases ATF3 mRNA expression (10,11).
The identification of sensitive genes and miRNAs has
become the focus for establishing suitable therapeutic strategies,
and gene expression profiling techniques have been widely used to
analyze the effects of OPCAB. A number of studies have reported
some specific gene expression changes in samples following OPCAB
surgery (9,12,13),
while a variety of genes have been studied in the fundamental
research of OPCAB. Studies have screened for genes associated with
the levels of chemokines and cytokine following OPCAB surgery, but
little attention has been paid to the corresponding miRNA
transcripts (8). In addition, the
molecular mechanisms of complications, including hemostasis and
coagulation disorders, caused by OPCAB grafting are unclear
(14).
In the present study, the data in the gene
expression series record GSE12486 were downloaded, to screen for
differentially expressed genes (DEGs) between samples obtained pre-
and post-OPCAB surgery, followed by function and pathway enrichment
analysis, as well as protein-protein interaction (PPI) network
construction. Based on expression profiles obtained by microarray
analysis, Gene Set Enrichment Analysis (GSEA) was used to enrich
the miRNAs predicted to have a correlation with OPCAB grafting.
Finally, miRNA regulatory networks were constructed to investigate
the association between miRNA and DEGs.
Materials and methods
Microarray data
The gene expression profile GSE12486 was obtained
from the Gene Expression Omnibus database (GEO; http://www.ncbi.nlm.nih.gov/geo/) (9). The platform was GPL570 Affymetrix Human
Genome U133 Plus 2.0 Array (Affymetrix, Inc., Santa Clara, CA,
USA). A total of 10 myocardial samples obtained prior to and after
grafting were available; they were collected from 5 patients
undergoing OPCAB grafting with cardiopulmonary bypass and cardiac
arrest. The pre-surgery samples contained GSM313629, GSM313631,
GSM313633, GSM313635 and GSM313637, while post-surgery samples
included GSM313638, GSM313639, GSM313640, GSM313641 and
GSM313642.
Data preprocessing and DEG
screening
The original data were read by the Affymetrix
package with R-based software and processed by the Robust
Multi-array Analysis (RMA) method (15). The processed data then underwent
normalization with a universal background in order to evaluate the
expression values. The limma multiple linear regression package
(16) was applied for the
calculation and analysis of DEGs, with further rectification by the
Bayes method (17). The genes with
P<0.01 and |log (fold change)|>1 were selected as DEGs.
Principal component analysis
(PCA)
The PCA was conducted on the basis of the expression
profile of DEGs. PCA is a multivariate statistical analysis that
uses linear transformation to convert multiple correlated variables
into a set of important linearly uncorrelated variables (18).
Pathway enrichment analysis
Database for Annotation, Visualization and
Integrated Discovery (DAVID) is a web-based tool for extracting the
biological meaning of large numbers of genes (19). It was used to carry out Gene Ontology
(GO) function and Kyoto Encyclopedia of Genes and Genomes (KEGG)
pathway enrichment analysis of upregulated DEGs. Based on the
principle of hypergeometric distribution, GO and KEGG terms were
enriched with the threshold of P<0.01.
Protein-protein interaction (PPI)
network construction
A PPI network of DEGs was constructed using the
Search Tool for Retrieval of Interacting Genes (STRING) database,
which provides integrated knowledge of the known and predicted
associations for protein networks (20). The PPI network comprised ‘nodes’ and
‘edges’; each protein was represented by a node, while the
interaction of pairwise proteins was shown by an edge. The 5 nodes
with the greatest number of connections (high degree) were further
screened as the ‘hub’ genes.
miRNA prediction analysis
GSEA is a method for the enrichment analysis of a
gene set based on whole genome expression profiling (21). On the basis of the expression
profiles obtained by microarray analysis, GSEA was used to enrich
the disease-related miRNAs. The related miRNAs were screened with a
threshold of false discovery rate (FDR) of <0.05.
miRNA regulatory networks
Cytoscape is an open software platform used for
visualizing complex networks and integrating these networks with
any type of attribute data (22). It
was applied for building the regulatory networks of DEGs that were
regulated by miRNA.
Results
Data standardization and DEG
screening
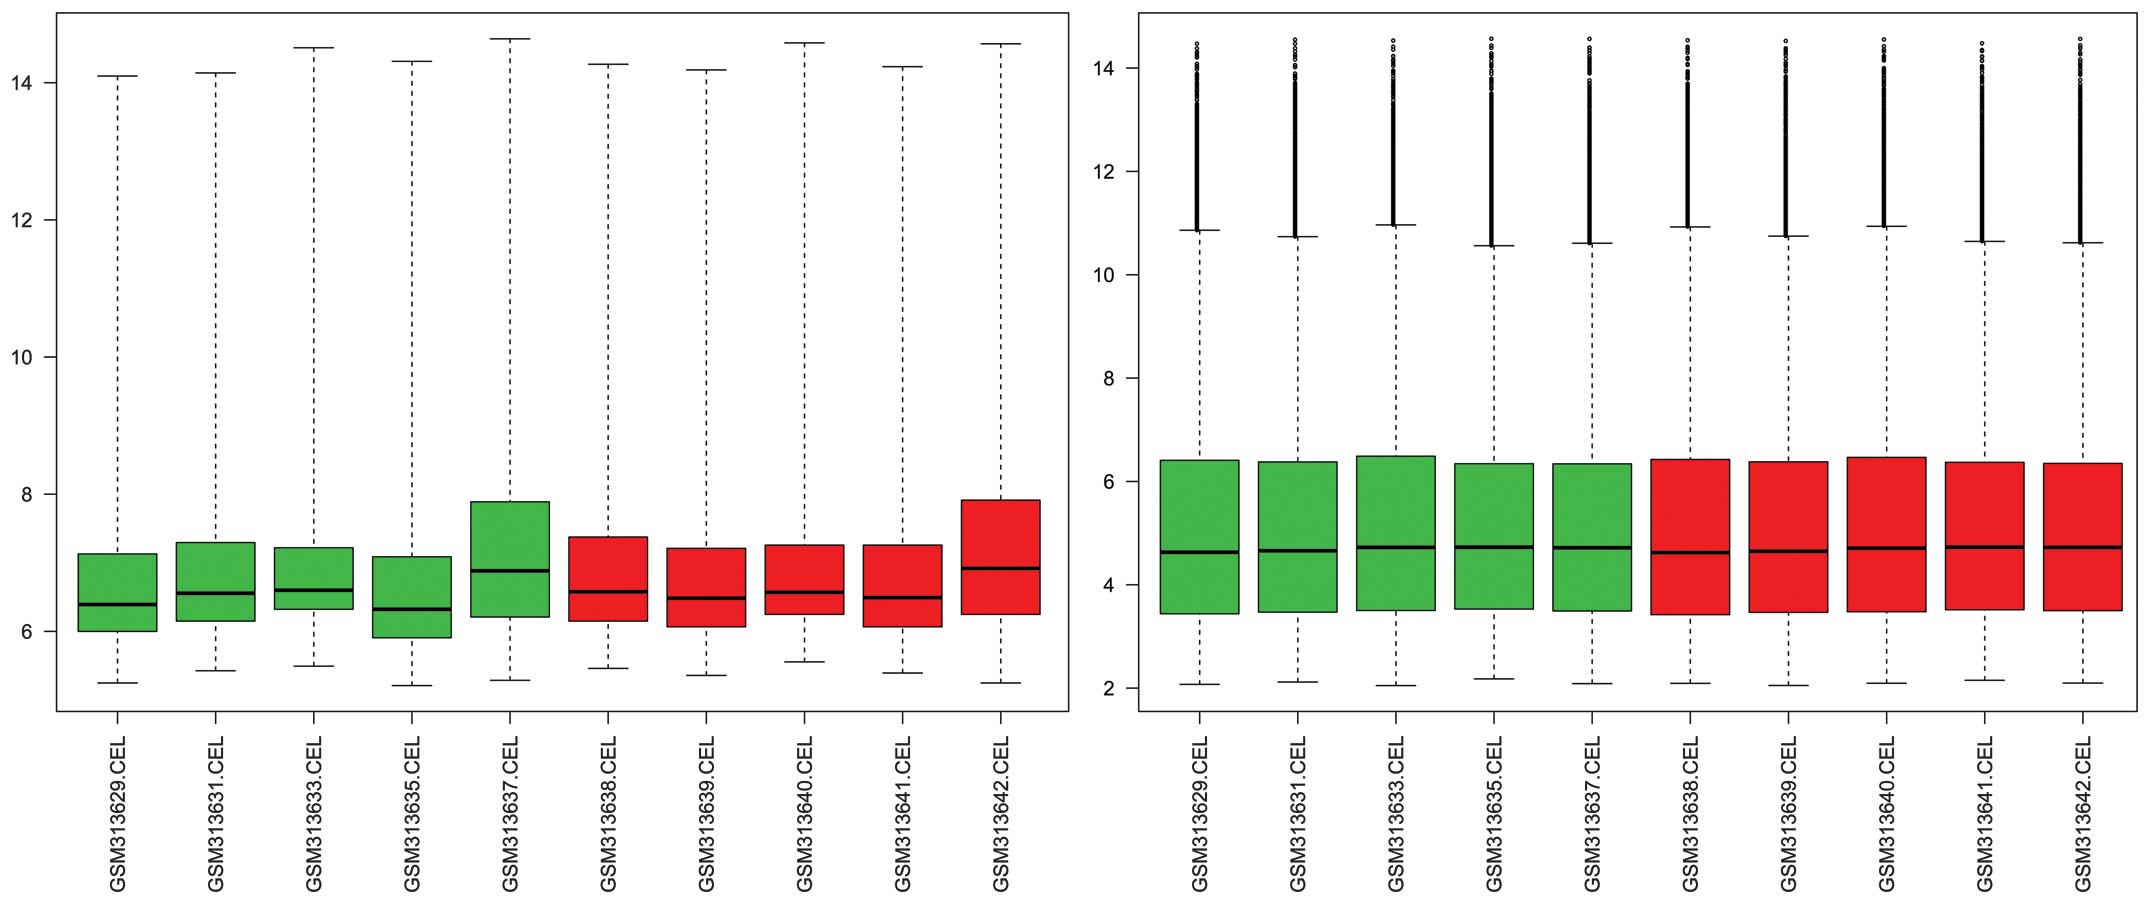
After processing by the RMA method, the expression
data presented good standardization in the samples taken pre- and
post-surgery (Fig. 1). On the basis
of the differential expression analysis for GSE12486, a total of 64
DEGs with |log2FC| >1 and P<0.01 were obtained, including 63
upregulated genes and 1 downregulated gene. Perilipin 1 (PLIN1) was
the only downregulated gene. The top 10 DEGs are presented in
Table I.
 | Table I.Top 10 differentially expressed genes
(DEGs). |
Table I.
Top 10 differentially expressed genes
(DEGs).
| DEG | Log2FC | P-value |
|---|
| FOS | 3.855915 | 0.000293 |
| CCL3 | 3.369698 | 1.05E-07 |
| CCL3L1 | 3.369698 | 1.05E-07 |
| CCL3L3 | 3.369698 | 1.05E-07 |
| EGR2 | 3.149878 | 9.33E-06 |
| NR4A2 | 3.015238 | 3.16E-05 |
| ZFP36 | 2.983598 | 2.55E-06 |
| FOSB | 2.974505 | 0.000304 |
| EGR3 | 2.961837 | 4.57E-05 |
| CH25H | 2.734594 | 0.000209 |
PCA
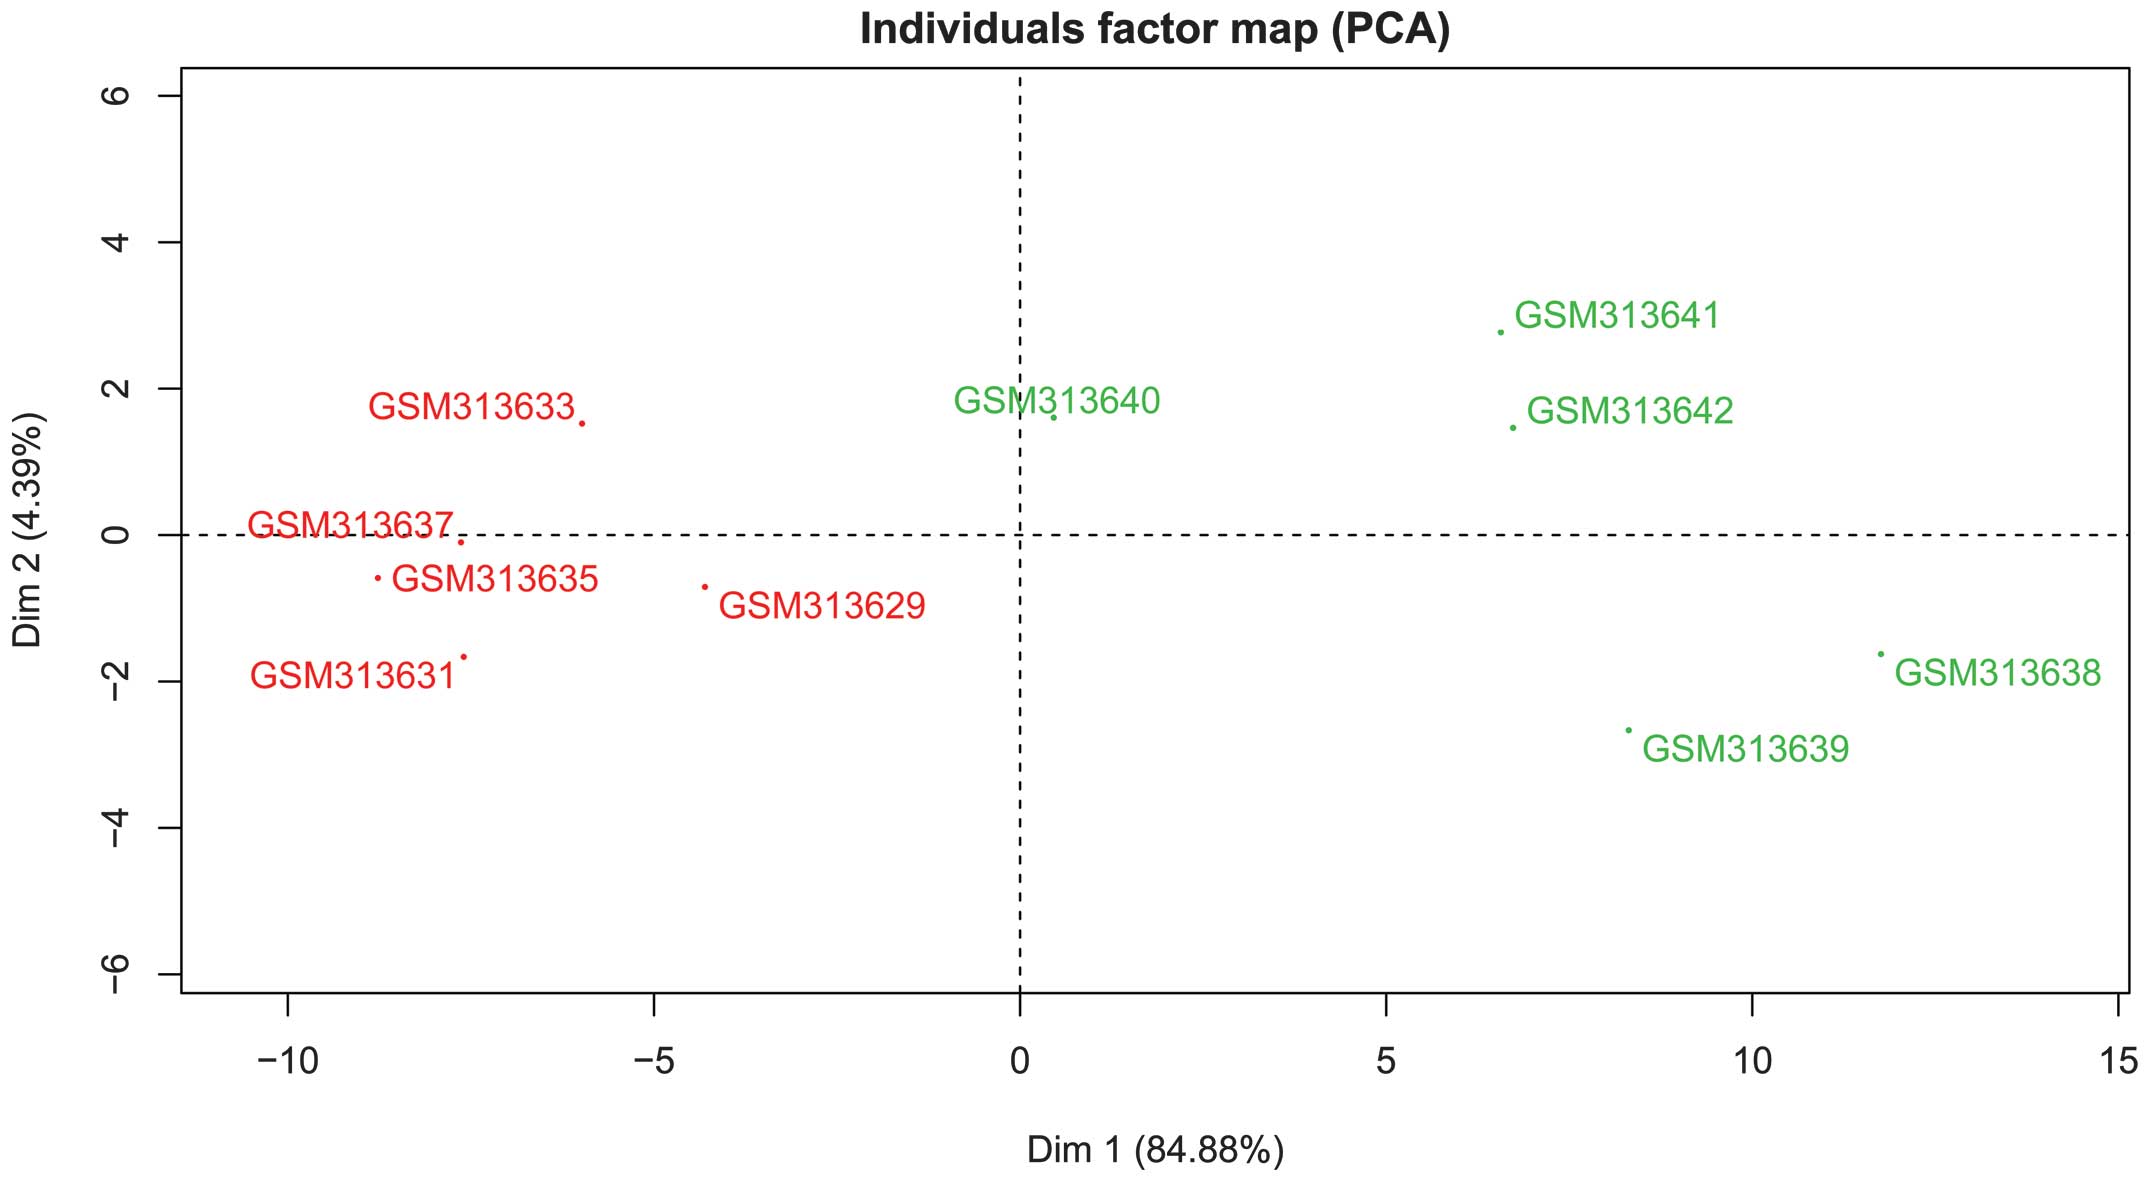
The DEGs were processed by the PCA method. GSM313629
and GSM313640 samples were the first principal components pre- and
post grafting, respectively. As shown in Fig. 2, the first two principal components
(score, 84.88%) were well able to distinguish between the samples
taken pre- and post-surgery.
GO and KEGG pathway enrichment
analysis
GO enrichment analysis of upregulated and
downregulated DEGs was performed using the DAVID tool. In total, 20
GO terms were found to be enriched by the upregulated DEGs
(Table II), of which several
important functions were associated with immune function, such as
inflammatory response, defense response, response to wounding and
chemokine receptor binding. IL6, IL8, chemokine (C-C motif) ligand
4 (CCL4), CCL3, CCL2, chemokine (C-X-C motif) ligand 2 (CXCL2) and
nuclear factor of κ light polypeptide gene enhancer in B-cells
inhibitor, ζ (NFKBIZ) were among the DEGs enriched in these
significant functions.
| Table II.Functional enrichment analysis for
upregulated DEGs. |
Table II.
Functional enrichment analysis for
upregulated DEGs.
| Category | GO id | Description |
P-valuea | Genes |
|---|
| BP | GO:0007610 | Behavior | 1.57E-15 | EGR1, IL6, CCL3,
EGR2, CCL2, C5AR1, IL8, PTGS2, S100A9, CXCL2, NR4A2, CCL8, FOSB,
NR4A3, CCL4, PROK2, FOS, CXCR4, CCL3L1, JUN, CCL3L3, CYR61 |
| BP | GO:0042330 | Taxis | 2.21E-12 | CCL3, IL6, CCL2,
C5AR1, IL8, CXCL2, S100A9, CCL8, CCL4, PROK2, CXCR4, CCL3L1,
CCL3L3, CYR61 |
| BP | GO:0006935 | Chemotaxis | 2.21E-12 | CCL3, IL6, CCL2,
C5AR1, IL8, CXCL2, S100A9, CCL8, CCL4, PROK2, CXCR4, CCL3L1,
CCL3L3, CYR61 |
| BP | GO:0006954 | Inflammatory
response | 3.29E-12 | NFKBIZ, IL6, CCL3,
CCL2, IL8, S100A8, CXCL2, S100A9, CCL8, CCL4, S100A12, FOS, PROK2,
CXCR4, CCL3L1, CCL3L3, SELE |
| BP | GO:0007626 | Locomotory
behavior | 8.03E-11 | CCL3, IL6, CCL2,
C5AR1, IL8, CXCL2, S100A9, NR4A2, CCL8, CCL4, PROK2, CXCR4, CCL3L1,
CCL3L3, CYR61 |
| BP | GO:0006952 | Defense
response | 3.10E-10 | NFKBIZ, IL6, CCL3,
CCL2, C5AR1, IL8, S100A8, CXCL2, S100A9, CCL8, CCL4, S100A12, CD83,
PROK2, FOS, CXCR4, CCL3L1, CCL3L3, SELE |
| BP | GO:0009611 | Response to
wounding | 3.11E-09 | NFKBIZ, IL6, CCL3,
CCL2, IL8, S100A8, CXCL2, S100A9, CCL8, CCL4, S100A12, FOS, PROK2,
CXCR4, CCL3L1, CCL3L3, SELE |
| BP | GO:0010033 | Response to organic
substance | 3.51E-09 | EGR1, IL6, EGR2,
CCL2, PTGS2, SOCS3, NR4A2, NR4A3, PMAIP1, JUNB, CD83, FOS, DUSP1,
BTG2, JUN, SELE, MYC, CYR61 |
| BP | GO:0045944 | Positive regulation
of transcription from RNA polymerase II promoter | 3.39E-07 | EGR1, FOS, IL6,
EGR2, JUN, CSRNP1, NR4A2, ABRA, NR4A3, MYC, KLF4, JUNB |
| BP | GO:0002237 | Response to
molecule of bacterial origin | 1.55E-06 | FOS, IL6, CCL2,
PTGS2, SOCS3, JUN, SELE |
| MF | GO:0008009 | Chemokine
activity | 2.25E-08 | CCL3, CCL2, IL8,
CCL3L1, CXCL2, CCL3L3, CCL8, CCL4 |
| MF | GO:0042379 | Chemokine receptor
binding | 3.34E-08 | CCL3, CCL2, IL8,
CCL3L1, CXCL2, CCL3L3, CCL8, CCL4 |
| MF | GO:0003700 | Transcription
factor activity | 2.99E-06 | EGR1, MAFF, EGR3,
EGR2, CEBPD, NR4A2, NR4A3, FOSB, JUNB, FOS, ATF3, JUN, CSRNP1,
BHLHE40, MYC, KLF4 |
| MF | GO:0005125 | Cytokine
activity | 1.02E-05 | CCL3, IL6, CCL2,
IL8, CCL3L1, CXCL2, CCL3L3, CCL8, CCL4 |
| MF | GO:0043565 | Sequence-specific
DNA binding | 1.84E-05 | EGR1, MAFF, FOS,
ATF3, CEBPD, JUN, NR4A2, NR4A3, FOSB, MYC, KLF4, JUNB |
| MF | GO:0030528 | Transcription
regulator activity | 3.70E-05 | EGR1, MAFF, EGR3,
EGR2, CEBPD, NR4A2, NR4A3, FOSB, JUNB, FOS, ATF3, JUN, CSRNP1,
ABRA, BHLHE40, SIK1, MYC, KLF4 |
| MF | GO:0003690 | Double-stranded DNA
binding | 3.76E-05 | EGR1, FOS, JUN,
MYC, KLF4, JUNB |
| MF | GO:0043566 | Structure-specific
DNA binding | 2.52E-04 | EGR1, FOS, JUN,
MYC, KLF4, JUNB |
| MF | GO:0003677 | DNA binding | 0.002359 | ZFP36, EGR1, MAFF,
EGR3, EGR2, CEBPD, NR4A2, NR4A3, FOSB, ZNF331, JUNB, FOS, ATF3,
JUN, CSRNP1, BHLHE40, SOX17, MYC, KLF4 |
| MF | GO:0008201 | Heparin
binding | 0.007664 | CCL2, CCL8,
ADAMTS1, CYR61 |
The DAVID tool was also used for KEGG pathway
analysis of the screened upregulated DEGs. Only 5 pathways were
enriched (Table III), including
the chemokine signaling pathway (P=2.23E-05), cytokine-cytokine
receptor interaction (P=2.24E-05), Toll-like receptor signaling
pathway (P=1.08E-04), NOD-like receptor signaling pathway
(P=2.09E-04) and mitogen-activated protein kinase (MAPK) signaling
pathway (P=0.008586). The most significant pathway was the
chemokine signaling pathway, which was enriched by the following
upregulated DEGs: CCL3, CCL2, IL8, CXCR4, CCL3L1, CXCL2, CCL3L3,
CCL8 and CCL4.
| Table III.Results of KEGG pathway enrichment
analysis for upregulated DEGs. |
Table III.
Results of KEGG pathway enrichment
analysis for upregulated DEGs.
| Term | Description | P-value | Genes |
|---|
| hsa04062 | Chemokine signaling
pathway | 2.23E-05 | CCL3, CCL2, IL8,
CXCR4, CCL3L1, CXCL2, CCL3L3, CCL8, CCL4 |
| hsa04060 | Cytokine-cytokine
receptor interaction | 2.24E-05 | CCL3, IL6, CCL2,
IL8, CXCR4, CCL3L1, CXCL2, CCL3L3, CCL8, CCL4 |
| hsa04620 | Toll-like receptor
signaling pathway | 1.08E-04 | FOS, CCL3, IL6,
IL8, JUN, CCL4 |
| hsa04621 | NOD-like receptor
signaling pathway | 2.09E-04 | IL6, CCL2, IL8,
CXCL2, CCL8 |
| hsa04010 | MAPK signaling
pathway | 0.008586 | DUSP5, FOS, DUSP1,
JUN, GADD45B, MYC |
PPI network construction
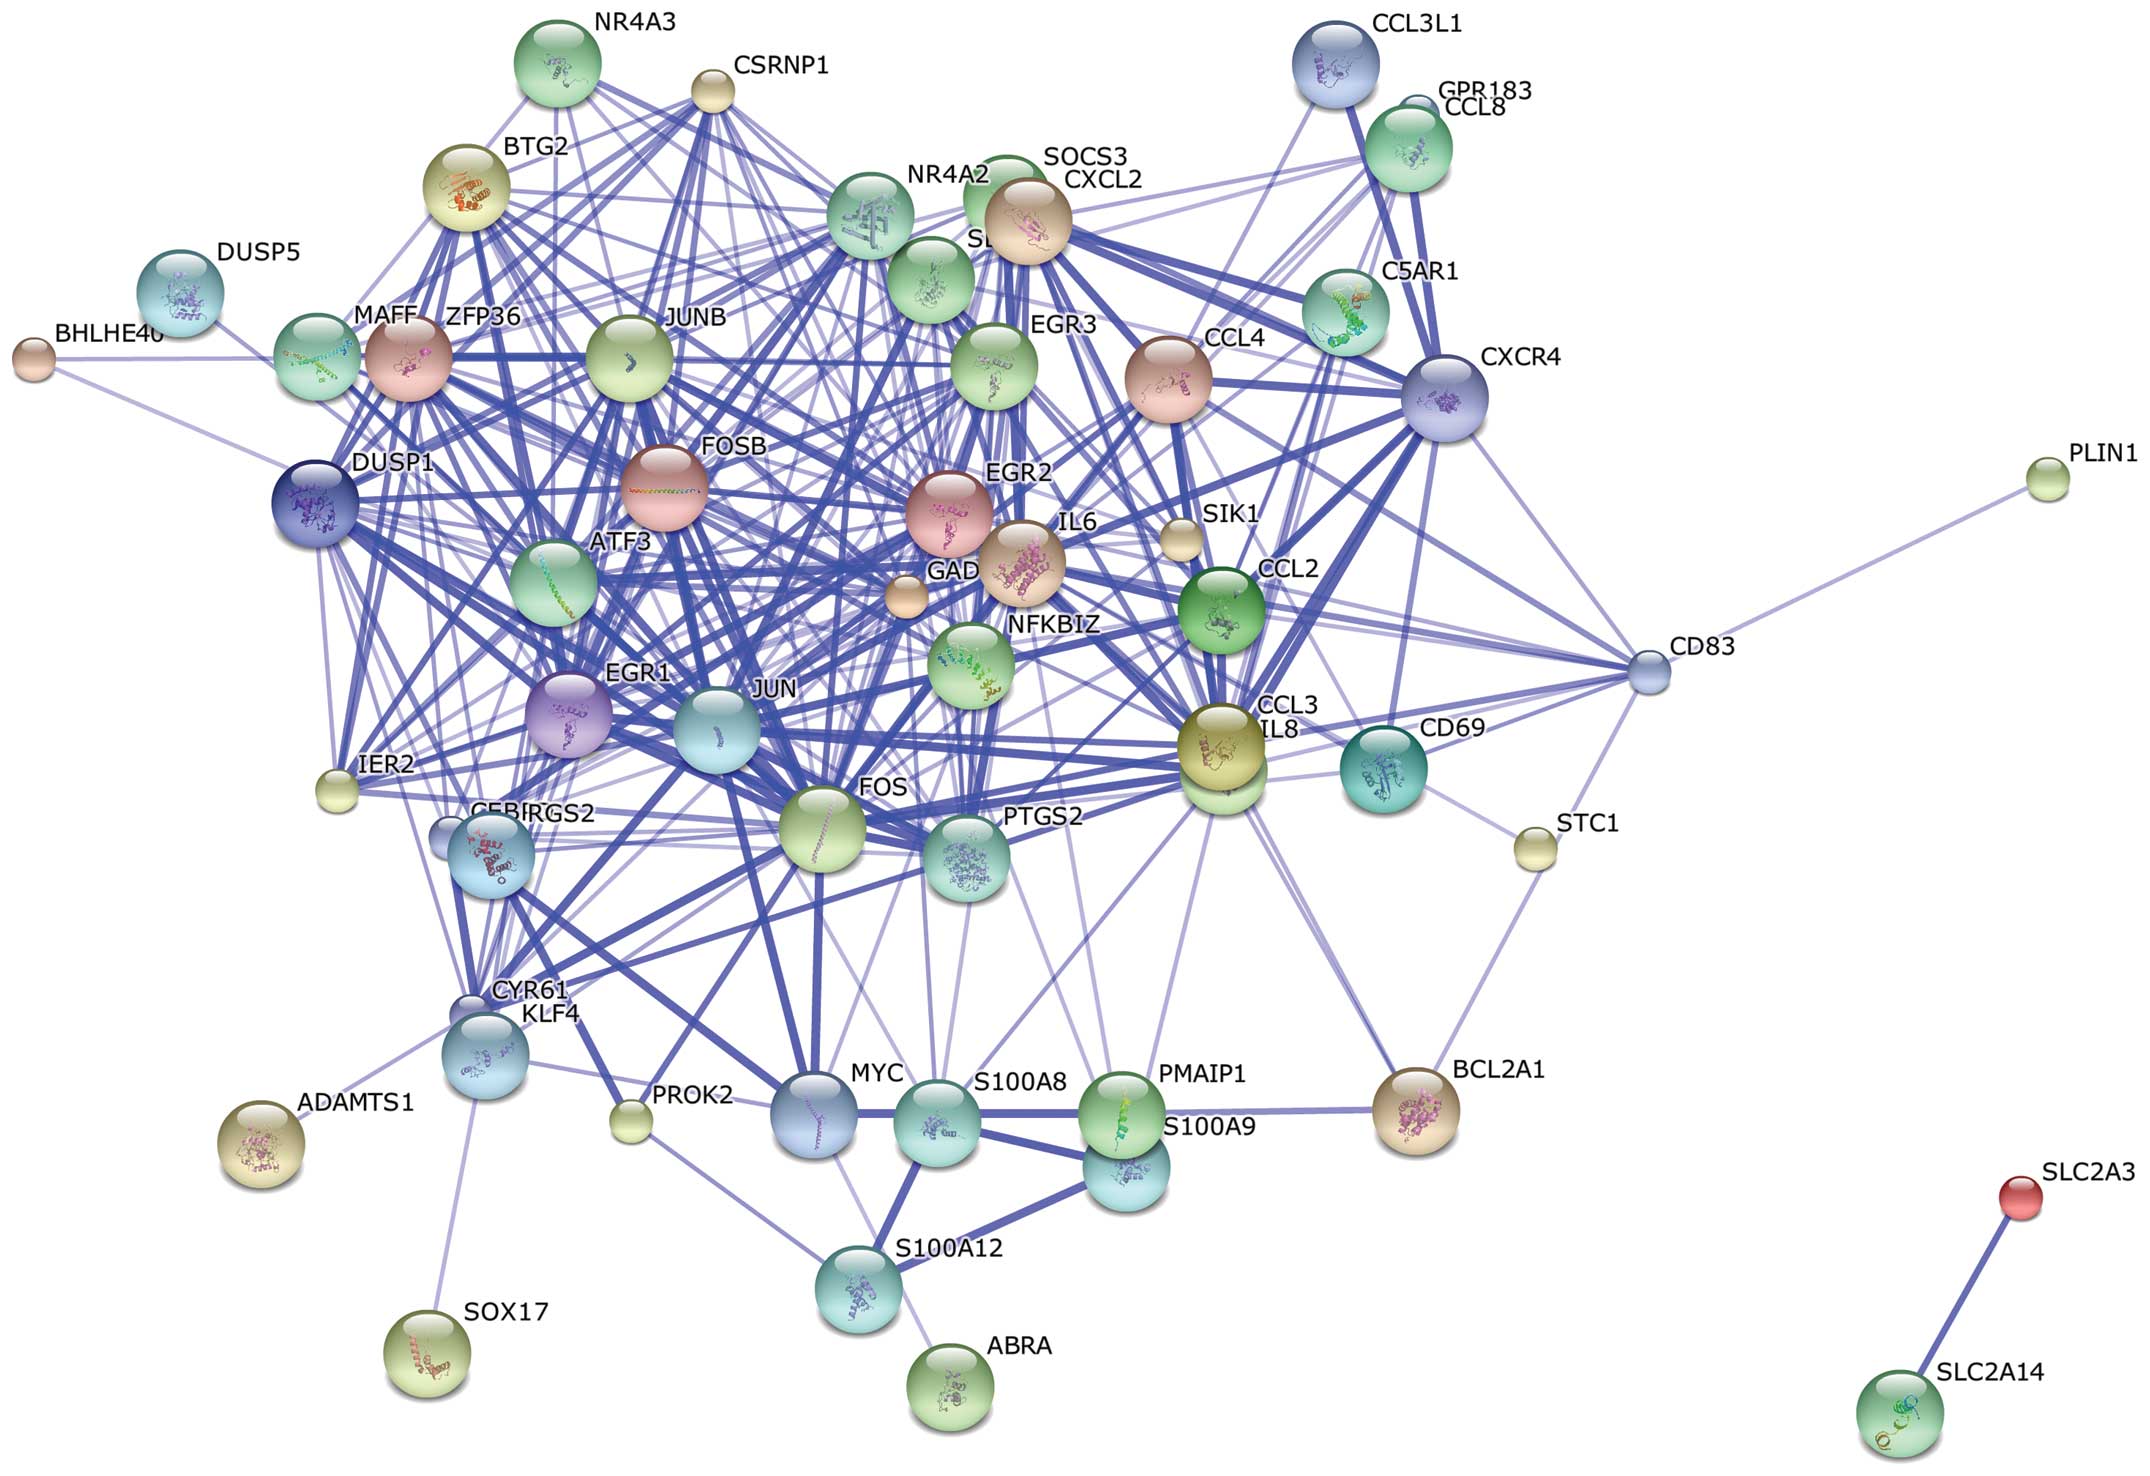
The PPI network, which contained 55 nodes and 234
edges, was constructed on the basis of the STRING database analysis
(Fig. 3). Based on the degree
(connectivity) of the nodes, the top 10 upregulated hub nodes with
higher degrees were screened. These hub genes included FBJ murine
osteosarcoma viral oncogene homolog (FOS), jun proto-oncogene
(JUN), ATF3, IL6, FBJ murine osteosarcoma viral oncogene homolog B
(FOSB), jun B proto-oncogene (JUNB), prostaglandin-endoperoxide
synthase 2 (PTGS2), early growth response 1 (EGR1), early growth
response 2 (EGR2) and nuclear receptor subfamily 4, group A, member
2 (NR4A2). Among these, FOS showed the highest node degree, which
was 33 (Table IV).
| Table IV.Top 10 nodes in the protein-protein
interaction network. |
Table IV.
Top 10 nodes in the protein-protein
interaction network.
| Node | Degree | Log2FC | P-value | Node | Degree | Log2FC | P-value |
|---|
| FOS | 33 | 3.855915 | 0.000293 | JUNB | 23 | 1.970841 | 8.05E-05 |
| JUN | 25 | 1.174318 | 0.00015 | PTGS2 | 19 | 1.582406 | 0.000342 |
| ATF3 | 25 | 1.655723 | 1.62E-05 | EGR1 | 18 | 2.609822 | 3.79E-06 |
| IL6 | 24 | 1.942007 | 0.000494 | EGR2 | 18 | 3.149878 | 9.33E-06 |
| FOSB | 23 | 2.974505 | 0.000304 | NR4A2 | 18 | 3.015238 | 3.16E-05 |
miRNA prediction analysis
In total, 36 miRNAs (FDR<0.05) were screened by
GSEA enrichment analysis (Table V).
MIR-224, which was the most significant miRNA with an FDR of
0.013101, regulated 152 target genes and had a GTGACTT target site.
MIR-7 was also screened as a significant miRNA (FDR, 0.13673); it
regulated 163 target genes and had a GTCTTCC target site. Moreover,
CAG GTCC was the target site of MIR-492 (FDR, 0.15391), which
regulated 59 target genes. There were also several miRNAs that
showed combined actions on one target site, such as MIR-34A,
MIR-34C and MIR-449 (FDR, 0.017363), all of which acted on CACTGCC
target sites and regulated a total of 273 target genes.
| Table V.Significantly enriched miRNAs. |
Table V.
Significantly enriched miRNAs.
| Namea | Sizeb | ES | NES | NOM P-value | FDR q-value |
|---|
| GTGACTT,
MIR-224 | 152 | 0.562058 | 1.822214 | 0 | 0.013101 |
| GTCTTCC, MIR-7 | 163 | 0.437548 | 1.825578 | 0 | 0.013673 |
| CAGGTCC,
MIR-492 | 59 | 0.559375 | 1.757292 | 0 | 0.015391 |
| AGCGCTT, MIR-518F,
MIR-518E, MIR-518A | 18 | 0.632514 | 1.786852 | 0.019417 | 0.015701 |
| CTGTTAC,
MIR-194 | 102 | 0.514465 | 1.748545 | 0 | 0.015956 |
| ATTACAT,
MIR-380-3P | 100 | 0.568861 | 1.741315 | 0 | 0.01598 |
| CAGGGTC,
MIR-504 | 83 | 0.447092 | 1.763647 | 0 | 0.016012 |
| CACTGCC, MIR-34A,
MIR-34C, MIR-449 | 273 | 0.327004 | 1.722042 | 0 | 0.017363 |
| GTAAACC,
MIR-299–5P | 51 | 0.518946 | 1.692057 | 0 | 0.018053 |
| ACACTAC,
MIR-142–3P | 127 | 0.5551 | 1.722499 | 0 | 0.018404 |
| TCTATGA, MIR-376A,
MIR-376B | 81 | 0.461825 | 1.694669 | 0.007561 | 0.018496 |
| TTGGGAG,
MIR-150 | 89 | 0.463794 | 1.681071 | 0 | 0.019215 |
| GGCACAT,
MIR-455 | 57 | 0.545086 | 1.868148 | 0 | 0.019345 |
| GCGCCTT, MIR-525,
MIR-524 | 15 | 0.735336 | 1.694803 | 0.020121 | 0.019371 |
| ACTGCCT,
MIR-34B | 212 | 0.400143 | 1.70374 | 0 | 0.019561 |
| GGCACTT,
MIR-519E | 120 | 0.49198 | 1.675179 | 0 | 0.020529 |
| AGGCACT,
MIR-515–3P | 84 | 0.428035 | 1.666043 | 0 | 0.021838 |
| GACTGTT, MIR-212,
MIR-132 | 154 | 0.457287 | 1.655331 | 0 | 0.022945 |
| TATTATA,
MIR-374 | 282 | 0.49871 | 1.650721 | 0 | 0.023073 |
| CACCAGC,
MIR-138 | 217 | 0.31838 | 1.645393 | 0 | 0.024967 |
| CTACCTC, LET-7A,
LET-7B, LET-7C, LET-7D, LET-7E, LET-7F, MIR-98, LET-7G, LET-7I | 375 | 0.358576 | 1.62671 | 0 | 0.03133 |
| GAGCCAG,
MIR-149 | 143 | 0.30404 | 1.62081 | 0 | 0.031399 |
| CCACACA,
MIR-147 | 59 | 0.485473 | 1.621963 | 0 | 0.032141 |
| ACTTTAT,
MIR-142–5P | 283 | 0.475001 | 1.606214 | 0 | 0.034741 |
| AAAGGAT,
MIR-501 | 125 | 0.459692 | 1.600922 | 0 | 0.035487 |
| AGCACTT, MIR-93,
MIR-302A, MIR-302B, MIR-302C, MIR-302D, MIR-372, MIR-373, MIR-520E,
MIR-520A, MIR-526B, MIR-520B, MIR-520C, MIR-520D | 330 | 0.465894 | 1.606906 | 0.005814 | 0.035811 |
| CACTTTG, MIR-520G,
MIR-520H | 230 | 0.487052 | 1.602 | 0.003876 | 0.036012 |
| CAATGCA,
MIR-33 | 91 | 0.479179 | 1.607379 | 0 | 0.036792 |
| GTGCAAT, MIR-25,
MIR-32, MIR-92, MIR-363, MIR-367 | 304 | 0.440998 | 1.581268 | 0 | 0.042634 |
| ATGTTTC,
MIR-494 | 155 | 0.455721 | 1.578166 | 0.015717 | 0.043117 |
| GCAAAAA,
MIR-129 | 182 | 0.431128 | 1.577369 | 0.031558 | 0.043279 |
| GACAATC,
MIR-219 | 138 | 0.403393 | 1.574232 | 0 | 0.0444 |
| CTAGGAA,
MIR-384 | 64 | 0.439962 | 1.566436 | 0 | 0.044528 |
| CACTGTG, MIR-128A,
MIR-128B | 327 | 0.344783 | 1.567878 | 0.005941 | 0.045063 |
| TATCTGG,
MIR-488 | 60 | 0.520626 | 1.568708 | 0 | 0.045787 |
| GGGCATT,
MIR-365 | 107 | 0.509769 | 1.558457 | 0.003883 | 0.04858 |
miRNA regulatory network
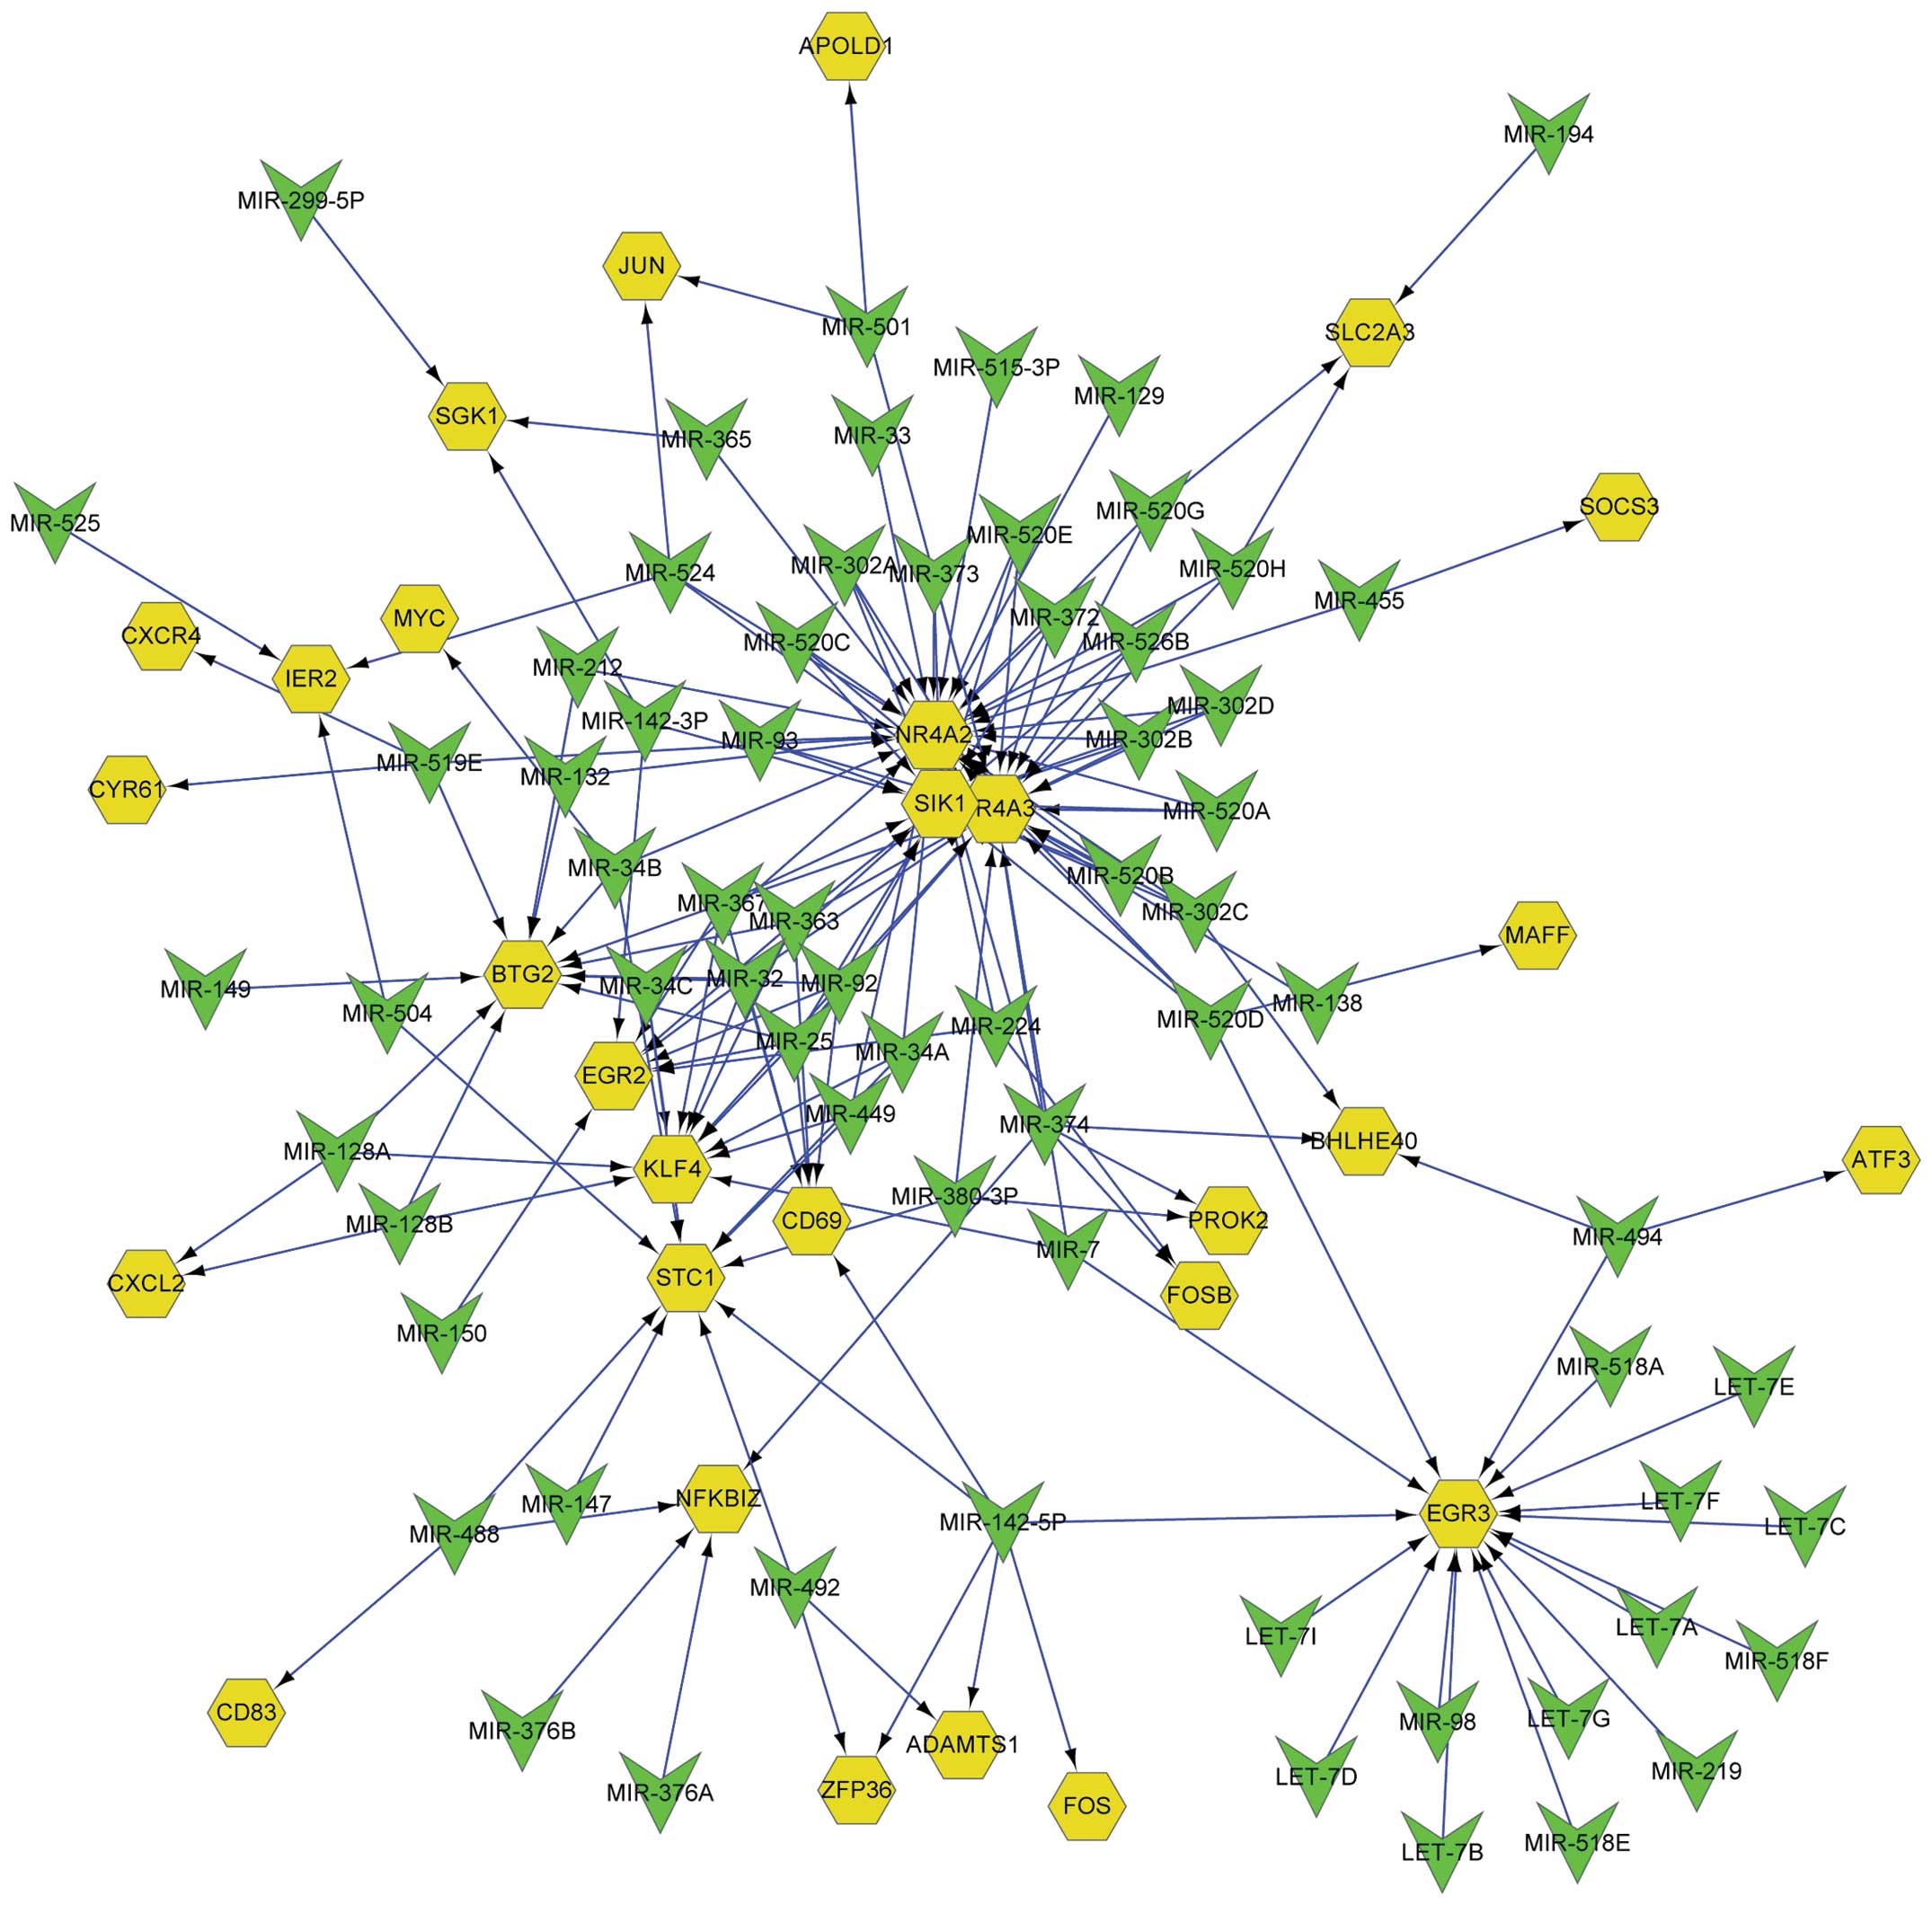
An miRNA regulatory network was constructed from the
screened miRNAs and the DEGs that they regulated. There were 176
edges and 97 nodes in the network, and the nodes consisted of 29
DEGs and 68 miRNAs (Fig. 4). All of
the DEGs were regulated by one or several miRNAs. For instance,
EGR2 was regulated by 8 miRNAs, namely MIR-150, MIR-142-3P,
MIR-367, MIR-363, MIR-32, MIR-92, MIR-25 and MIR-224, whereas ATF3
was only regulated by MIR-494. Similarly, each miRNA regulated one
or more DEGs. MIR-142-5P regulated 6 DEGs simultaneously, namely
CD69 molecule (CD69), ZFP36 ring finger protein (ZFP36), ADAM
metallopeptidase with thrombospondin type 1 motif 1 (ADAMTS1), FOS,
stanniocalcin 1 and early growth response 3 (EGR3), whereas MIR-194
only had a regulatory effect on solute carrier family 2
(facilitated glucose transporter), member 3 (SLC2A3).
Discussion
OPCAB is a type of surgery that improves blood flow
to heart. In this study, GSE12486 was downloaded from the GEO to
investigate the effect of this surgery on myocardial tissue on the
basis of molecular mechanisms. A total of 64 DEGs, including 63
upregulated and 1 downregulated DEGs were screened. PLIN1 was the
unique downregulated DEG in this study, which has been confirmed to
be associated with anterolateral myocardial infarction through
various metabolic pathways and axon guidance (23,24).
In addition, the present study also identified that
the DEGs were mainly enriched in GO terms associated with chemokine
activity, transcription factor activity and transcription regulator
activity, and several KEGG pathways, such as chemokine signaling
pathway, cytokine-cytokine receptor interaction, and Toll-like
receptor signaling pathway. The FOS gene was enriched in various GO
terms such as inflammatory response, defense response and
transcription regulator activity. Wu et al have shown that
FOS is an important target of immune inflammation responses in
dendritic cells (25). The OPCAB
surgery has been confirmed to activate an inflammatory response,
specific hemostatic responses and immune mechanisms (26). Thus, the FOS gene may be involved in
the changes that occur following OPCAB grafting via an immune
mechanism. In addition, FOS, IL6 and JUN were the enriched genes in
the Toll-like receptor and MAPK signaling pathways. The MAPK
signaling pathway can be regulated by the activation of
extracellular signal-regulated kinase (ERK)1 and 2, which can
translocate to the nucleus and activate transcription factors, such
as c-FOS (27). Inhibition of the
activation of MAPK may attenuate warm ischemia-reperfusion injury
(28), and MAPK inhibition is widely
used to improve cardiac function after rewarming, cold storage and
reperfusion (29). IL6 is an
independent predictor for left ventricular systolic function in
patients following OPCAB surgery (30). Furthermore, the ratio IL10/IL6 can be
used as an inflammatory biomarker in OPCAB patients (31). In the present study, IL6 and IL8 were
enriched in inflammation-related terms, such as chemotaxis,
inflammatory response, defense response and response to
wounding.
Moreover, a PPI network was constructed, and 10 hub
nodes including FOS, JUN, ATF3, IL6, FOSB and JUNB were screened.
Among them, FOS and JUN were the most important nodes with degrees
of 33 and 25, respectively. A previous study has shown a direct
association of signal transducer and activator of transcription 3
with c-FOS and c-JUN in response to IL6 (32). The Fos family, including c-FOS, FOSB
and FOSB2, are able to form dimers with JUN proteins to regulate
target genes (29). Furthermore,
ATF3 has been confirmed to inhibit IL6 transcription by altering
the structure of chromatin, and then restrict access to
transcription factors (33). In the
present study, FOS, JUN, IL6 and ATF3 were also screened and
enriched in transcription factor activity. A correlation between
FOS and EGR2 was also shown. EGR2, which is a human zinc
finger-encoding gene, is induced with c-Fos-like kinetics by
various mitogens in cells (34).
A total of 36 miRNAs were screened including
MIR-494, MIR-501, MIR-524 and MIR-142-3P. Furthermore, an miRNA
regulatory network was constructed based on the DEGs and screened
miRNAs. It was found that ATF3 was only regulated by MIR-494.
Similarly, Lan et al found that following reperfusion, the
expression of ATF3 was inhibited by upregulated miRNA-494, and also
associated with inflammation and adhesion (35). In addition, there was mutual
regulated relationship between EGR2 and MIR-142-3P: ERG2 was
encoded by the genes repressed by MIR-142-3P, while ERG2 associated
with nerve growth factor-induced gene-A (NGFI-A) binding protein 2
binds to the pre-MIR-142-3p promoter to regulate its expression
negatively (36).
In conclusion, the identified DEGs, such as FOS,
IL6, EGR2 and JUN, might participate in biological processes
including immune inflammation responses, the Toll-like receptor
signaling pathway and the defense response of patients following
OPCAB surgery. Moreover, the associations between DEGs and miRNA
were screened. ATF3 was regulated by MIR-494, and JUN was regulated
by MIR-501 and MIR494. However, these results require confirmation
by experimental study.
Acknowledgements
The authors express warm thanks to Fenghe (Shanghai)
Information Technology Co., Ltd., whose ideas and help provided a
valuable added dimension to the study.
References
|
1
|
Worthley SG, Osende JI, Helft G, Badimon
JJ and Fuster V: Coronary artery disease: Pathogenesis and acute
coronary syndromes. Mt Sinai J Med. 68:167–181. 2001.PubMed/NCBI
|
|
2
|
Nalysnyk L, Fahrbach K, Reynolds MW, Zhao
SZ and Ross S: Adverse events in coronary artery bypass graft
(CABG) trials: A systematic review and analysis. Heart. 89:767–772.
2003. View Article : Google Scholar : PubMed/NCBI
|
|
3
|
Kim NY, Shim JK, Bang SO, Sim JS, Song JW
and Kwak YL: Effects of ulinastatin on coagulation in high-risk
patients undergoing off-pump coronary artery bypass graft surgery.
Korean J Anesthesiol. 64:105–111. 2013. View Article : Google Scholar : PubMed/NCBI
|
|
4
|
Arab S, Konstantinov IE, Boscarino C,
Cukerman E, Mori A, Li J, Liu PP, Redington AN and Coles JG: Early
gene expression profiles during intraoperative myocardial
ischemia-reperfusion in cardiac surgery. J Thorac Cardiovasc Surg.
134:74–81.e2. 2007. View Article : Google Scholar : PubMed/NCBI
|
|
5
|
Gabrielsen A, Lawler PR, Yongzhong W,
Steinbrüchel D, Blagoja D, Paulsson-Berne G, Kastrup J and Hansson
GK: Gene expression signals involved in ischemic injury,
extracellular matrix composition and fibrosis defined by global
mRNA profiling of the human left ventricular myocardium. J Mol Cell
Cardiol. 42:870–883. 2007. View Article : Google Scholar : PubMed/NCBI
|
|
6
|
Konstantinov IE, Coles JG, Boscarino C,
Takahashi M, Goncalves J, Ritter J and Van Arsdell GS: Gene
expression profiles in children undergoing cardiac surgery for
right heart obstructive lesions. J Thorac Cardiovasc Surg.
127:746–754. 2004. View Article : Google Scholar : PubMed/NCBI
|
|
7
|
Chandrasekar B, Mitchell DH, Colston JT
and Freeman GL: Regulation of CCAAT/Enhancer binding protein,
interleukin-6, interleukin-6 receptor, and gp130 expression during
myocardial ischemia/reperfusion. Circulation. 99:427–433. 1999.
View Article : Google Scholar : PubMed/NCBI
|
|
8
|
Tomic V, Russwurm S, Möller E, Claus RA,
Blaess M, Brunkhorst F, Bruegel M, Bode K, Bloos F, Wippermann J,
et al: Transcriptomic and proteomic patterns of systemic
inflammation in on-pump and off-pump coronary artery bypass
grafting. Circulation. 112:2912–2920. 2005.PubMed/NCBI
|
|
9
|
Ghorbel MT, Cherif M, Mokhtari A, Bruno
VD, Caputo M and Angelini GD: Off-pump coronary artery bypass
surgery is associated with fewer gene expression changes in the
human myocardium in comparison with on-pump surgery. Physiol
Genomics. 42:67–75. 2010. View Article : Google Scholar : PubMed/NCBI
|
|
10
|
Lan YF, Chen HH, Lai PF, Cheng CF, Huang
YT, Lee YC, Chen TW and Lin H: MicroRNA-494 reduces ATF3 expression
and promotes AKI. J Am Soc Nephrol. 23:2012–2023. 2012. View Article : Google Scholar : PubMed/NCBI
|
|
11
|
Wang X, Zhang X, Ren XP, Chen J, Liu H,
Yang J, Medvedovic M, Hu Z and Fan GC: MicroRNA-494 targeting both
proapoptotic and antiapoptotic proteins protects against
ischemia/reperfusion-induced cardiac injury. Circulation.
122:1308–1318. 2010. View Article : Google Scholar : PubMed/NCBI
|
|
12
|
Wang Z, Shao J, Zhou Q, Liu J, Zhu Y, Yang
J and Wei M: The −251A>T polymorphism of interleukin-8 is
associated with longer mechanical ventilation and hospital staying
after coronary surgery. Cytokine. 50:268–272. 2010. View Article : Google Scholar : PubMed/NCBI
|
|
13
|
Nathan N, Preux PM, Feiss P and Denizot Y:
Plasma interleukin-4, interleukin-10, and interleukin-13
concentrations and complications after coronary artery bypass graft
surgery. J Cardiothorac Vasc Anesth. 14:156–160. 2000. View Article : Google Scholar : PubMed/NCBI
|
|
14
|
Fromes Y, Daghildjian K, Caumartin L,
Fischer M, Rouquette I, Deleuze P and Bical OM: A comparison of low
vs conventional-dose heparin for minimal cardiopulmonary bypass in
coronary artery bypass grafting surgery. Anaesthesia. 66:488–492.
2011. View Article : Google Scholar : PubMed/NCBI
|
|
15
|
Gautier L, Cope L, Bolstad BM and Irizarry
RA: Affy-analysis of Affymetrix GeneChip data at the probe level.
Bioinformatics. 20:307–315. 2004. View Article : Google Scholar : PubMed/NCBI
|
|
16
|
Diboun I, Wernisch L, Orengo CA and
Koltzenburg M: Microarray analysis after RNA amplification can
detect pronounced differences in gene expression using limma. BMC
Genomics. 7:2522006. View Article : Google Scholar : PubMed/NCBI
|
|
17
|
Sartor MA, Tomlinson CR, Wesselkamper SC,
Sivaganesan S, Leikauf GD and Medvedovic M: Intensity-based
hierarchical Bayes method improves testing for differentially
expressed genes in microarray experiments. BMC Bioinformatics.
7:5382006. View Article : Google Scholar : PubMed/NCBI
|
|
18
|
Jolliffe I: Principal component analysis.
Encyclopedia of Statistics in Behavioral Science. Everitt BS and
Howell D: (New York, NY). John Wiley & Sons. 2005. View Article : Google Scholar
|
|
19
|
da Huang W, Sherman BT and Lempicki RA:
Systematic and integrative analysis of large gene lists using DAVID
bioinformatics resources. Nat Protoc. 4:44–57. 2009. View Article : Google Scholar : PubMed/NCBI
|
|
20
|
Franceschini A, Szklarczyk D, Frankild S,
Kuhn M, Simonovic M, Roth A, Lin J, Minguez P, Bork P, von Mering C
and Jensen LJ: STRING v9.1: Protein-protein interaction networks,
with increased coverage and integration. Nucleic Acids Res.
41:D808–D815. 2013. View Article : Google Scholar : PubMed/NCBI
|
|
21
|
Subramanian A, Tamayo P, Mootha VK,
Mukherjee S, Ebert BL, Gillette MA, Paulovich A, Pomeroy SL, Golub
TR, Lander ES and Mesirov JP: Gene set enrichment analysis: A
knowledge-based approach for interpreting genome-wide expression
profiles. Proc Natl Acad Sci USA. 102:15545–15550. 2005. View Article : Google Scholar : PubMed/NCBI
|
|
22
|
Shannon P, Markiel A, Ozier O, Baliga NS,
Wang JT, Ramage D, Amin N, Schwikowski B and Ideker T: Cytoscape: A
software environment for integrated models of biomolecular
interaction networks. Genome Res. 13:2498–2504. 2003. View Article : Google Scholar : PubMed/NCBI
|
|
23
|
Jaffer I, Riederer M, Shah P, Peters P,
Quehenberger F, Wood A, Scharnagl H, März W, Kostner KM and Kostner
GM: Expression of fat mobilizing genes in human epicardial adipose
tissue. Atherosclerosis. 220:122–127. 2012. View Article : Google Scholar : PubMed/NCBI
|
|
24
|
Lei P, Baysa A, Nebb HI, Valen G, Skomedal
T, Osnes JB, Yang Z and Haugen F: Activation of Liver X receptors
in the heart leads to accumulation of intracellular lipids and
attenuation of ischemia-reperfusion injury. Basic Res Cardiol.
108:3232013. View Article : Google Scholar : PubMed/NCBI
|
|
25
|
Wu C, Gong Y, Yuan J, Zhang W, Zhao G, Li
H, Sun A, Hu Kai Zou Y and Ge J: microRNA-181a represses
ox-LDL-stimulated inflammatory response in dendritic cell by
targeting c-Fos. J Lipid Res. 53:2355–2363. 2012. View Article : Google Scholar : PubMed/NCBI
|
|
26
|
Levy JH and Tanaka KA: Inflammatory
response to cardiopulmonary bypass. Ann Thorac Surg. 75(Suppl):
S715–S720. 2003. View Article : Google Scholar : PubMed/NCBI
|
|
27
|
Junttila MR, Li SP and Westermarck J:
Phosphatase-mediated crosstalk between MAPK signaling pathways in
the regulation of cell survival. FASEB J. 22:954–965. 2008.
View Article : Google Scholar : PubMed/NCBI
|
|
28
|
Kobayashi M, Takeyoshi I, Yoshinari D,
Matsumoto K and Morishita Y: P38 mitogen-activated protein kinase
inhibition attenuates ischemia-reperfusion injury of the rat liver.
Surgery. 131:344–349. 2002. View Article : Google Scholar : PubMed/NCBI
|
|
29
|
Vassalli G, Milano G and Moccetti T: Role
of mitogen-activated protein kinases in myocardial
ischemia-reperfusion injury during heart transplantation. J
Transplant. 2012:9289542012. View Article : Google Scholar : PubMed/NCBI
|
|
30
|
Mathew GM, Mathew DC, Lo SC, Alexios GM,
Yang JC, Sashikumar JM, Shaikh TM and Huang CC: Synergistic
collaboration of gut symbionts in Odontotermes formosanus
for lignocellulosic degradation and bio-hydrogen production.
Bioresour Technol. 145:337–344. 2013. View Article : Google Scholar : PubMed/NCBI
|
|
31
|
Mazandarani M, Mojtahedzadeh M,
Yousefshahi F and Hamishehkar H: Effect of pre-treatment with
hypertonic saline on IL-10/IL-6 ratio in CABG patient. Res Pharm
Sci. 7:S8862012.
|
|
32
|
Schuringa JJ, Timmer H, Luttickhuizen D,
Vellenga E and Kruijer W: c-Jun and c-Fos cooperate with STAT3 in
IL-6-induced transactivation of the IL-6 response element (IRE).
Cytokine. 14:78–87. 2001. View Article : Google Scholar : PubMed/NCBI
|
|
33
|
Gilchrist M, Thorsson V, Li B, Rust AG,
Korb M, Roach JC, Kennedy K, Hai T, Bolouri H and Aderem A: Systems
biology approaches identify ATF3 as a negative regulator of
Toll-like receptor 4. Nature. 441:173–178. 2006. View Article : Google Scholar : PubMed/NCBI
|
|
34
|
Rangnekar VM, Aplin AC and Sukhatme VP:
The serum and TPA responsive promoter and intron-exon structure of
EGR2, a human early growth response gene encoding a zinc finger
protein. Nucleic Acids Res. 18:2749–2757. 1990. View Article : Google Scholar : PubMed/NCBI
|
|
35
|
Lan HY and Chung AC: TGF-β/Smad signaling
in kidney disease. Semin Nephrol. 32:236–243. 2012. View Article : Google Scholar : PubMed/NCBI
|
|
36
|
Lagrange B, Martin RZ, Droin N, Aucagne R,
Paggetti J, Largeot A, Itzykson R, Solary E, Delva L and Bastie JN:
A role for miR-142-3p in colony-stimulating factor 1-induced
monocyte differentiation into macrophages. Biochim Biophys Acta.
1833:1936–1946. 2013. View Article : Google Scholar : PubMed/NCBI
|