Introduction
Obesity-related resistance to the stimulatory
effects of insulin on glucose utilization (insulin resistance) is
central to the pathogenesis of type 2 diabetes mellitus and is an
important contributor to the development of diabetes. Insulin
resistance precedes the clinical development of type 2 diabetes
(1). However, the mechanisms
underlying the pathogenesis of insulin resistance of type 2
diabetes remain poorly understood at present. Obesity is widely
recognized as a cause of type 2 diabetes and predisposes an
individual to insulin resistance and type 2 diabetes. Obesity,
which develops due to an imbalance between nutritional intake and
energy expenditure, is characterized by an overabundance of
nutrients leading to hypertrophy of storage cells in white adipose
tissue and the deposition of excess lipids in key metabolic areas,
for example skeletal muscle and liver, and in the circulation
(2). Thus, the potential mechanism
linking obesity with type 2 diabetes is ectopic lipid accumulation
caused by abnormal lipid metabolism leading to ‘lipotoxicity’ in
insulin-sensitive tissues, and ultimately resulting in fat-induced
insulin resistance (3). Skeletal
muscle is a peripheral insulin-sensitive tissue that accounts for
~40% of total body weight and is a primary site of energy balance
that accounts for >30% of energy expenditure. Moreover, it is
the primary tissue in which glucose uptake, disposal, storage and
utilization occurs, and has a key role in insulin sensitivity, the
blood lipid profile and lipid homeostasis, including fatty acid
oxidation and cholesterol efflux. Therefore, skeletal muscle is
important in both insulin-mediated glucose metabolism and in lipid
metabolism (4). Skeletal muscle
insulin resistance, associated with caloric excess, obesity and
physical inactivity, mainly results from dyslipidemia and impaired
fatty acid metabolism, specifically the intramuscular accumulation
of fatty acid metabolites, which disrupt insulin signaling pathways
via defective glucose uptake/phosphorylation to affect insulin
action (5). Thus, obesity-related
skeletal muscle insulin resistance is a hallmark of type 2 diabetes
and a primary risk factor for promoting the development of type 2
diabetes. Furthermore, the molecular mechanisms involved in
skeletal muscle insulin resistance, particularly fat-induced
skeletal muscle insulin resistance (FISMIR) underlie the
pathogenesis of obesity-related type 2 diabetes.
In the present study, hamsters with a genetic
susceptibility for diabetes and exhibiting many features in common
with lipid metabolism in humans were selected for the development
of obese type 2 diabetes and obesity animal models as described by
Li et al (6). In these
models, feeding with a high-fat diet (HFD) feeding induces obesity
(particularly visceral obesity), insulin resistance,
hyperinsulinemia, ‘deleterious’ serum lipid level, and further
augmentation of hyperglycemia following streptozotocin injection.
Low-dose streptozotocin injection leads to hyperglycemia and a
relative reduction of serum insulin levels. The pathophysiological
and metabolic features of obesity-related insulin resistance and
type 2 diabetes in these hamster models closely resemble those in
human patients. An ideal and well-characterized animal model was
thus used to study the mechanisms associated with the pathogenesis
and therapy of type 2 diabetes. Microarray technology is an
effective technique to explore the changes in complex gene
expression profiles in diseases with a complex nature. Therefore,
in the present study, changes in gene expression in skeletal muscle
and the molecular mechanisms involved in the development of FISMIR
in insulin-resistant and type 2 diabetic hamsters were explored
using microarray technology. Characterizing the gene expression
alterations and molecular mechanisms involved in FISMIR in obese
insulin-resistant and type 2 diabetic states may offer new
strategies and pharmacological targets for the prevention and
treatment of peripheral insulin resistance associated with
obesity-related type 2 diabetes.
Materials and methods
Animal model
A total of 35 five-month-old Golden Syrian hamsters,
including 18 females and 17 males, weighing 125.1±10.5 g, were
purchased from the Sichuan Academy of Medical Sciences (Chengdu,
China). All hamsters were maintained individually for 2 weeks under
specific pathogen-free conditions at 18–25°C and 40–70% humidity,
and under a 12-h light/dark cycle with ad libitum access to
standard laboratory chow and water. The hamster models of insulin
resistance and diabetes were induced and grouped according to a
previous study (6). Briefly, 25
hamsters, including 13 females and 12 males, were fed a high-fat
diet consisting of 20% lard, 10% egg yolk powder, 1% cholesterol
and 0.1% cholic acid [Institute of Laboratory Animal Science,
Chinese Academy of Medical Sciences (CAMS) and Peking Union Medical
College (PUMC), Beijing, China] for 4 weeks to induce insulin
resistance. The remaining hamsters were fed standard laboratory
chow for 4 weeks. Subsequently, the insulin-resistant hamsters were
randomly divided into two groups, as follows: Group 1 (n=15; 8
females and 7 males), in which the hamsters were twice injected
intraperitoneally with 40 mg/kg streptozotocin (Sigma-Aldrich, St.
Louis, MO, USA) dissolved in vehicle (0.05 mol/l citric acid, pH
4.5) to induce type 2 diabetes; and group 2 (n=10; 5 females and 5
males), in which the hamsters were injected intraperitoneally with
4 ml/kg citric acid. Following treatment, the hamsters were
maintained on the same diet for 2 weeks. The successful
establishment of diabetic and insulin-resistant animals was
assessed by the measurement of fasting blood glucose levels
(diabetic animals ≥ 9 mmol/l; OneTouch® UltraTM Blood
Glucose Monitoring System; LifeScan International Inc., Milpitas,
CA, USA) and oral glucose tolerance tests.
Following the induction of the two models, the
hamsters were randomly selected and divided into three groups,
including the control, insulin-resistant and type 2 diabetes groups
(n=10/group). After 6 weeks, the hamsters in the three groups were
sacrificed after a 12 h fasting period by cervical dislocation
following ether (Beijing Chemical works, Beijing, China)
inhalation. Blood samples were obtained by retro-orbital sinus
puncture under anesthesia with ether. The serum was separated by
centrifugation at 3,000 × g for 20 min at 4°C and stored at −80°C
until used for determining metabolic and biochemical parameters.
Skeletal muscle (soleus) was rapidly removed, weighed, frozen in
liquid nitrogen and stored at −80°C until analysis. All procedures
involving animal handling and tissue harvesting were reviewed and
approved by the Institute of Laboratory Animal Science, CAMS and
PUMC Laboratory Animal Care and Use Committee and Institutional
Animal Welfare Committee (Beijing, China).
Oral glucose tolerance tests
(OGTTs)
The hamsters were subjected to OGTTs following an
overnight fast. Oral glucose load was administered at 2 g/kg. Blood
samples were obtained under anesthesia with ether from the
retro-orbital sinus at 0, 30, 60, 120 and 180 min after glucose
challenge and blood glucose and insulin levels were measured.
Blood chemistry testing
Serum concentrations of free fatty acids (FFAs),
total cholesterol (TC), low density lipoprotein (LDL)-c, high
density lipoprotein (HDL)-c and triglycerides (TGs) were analyzed
using commercial kits (Randox Laboratories Ltd., Crumlin, UK) in
accordance with the manufacturer's protocol, and a Hitachi 8060
automatic biochemical analyzer (Hitachi Co., Ltd, Tokyo, Japan). TC
and TG levels were determined by CHOD-PAP and GPO-PAP colorimetric
end-point assays, respectively, using Randox Total Cholesterol
(cat. no., CH200) and Triglycerides (cat. no., TR1697) kits. FFAs
were measured by the non-esterified fatty acids (NEFA) colorimetric
method using a Randox NEFA kit (cat. no., FA115). HDL-c and LDL-c
were quantified by a direct clearance method using Randox Direct
HDL-c (cat. no., CH2652) and Direct LDL-c kits (cat. no., CH2656).
Blood glucose was measured with a OneTouch®
Ultra™ Blood Glucose Monitoring System. Serum insulin
and adiponectin levels were determined using a rat/mouse insulin
kit (Linco; EMD Millipore, Billerica, MA, USA) and adiponectin
enzyme-linked immunosorbent assay kit (cat. no. MRP300; R&D
Systems, Inc., Minneapolis, MN, USA) in accordance with the
manufacturer's protocol.
Analysis of skeletal muscle lipid
content
Skeletal muscle lipid accumulation was demonstrated
by the analysis of skeletal muscle lipid content. Lipid content was
measured essentially as described by Brown et al (7). Briefly, 100 mg frozen skeletal muscle
tissues from the different groups were minced and homogenized in 2
ml sucrose buffer (0.3 mol/l sucrose, 25 nmol/l 2-mercaptoethanol,
and 10 mmol/l EDTA, pH 7.0) and then mixed with
chloroform/methanol, 2:1, vol/vol. The total lipid material was
then extracted as follows: The organic phase was separated, dried,
and the lipids resuspended in 100 µl ethanol. TG and TC were
measured, using the kits detailed above, according to the
manufacturer's protocol.
Microarray analysis
Frozen skeletal muscle tissues from hamsters in each
group were collected and total RNA was extracted using an RNeasy
Mini kit (Qiagen GmbH, Hilden, Germany). After purification, the
quantity and quality of total RNA were determined by
spectrophotometry (SmartSpec™ Plus; Bio-Rad Laboratories, Inc.,
Hercules, CA, USA, Beijing, China). The quality of the RNA was
determined by formaldehyde-agarose gel electrophoresis. Then, 5 µg
total RNA was reversely transcribed into cDNA using a cDNA
Synthesis kit (Promega Corporation, Madison, WI, USA). After
purification using NucleoSpin® RNA clean-up
(Macherey-Nagel GmbH & Co. KG, Düren, Germany), cRNA was
synthesized from the cDNA using T7 RiboMAX Express Large Scale RNA
Production System (Promega Corporation). A 2 µg quantity of cRNA
reverse-transcribed product was labeled with either 40 µmol/l
dCTP-Cy5 or 40 µmol/l dCTP-Cy3 (Amersham Pharmacia Biotech, Inc.,
Piscataway, NJ, USA) and Klenow fragment (polymerase; Takara
Biotechnology Co., Ltd., Dalian, China), 9 Random Primer, 60 µmol/l
dCTP, and 120 µmol/l dATP, dGTP, dTTP in a 200-µl final volume. The
labeled cDNA was purified using a NucleoSpin Extract II kit
(Macherey-Nagel GmbH & Co. KG) and dried.
A 36k Mouse Genome Oligo Array (Operon Mouse Genome,
version 4.0; http://www.operon.com) representing
approximately 25,000 genes was printed in arrays on 75×25 mm slides
with the use of SmartArray™ (CapitalBio Corporation, Beijing,
China). The manufacturer of the oligo array states that the high
conservation of genome sequences and high likelihood of
crossreactivity of genomic hybridization between mice and the
hamsters make the use of a mouse microarray to hybridize with the
hamster cDNA possible. The labeled cDNA (0.9 µg) was added to 30 µg
hybridization solution containing 3X sodium chloride sodium citrate
(SSC), 5X Denhart's solution, 25% formamide and 0.2% sodium dodecyl
sulfate (SDS). The labeled cDNA in the hybridization solution was
added to the microarray slide, and then hybridized to the
microarray at 42°C for 12 h. Following hybridization, the slides
were washed at 42°C for 5 min in solution containing 2X SSC and
0.2% SDS, and then transferred to 0.2X SSC at room temperature for
5 min. Slides were then dried by centrifugation. The skeletal
muscle (soleus) tissues from three hamsters of each group were
randomly selected for microarray analysis. All experiments were
performed in duplicate. Fluorescence intensities of microarray
spots were measured using a laser double-channel LuxScan 10KA
scanner (CapitalBio Corporation). Image analysis was performed
using GenePix Pro 4.0 software (Axon Instruments, Inc.; Molecular
Devices LLC, Sunny Vale, CA, USA). Then, Lowess normalization was
applied to the primary data. After normalization, ratio values were
calculated, and the differentially expressed genes (those with
>1.5- or <1.5-fold differences in expression between groups)
were identified. Gene Ontology analyses were then performed using
the Database for Annotation, Visualization and Integrated Discovery
(v6.7) and EASE 2.0 (National Institute of Allergy and Infectious
Diseases, Bethesda, MD, USA) in order to classify the
differentially expressed genes according to function.
Reverse transcription-quantitative
polymerase chain reaction (RT-qPCR)
For verification of the microarray analysis results,
RT-qPCR analysis of selected genes was performed. Total RNA was
extracted from frozen skeletal muscle tissues of hamsters from the
different groups using an RNeasy Mini kit. The quantity and quality
of total RNA were determined by spectrophotometry, and the
integrity was assessed by 1% agarose gel electrophoresis. cDNA was
synthesized from 1 µg total RNA using an iScript cDNA Synthesis kit
(Bio-Rad Laboratories, Inc.) in accordance with the manufacturer's
protocol. Specific primers pairs for each gene were designed using
Primer Express software v2.0 (Applied Biosystems; Thermo Fisher
Scientific, Waltham, MA, USA) or obtained from previously published
papers. Then, the reverse-transcribed products of 50 ng total RNA
were amplified with iQ Syber Green Supermix (Bio-Rad Laboratories,
Inc.) according to the manufacturer's protocol using an iCycler iQ
Real Time PCR Detection System (Bio-Rad Laboratories, Inc.). The
amplification conditions were as follows: 95°C for 3 min, followed
by 45 cycles of 95°C for 10 sec and 57°C for 45 sec. When the
amplification process was completed, the reaction mixture was
further subjected to 80 cycles of 0.5°C increments (10 sec each)
beginning at 57°C for melting curve analysis to check the identity
and purity of the amplified products. Each reaction was performed
in triplicate. To ensure specific amplification, negative controls
were included in the PCR reaction. qPCR efficiency measured prior
to amplification was close to 1. Thus the relative quantification
for a target gene in a given sample was calculated according to the
2−∆∆Cq method (8).
β-actin was used as the reference gene. The nucleotide sequences of
the forward and reverse primers are presented in Table I.
 | Table I.Primers used for reverse
transcription-quantitative polymerase chain reaction. |
Table I.
Primers used for reverse
transcription-quantitative polymerase chain reaction.
| Gene | Genbank accession
no. | Forward/reverse
primers |
|---|
| Srebf1a | NM_011480 |
5′-ATGGACGAGCTGGCCTTCGGTGAGGCGGC-3′ |
|
|
|
5′-CAGGAAGGCTTCCAGAGAGGA-3′ |
| Srepf1c | NM_011480 |
5′-GCTGTTGGCATCCTGCTATC-3′ |
|
|
|
5′-TAGCTGGAAGTGACGGTGGT-3′ |
| Srebf2 | U12330 |
5′-AGCTGGCAAATCAGAAAAACAAG-3′ |
|
|
|
5′-GATTAAAGTCTTCAATCTTCAAGTCCAC-3′ |
| Nr1h3 | AJ132601 |
5′-TCAGCATCTTCTCTGCAGACCGG-3′ |
|
|
|
5′-TCATTAGCATCCGTGGGAACA-3′ |
| Nr1h2 | NM_009473 |
5′-AAGCAGGTGCCAGGGTTCT-3′ |
|
|
|
5′-TGCATTCTGTCTCGTGGTTGT-3′ |
| Ppara | NM_011144 |
5′-TGAGGAAGCCGTTCTGTGAC-3′ |
|
|
|
5′-GGTGTCATCTGGATGGTTGC-3′ |
| Ppard | NM_011145 |
5′-GCCTCGGGCTTCCACTAC-3′ |
|
|
|
5′-AGATCCGATCGCACTTCTCA-3′ |
| Pparg | NM_011146 |
5′-CCCCTGCTCCAGGAGATCTAC-3′ |
|
|
|
5′-GCAATCAATAGAAGGAACACGTTGT-3′ |
| Hmgcr | X00494 |
5′-AGATACTGGAGAGTGCCGAGAAA-3′ |
|
|
|
5′-TTTGTAGGCTGGGATGTGCTT-3′ |
| Hmgcs | L00326 |
5′-CCTGGGTCACTTCCTTTGAATG-3′ |
|
|
|
5′-GATCTCAAGGGCAACGATTCC-3′ |
| Ldlr | NM_010700 |
5′-CCAACCTGAAGAATGTGGTG-3′ |
|
|
|
5′-CAGGTCCTCACTGATGATGG-3′ |
| Fasn | NM_007988 |
5′-CACAGATGATGACAGGAGATGG-3′ |
|
|
|
5′-TCGGAGTGAGGCTGGGTTGAT-3′ |
| Scd1 | NM_009127 |
5′-TGGGTTGGCTGCTTGTG-3′ |
|
|
|
5′-GCGTGGGCAGGATGAAG-3′ |
| Acc | AF356089 |
5′-ACACTGGCTGGCTGGACAG-3′ |
|
|
|
5′-CACACAACTCCCAACATGGTG-3′ |
| Cd36 | NM_007643 |
5′-GCCAAGCTATTGCGACATGA-3′ |
|
|
|
5′-GATAGACCTGCAAATGTCAGAGGAA-3′ |
| Socs3 | NM_007707 |
5′-CACCTGGACTCCTATGAGAAAGTG-3′ |
|
|
|
5′-GAGCATCATACTGATCCAGGAACT-3′ |
| Ptpn1 | NM_011201 |
5′-GGCGTGGTCATGCTCAAC-3′ |
|
|
|
5′-GCCAATACTGGGCACATTTTAA-3′ |
| Hk2 | NM_013820 |
5′-GCACTGGAGAAGAGCTTTTCGA-3′ |
|
|
|
5′-AGGGACACGCCCTTCATG-3′ |
| Acox | NM_053115 |
5′-CCAGGACAGAGGTTCTTGGT-3′ |
|
|
|
5′-TCTCAGGAAGGACTTGGCTT-3′ |
| Cpt1 | NM_013495 |
5′-CTCAGTGGGAGCGACTCTTCA-3′ |
|
|
|
5′-GGCCTCTGTGGTACACGACAA-3′ |
| Acadm | NM_007382 |
5′-TGACGGAGCAGCCAATGA-3′ |
|
|
|
5′-ATGGCCGCCACATCAGA-3′ |
| Adipor1 | NM_028320 |
5′-AACGGGCCATCCATTTTTG-3′ |
|
|
|
5′-TTAGCCGGGCTACATCAAGG-3′ |
| Pdk4 | NM_013743 |
5′-CTGGTATATCCAGAGCCTGA-3′ |
|
|
|
5′-GACCAGCGTGTCTACAAACT-3′ |
| Ucp3 | NM_009464 |
5′-CATCACAAGAAATGCCATTGTCA-3′ |
|
|
|
5′-TCCAGCAACTTCTCCTTGATGA-3′ |
| GSlc2a4 | NM_009204 |
5′-TGCAAAGCGTAGGTACCAACAC-3′ |
|
|
|
5′-CCGCCCTTAGTTGGTCAGAA-3′ |
| Ppargc1a | BC066868 |
5′-TCTGGAACTGCAGGCCTAACTC-3′ |
|
|
|
5′-GCAAGAGGGCTTCAGCTTTG-3′ |
| Adipoq | NM_009605 |
5′-GGGCTCAGGATGCTACTGTTG-3′ |
|
|
|
5′-AGTAACGTCATCTTCGGCATGA-3′ |
| Lpl | NM_008509 |
5′-GCCCAGCAACATTATCCAGT-3′ |
|
|
|
5′-GGTCAGACTTCCTGCTACGC-3′ |
| Gys | U53218 |
5′-CGATGGAAGGGTGAGCTTT-3′ |
|
|
|
5′-GGTGGTGAGGAAGCTGTA-3′ |
| β-actin | AY618569 |
5′-AGAGGGAAATCGTGCGTGAC-3′ |
|
|
|
5′-CAATAGTGATGACCTGGCCGT-3′ |
Statistical analysis
Data are expressed as mean ± standard deviation.
Differences were assessed using two-tailed student's t-test and
one-way analysis of variance. Statistical significance was
considered as P<0.05. Analyses were performed using SPSS for
Windows software, version 13.0 (SPSS, Inc., Chicago, IL, USA).
Results
Metabolic characterization of
insulin-resistant and diabetic hamsters
The insulin-resistant and type 2 diabetic hamsters
were phenotypically and metabolically characterized as described by
Li et al (6). At the end of
the experiment, the skeletal muscle (soleus) weight was higher in
the insulin-resistant and diabetic groups than in the control
group. The serum adiponectin levels were significantly decreased in
the insulin-resistant and diabetic groups compared with those in
the control group (Table II).
| Table II.Basal metabolic characterization of
the control, insulin-resistant and diabetic groups after 6 weeks of
treatment. |
Table II.
Basal metabolic characterization of
the control, insulin-resistant and diabetic groups after 6 weeks of
treatment.
| Characteristic | Control group | Insulin-resistant
group | Diabetic group |
|---|
| Body weight
(g) |
126.40±11.70 |
148.00±9.00a |
146.10±10.68a |
| SM weight (g) |
5.20±0.90 |
5.90±0.85a |
6.00±0.60a |
| Serum
characteristics |
|
|
|
| Blood
glucose (mg/dl) |
85.32±12.60 |
120.24±16.29a |
185.40±23.40a,b |
| Serum
insulin (ng/ml) |
0.88±0.10 |
1.90±0.21a |
1.36±0.20a,b |
| Serum
adiponectin (µg/ml) |
30.18±6.49 |
18.41±2.18a |
18.70±2.61a |
| Serum
triglyceride (mg/dl) |
175.23±31.86 |
832.97±79.65a |
872.61±76.11a |
| Serum
FFAs (mmol/l) |
1.39±0.31 |
6.60±0.91a |
7.03±1.12a |
| Serum
LDL (mmol/l) |
1.85±0.58 |
11.30±1.65a |
12.55±1.58a,b |
| Serum
HDL (mmol/l) |
1.55±0.28 |
1.20±0.36a |
1.08±0.20a |
| Serum
total cholesterol (mmol/l) |
6.75±0.81 |
14.69±2.54a |
15.78±2.88a |
| SM lipid content
(mg/g tissue) |
|
|
|
| Total
cholesterol |
0.61±0.13 |
1.42±0.26a |
1.46±0.23a |
|
Triglyceride |
4.31±0.63 |
9.70±1.77a |
10.79±2.16a |
| Index of insulin
resistance |
|
|
|
|
G0 ×
I0c |
107.02±18.62 |
318.65±76.38a |
379.40±82.90a,b |
|
HOMA-IRd |
4.91±0.93 |
14.31±3.90a |
17.90±4.60a,b |
Skeletal muscle lipid accumulation in
insulin-resistant and diabetic hamsters
Skeletal muscle lipid content, specifically TG and
TC content, was directly measured in the animal models. The results
indicated that skeletal muscle TG and TC contents were
significantly increased in the insulin-resistant and diabetic
groups compared with those in the control group. Furthermore, a
similar degree of lipid accumulation in the skeletal muscle was
observed in insulin-resistant and diabetic hamsters (Table II).
Changes of skeletal muscle gene
expression in insulin-resistant and diabetic hamsters
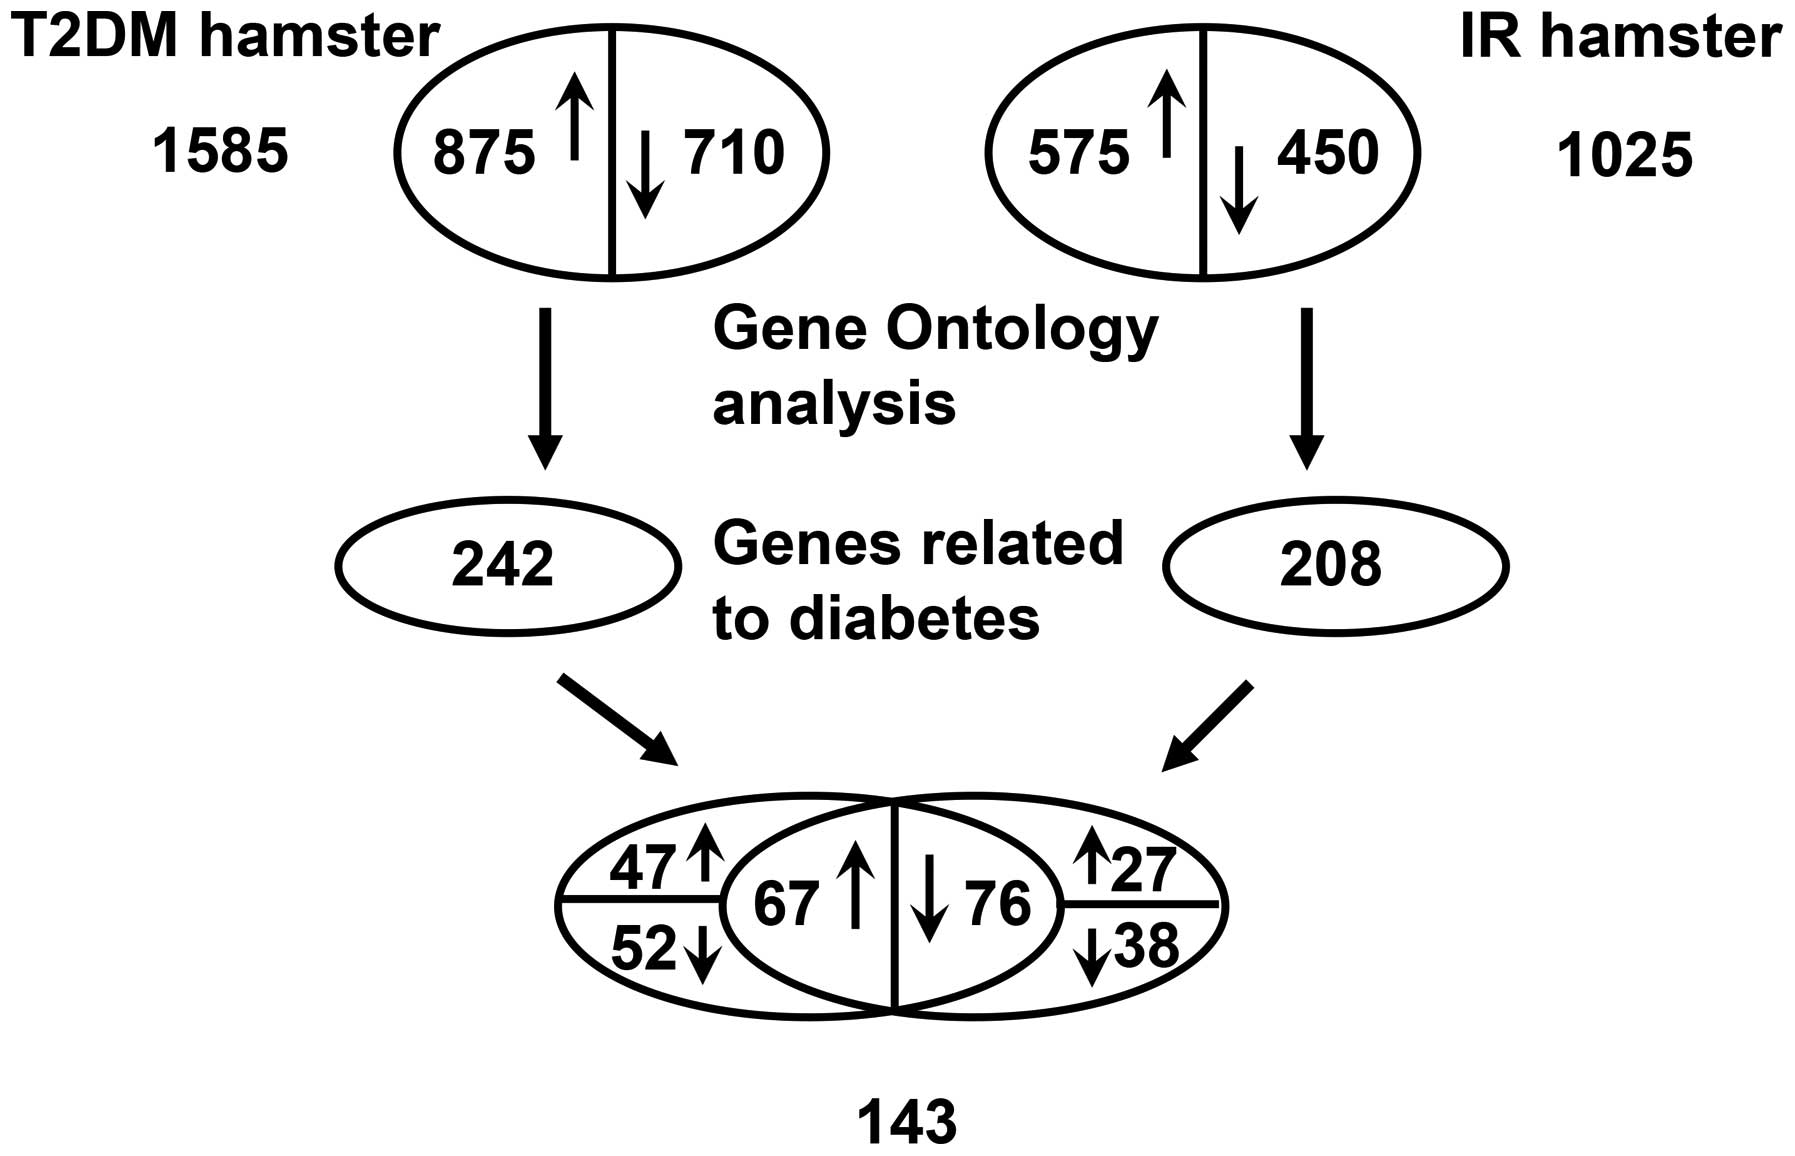
The results of the microarray analysis indicated
that ~4.1% (1,025) and 6.34% (1,585) of the assessed genes shown
significant changes (1.5-fold upregulated or downregulated) in
their mRNA levels in insulin-resistant and diabetic hamsters,
respectively. The number of differentially expressed genes was
higher in the diabetic group than in the insulin-resistant
group.
In the insulin-resistant group, ~2.3% (575) genes
were upregulated, and 1.8% (450) genes were downregulated among
1,025 differentially expressed genes. In the diabetic group, ~3.5%
(875) genes exhibited increased expression, and 2.84% (710)
exhibited decreased expression among 1,585 differentially expressed
genes. The results of Gene Ontology analysis indicated that in the
insulin resistant and diabetic groups, 208 and 242 differentially
expressed metabolism-related genes associated with diabetes were
involved in skeletal muscle lipid metabolism, glucose metabolism,
hormonally regulated signaling pathways and certain
transcription/nuclear factors. Among the 208 and 242 genes, there
were a total of 143 differentially expressed genes, including 67
upregulated (>1.5-fold) and 76 downregulated (<1.5-fold)
genes, that were identified in both groups, a partial list of which
is presented in Table III.
However, the remaining differentially expressed genes were
upregulated in only the insulin-resistant group (27 genes) or
diabetic group (47 genes) and downregulated in only the
insulin-resistant group (38 genes) or diabetic group (52 genes;
Fig. 1).
| Table III.Partial list of the upregulated
(>1.5 -fold) or downregulated (<1.5-fold) skeletal muscle
genes associated with glucose and lipid metabolism identified by
microarray analysis in insulin-resistant and diabetic groups
compared with control group. |
Table III.
Partial list of the upregulated
(>1.5 -fold) or downregulated (<1.5-fold) skeletal muscle
genes associated with glucose and lipid metabolism identified by
microarray analysis in insulin-resistant and diabetic groups
compared with control group.
| Genbank accession
no. | Gene name
(symbol) | IR group (fold
change) | DM group (fold
change) | Regulator |
|---|
| NM_007988 | Fatty acid synthase
(Fasn) | 1.84 | 3.57 | SREBP-1 |
| BE865030 | Acetyl-coenzyme A
carboxylase (Acc) | 1.75 | 3.04 | SREBP-1 |
| NM_009127 | Stearoyl CoA
desaturase 1 (Scd1) | 1.88 | 3.64 | SREBP-1 |
| NM_007643 | CD36 antigen
(Cd36) | 1.96 | 3.69 | SREBP-1 |
| NM_053115 | Acyl-coenzyme A
oxidase (Acox) | −2.88 | −3.55 | PPARα |
| NM_013495 | Carnitine
palmitoyltransferase 1, liver (Cpt1) | −2.83 | −3.53 | PPARα, PPARβ |
| NM_007382 | Acetyl-coenzyme A
dehydrogenase, medium chain (Acadm) | −2.57 | −3.23 | PPARα |
| NM_028320 | Adiponectin
receptor 1 (Adipor1) | −2.42 | −3.21 | PPARα |
| BM937289 |
3-Hydroxy-3-methylglutaryl-coenzyme A
reductase (Hmgcr) | 1.74 | 2.73 | SREBP-2 |
| NM_145942 |
3-hydroxy-3-methylglutaryl-Coenzyme A
synthase (Hmgcs) | 1.84 | 3.95 | SREBP-2 |
| NM_010700 | Low density
lipoprotein receptor (Ldlr) | 2.36 | 3.26 | SREBP-2 |
| NM_011480 | Sterol regulatory
element binding factor 1 (Srebf1) | 1.94 | 2.90 | LXRα |
| XM_127995 | Sterol regulatory
element binding factor 2 (Srebf2) | 1.76 | 2.49 | Unknown |
| NM_013839 | Nuclear receptor
subfamily 1, group H, member 3 (Nr1h3) | −2.26 | −2.99 | LXRα |
| NM_009473 | Nuclear receptor
subfamily 1, group H, member 2 (Nr1h2) | 2.39 | 2.87 | Unknown |
| NM_011144 | Peroxisome
proliferator activated receptor α (Ppara) | −2.74 | −3.75 | Unknown |
| NM_011145 | Peroxisome
proliferator activator receptor δ (Ppard) | −2.46 | −3.19 | Unknown |
| NM_011146 | Peroxisome
proliferator activated receptor γ (Pparg) | −2.37 | −3.31 | LXRα |
| NM_008509 | Lipoprotein lipase
(Lpl) | −2.15 | −3.17 | PPARγ |
| NM_009605 | Adiponectin, C1Q
and collagen domain containing (Adipoq) | −2.32 | −3.11 | PPARγ |
| NM_008904 | Peroxisome
proliferative activated receptor, gamma, coactivator 1 α
(Ppargc1a) | −2.02 | −3.04 | PPARγ |
| NM_009204 | Solute carrier
family 2 (facilitated glucose transporter), member 4
(Slc2a4) | −2.42 | −3.44 | PPARγ/β |
| NM_009464 | Uncoupling protein
3 (mitochondrial, proton carrier) (Ucp3) | −2.62 | −3.41 | PPARβ, LXRα |
| NM_013743 | Pyruvate
dehydrogenase kinase, isoenzyme 4 (Pdk4) | −2.36 | −3.15 | PPARβ |
| NM_007707 | Suppressor of
cytokine signaling 3 (Socs3) | 2.49 | 2.97 | LXRα |
| NM_011201 | Protein tyrosine
phosphatase, non-receptor type 1 (Ptpn1) | 2.28 | 3.99 | LXRα |
| NM_013820 | Hexokinase 2
(Hk2), | −2.35 | −3.29 | LXRα |
| U53218 | Glycogen synthase
(Gys) | −2.27 | −3.51 | Unknown |
Abnormal gene expression of skeletal
muscle key regulators and target genes in insulin-resistant and
diabetic hamsters
The data presented in Table III show that the expression levels
of sterol regulatory element-binding protein (SREBP) genes,
specifically SREBP-1 (also known as Srebf1) and SREBP-2 (also known
as Srebf2), were upregulated in the insulin-resistant and diabetic
groups compared with the control group. Target genes of SREBP-1c
implicated in fatty acid synthesis, such as fatty acid synthase
(Fasn), acetyl-coenzyme A carboxylase (Acc) and stearoyl-CoA
desaturase-1 (Scd1), and transport, namely fatty acid transporter
(FAT), also known as Cd36, exhibited increased expression, and
target genes of SREBP-2 involved in cholesterol metabolism,
including 3-hydroxy-3-methylglutaryl coenzyme A synthase (Hmgcs),
HMG CoA reductase (Hmgcr) and low density lipoprotein receptor
(Ldlr) were also upregulated in the insulin-resistant and diabetic
groups.
The expression levels of liver X receptor β (LXRβ),
also known as Nr1h2, were increased in the insulin-resistant and
diabetic groups compared with the control group. In addition, the
expression of suppressor of cytokine signaling 3 (Socs3) and
protein tyrosine phosphatase, non-receptor type 1 (Ptpn1), also
known as protein-tyrosine phosphatase 1B (PTP-1B), which are
regulated by LXRα, also known as Nr1h3, were also increased in the
insulin-resistant and diabetic groups compared with the control
group. Furthermore, the increase in the expression of the
aforementioned genes was higher in the diabetic group than in the
insulin-resistant group.
A significant downregulation was observed in LXRα
(Nr1h3) and peroxisome proliferator-activated receptor (PPAR) mRNA
levels, specifically PPARα, PPARβ/δ and PPARγ (also known as Ppara,
Ppard and Pparg, respectively) levels, in the insulin-resistant and
diabetic groups. The expression levels of PPARα target genes, such
as acyl-CoA oxidase (Acox), carnitine-palmitoyl transferase 1
(Cpt1), medium-chain acyl-CoA dehydrogenase (Acadm) and adiponectin
receptor 1 (Adipor1) were also downregulated. Furthermore, the gene
expression levels of pyruvate dehydrogenase kinase 4 (Pdk4), Cpt1,
glucose transporter-4 (GLUT4, also known as Slc2a4) and uncoupling
protein-3 (Ucp3) regulated by PPARβ/δ also decreased. In addition,
in comparison with the control group, the expression levels of
genes regulated by PPARγ, including peroxisome
proliferator-activated receptor γ coactivator-1α (Ppargcla, also
known as PGC-1α), lipoprotein lipase (Lpl), Slc2a4 and adiponectin
(Adipoq) were decreased in the insulin-resistant and diabetic
groups. The expression of genes regulated by LXRα, such as PPARγ,
Ucp3 and hexokinase II (Hk2) was also decreased in the
insulin-resistant and diabetic groups. In addition, glycogen
synthase (Gys) mRNA levels were decreased in the insulin-resistant
and diabetic groups compared with the control groups. Furthermore,
the reductions in the expression of the aforementioned genes were
greater in the diabetic group than in the insulin-resistant
group..
Confirmation of the expression of
skeletal muscle SREBPs, LXRs and PPARs and certain target genes by
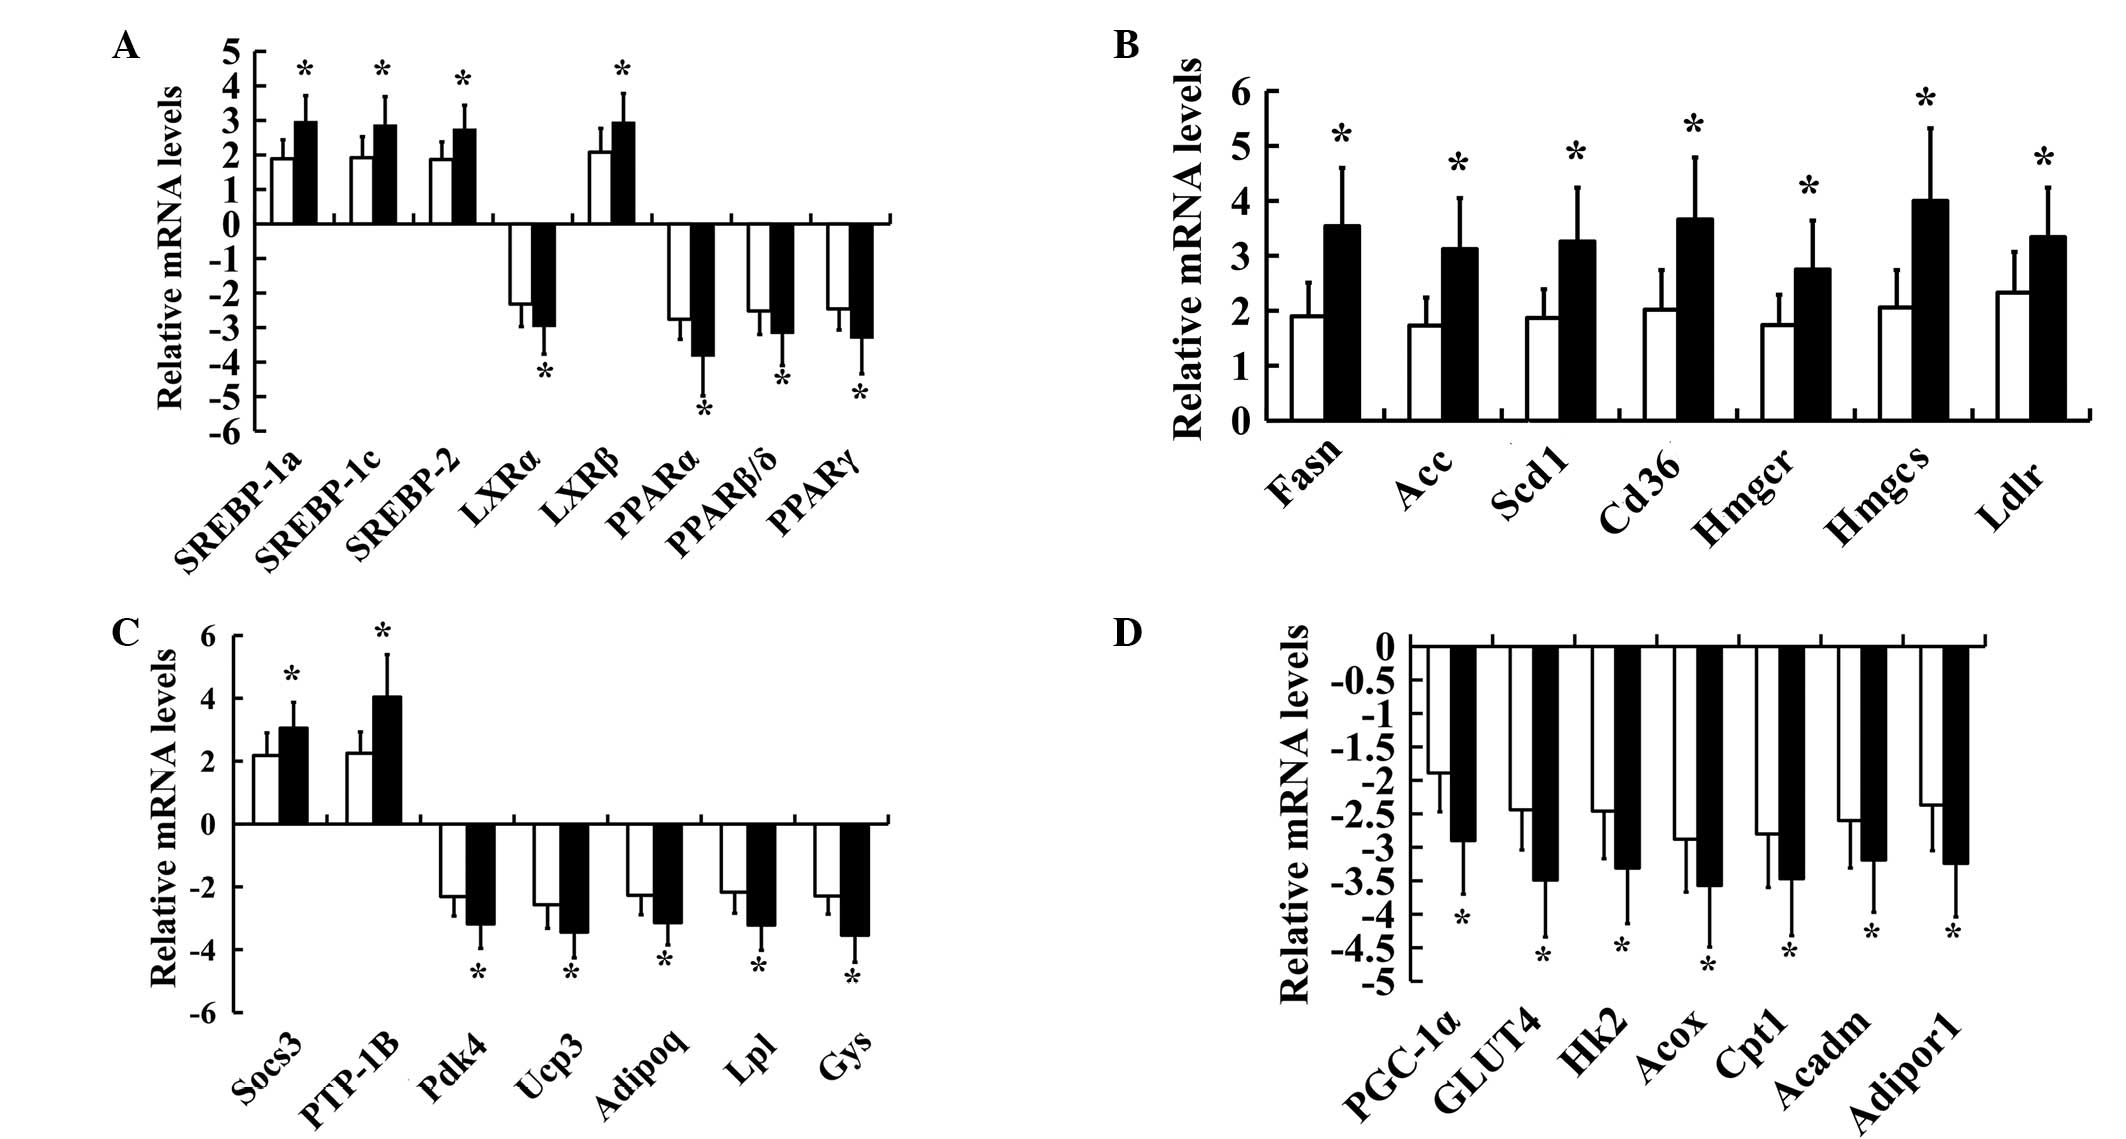
RT-qPCR in insulin-resistant and diabetic hamsters
In order to confirm the changes in gene expression
for SREBPs, LXRs and PPARs and certain of their target genes in
insulin-resistant and diabetic hamsters, 29 key genes including
SREBPs, LXRs and PPARs were chosen for further investigation by
RT-qPCR analysis. A significant increase in the SREBP (SREBP-1a,
SREBP-1c and SREBP-2) and LXRβ mRNA levels and a significant
reduction in the LXRα and PPAR (PPARα, PPARβ/δ and PPARγ) mRNA
levels were observed in the insulin-resistant and diabetic groups
(Fig. 2A). The expression levels of
Fasn, Acc, Scd1, Cd36/FAT, Ldlr, Hmgcs, Hmgcr, Socs3 and Ptpn1 were
also significantly increased, while the expression levels of Gys,
Hk2, Acox, Cpt1, Acadm, Adipor1, Pdk4, Ucp3, Slc2a4, Ppargcla, Lpl
and Adipoq were significantly decreased in both the
insulin-resistant and diabetic groups compared with the control
group (Fig. 2B–D). In addition,
significant differences in the levels of expression of SREBPs, LXRs
and PPARs and their target genes were identified between the
insulin-resistant and diabetic groups. Not all of the results
obtained by micoarray hybridization were confirmed by RT-qPCR.
Thus, in the present study only the verified data were considered
suitable for interpretation. A unique combination of abnormal gene
expression patterns of SREBPs, LXRs and PPARs was observed in
FISMIR in insulin-resistant and diabetic states.
Discussion
In subjects at high-risk of type 2 diabetes
mellitus, one of the earliest detectable abnormalities is skeletal
muscle insulin resistance, which is a critical defect in type 2
diabetes (9). Although the precise
cause of skeletal muscle insulin resistance associated with type 2
diabetes remains unknown, there is known to be a strong association
between insulin resistance and lipid accumulation in skeletal
muscle, in particular, lipotoxic fatty acid metabolite
accumulation, which results in the insulin-stimulated glucose
uptake being reduced (10). Evidence
suggests that high-fat feeding (dyslipidemia) induces skeletal
muscle insulin resistance by altering lipid metabolism in skeletal
muscle, associated with an imbalance between fatty acid uptake and
oxidation, and resulting in intramuscular lipid accumulation
(lipotoxicity) (11). The potential
mechanisms underlying the biogenesis of intramyocellular ectopic
lipid accumulation are a focus of research interest. Studies have
suggested that the local accumulation of lipid metabolites,
including ceramides, diacylglycerol or acyl-CoA, inside skeletal
muscle, may activate a serine kinase cascade involving PKCθ and
reduce insulin-stimulated insulin receptor substrate 1-(IRS-1)- and
IRS-2-associated phosphoinositide 3-kinase activity leading to
defects in insulin signaling and glucose transport (12,13).
Although the molecular mechanisms of FISMIR have been studied, the
changes in gene expression in the skeletal muscle gene and the
molecular mechanisms involved in FISMIR, that is, how intramuscular
lipid accumulation leads to insulin resistance, are not completely
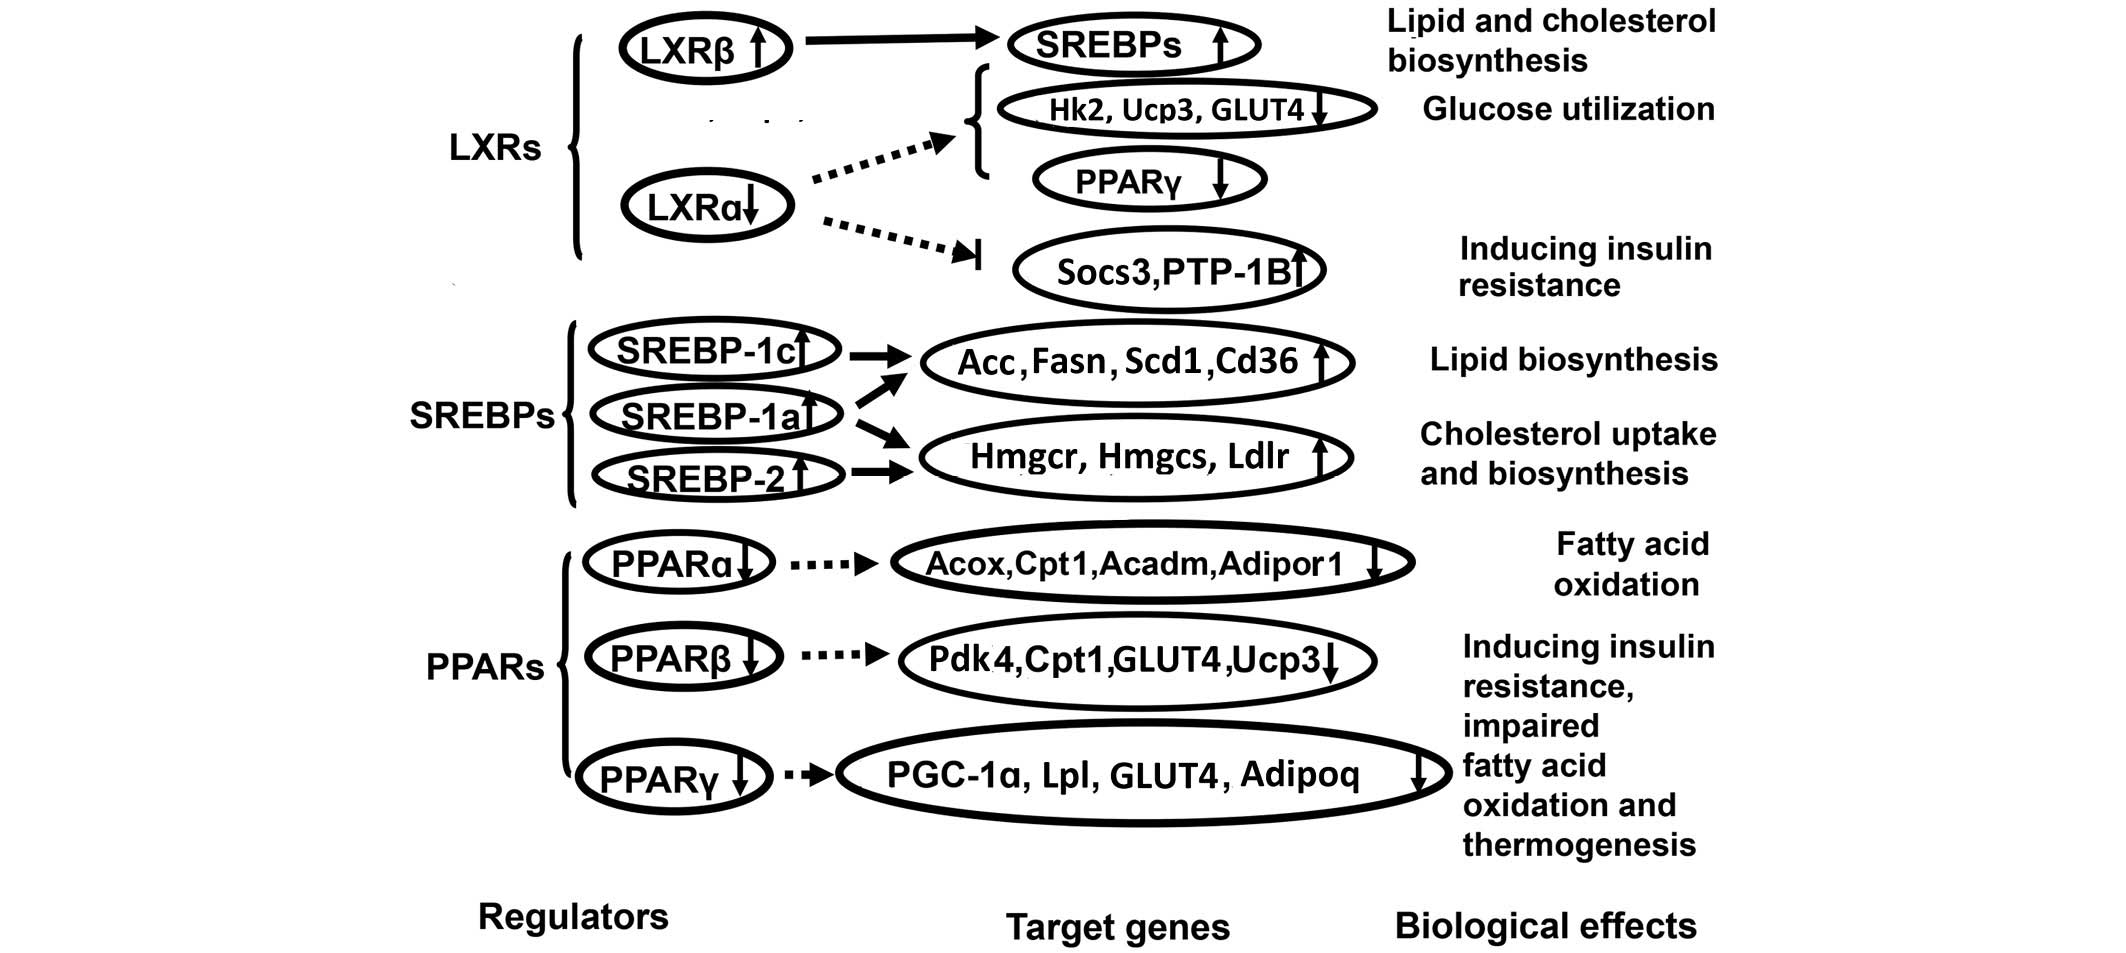
known. In the present study, microarray analysis showed that a
variety of genes involved in the regulation of lipid and glucose
metabolism were dysregulated in skeletal muscle tissues from obese
insulin-resistant and type 2 diabetic hamsters. These results
indicate that insulin-resistant state is associated with defects in
the control of transcriptional programs of lipid and glucose
metabolism, causing intramuscular lipid accumulation in skeletal
muscle tissue before and after the onset of diabetes. These results
also suggest that the combined abnormal expression of SREBPs, LXRs
and PPARs and their target genes may be involved in molecular
mechanisms of FISMIR in obese insulin-resistant and type 2 diabetic
hamsters by increasing skeletal muscle lipid metabolite content
(lipotoxicity) associated with abnormal skeletal muscle glucose and
lipid metabolism (Fig. 3).
The results indicate that the expression of skeletal
muscle LXRα, Hk2, Ucp3, GLUT4 and PPARγ significantly decreased but
the expression of skeletal muscle LXRβ, Socs3 and PTP-1B
significantly increased in insulin-resistant and diabetic hamsters.
Such changes in skeletal muscle gene expression imply that reduced
LXRα expression was not sufficient to suppress skeletal muscle
Socs3 and PTP-1B gene expression, which contributed to the
development of skeletal muscle insulin resistance (14,15), and
also was not effective in inducing skeletal muscle Hk2 expression
to promote skeletal muscle glucose utilization. Defects in Hk2
function could directly contribute to the development of skeletal
muscle insulin resistance and type 2 diabetes (16). In addition, the results demonstrated
that the reduced expression of LXRα attenuated its ability to
effectively induce the expression of GLUT4, Ucp3 and PPARγ to
prevent or attenuate skeletal muscle insulin resistance by
increasing insulin-mediated skeletal muscle glucose import,
thermogenesis, and the beneficial effect of PPARγ expression and
activation on insulin resistance (17), which is discussed in the following
text. Thus, it is implied that the reduced expression of LXRα might
contribute to skeletal muscle lipid accumulation associated with
abnormal skeletal muscle glucose and lipid metabolism, and the
development of FISMIR. In addition, skeletal muscle LXRβ, the mRNA
levels of which increased, appears to be involved in inducing the
gene expression of SREBPs to increase the lipogenetic and
cholestrogenic activities of skeletal muscle (18,19) that
contribute to skeletal muscle lipid accumulation and the
development of FISMIR in these models. The results demonstrate that
these two nuclear receptors, LXRα and LXRβ, have an interdependent
regulatory relationship, in addition to each being involved in the
control of metabolic fuel usage. Thus, it appears that the reduced
expression of LXRα, increased expression of LXRβ and changes in the
expression of their target genes contributed to the abnormal
skeletal muscle glucose and lipid metabolism, skeletal muscle lipid
accumulation and development of FISMIR and obesity-related diabetes
observed in these insulin-resistant and type 2 diabetic
hamsters.
In the present study, the expression of skeletal
muscle SREBPs (SREBP-1a, SREBP-1c and SREBP-2), Fasn, Acc, Scd1,
Cd36/FAT, Ldlr, Hmgcs and Hmgcr significantly increased in
insulin-resistant and diabetic hamsters. The overexpression of
skeletal muscle SREBPs was perhaps induced by increased expression
of LXRβ directly and by hyperinsulinemia resulting from a HFD and
hyperglycemia through a Janus kinase/signal transducer and
activator of transcription dependent pathway indirectly (20). However, the reduced LXRα expression
does not appear to be associated with induction of SREBP
overexpression in skeletal muscle. Thus, with respect to induction
of SREBP overexpression, the LXR isomers, LXRα and LXRβ, exhibited
different actions. Among SREBP isomers, activated overexpression of
SREBP-1c drives the transcription of genes involved in de
novo lipogenesis, such as Acc, Scd1, Fasn, and fatty acid
transport (Cd36/FAT), and regulates the TG storage content in the
skeletal muscle (21). Thus,
overexpression of SREBP-1c might contribute to the development of
skeletal muscle lipid accumulation that leads to skeletal muscle
insulin resistance by increasing lipid synthesis and the influx of
fatty acids into muscle cells. Furthermore, the increased skeletal
muscle lipid accumulation could lead to Hk2 inhibition, thereby
contributing to skeletal muscle insulin resistance (22). Activated overexpression of SREBP-2
contributes to enhanced skeletal muscle cholesterol uptake and
biosynthesis by driving the expression of genes including Ldlr,
Hmgcs and Hmgcr (23). The
overexpression of SREBP-1a exhibits the ability to induce skeletal
muscle lipogenesis and cholesterogenesis (24). Thus, it is implied that the
overexpression of SREBPs and their target genes might lead to the
abnormal skeletal muscle glucose and lipid metabolism and skeletal
muscle lipid accumulation that contributes to FISMIR in
insulin-resistant and type 2 diabetic hamsters. In addition, the
results of the present study indicate that the increased expression
of SREBP-1c is not involved in the inductive effect of
hyperinsulinemia on Hk2 gene transcription in the skeletal muscle
of insulin-resistant and diabetic hamsters', unlike the inductive
mechanisms of hyperinsulinemia on Hk2 gene transcription mediated
by SREBP-1c observed in the normal state (25,26).
The expression of skeletal muscle PPARs (PPARα,
PPARβ/δ and PPARγ), Acox, Cpt1, Acadm, Adipor1, Pdk4, Ucp3, GLUT4,
PGC-1α, Lpl and Adipoq was significantly decreased in the
insulin-resistant and diabetic hamsters of the present study.
Firstly, such alterations in the expression of skeletal muscle
PPARα and its target genes suggest that the reduced expression of
skeletal muscle PPARα did not effectively drive the transcription
of genes, such as Acox, Cpt1 and Acadm, involved in the peroxisomal
and mitochondrial oxidation of fatty acids. Additionally, the
reduced expression of skeletal muscle PPARα did not effectively
induce the expression of its target gene Adipor1 and so did not
activate AMP-activated protein kinase (AMPK) to stimulate fatty
acid combustion in skeletal muscle, thereby contributing to
skeletal muscle lipid accumulation (27,28).
Decreased adiponectin action mediated by reduced Adipor1 expression
could cause obesity-linked insulin resistance by adverse
interactions with other factors (28,29). Our
previous study has indicated that the reduced expression of PPARα
and fatty acid oxidation-related genes, such as Acox, occur before
the development of lipid accumulation (6). Thus, decreased skeletal muscle PPARα
expression contributes to skeletal muscle lipid accumulation and
FISMIR.
The reduced expression of skeletal muscle PPARβ/δ
and its target genes, including Pdk4, Cpt1, Ucp3 and GLUT4,
contributes to the development of FISMIR by decreasing lipid
utilization, fatty acid β-oxidation, energy expenditure and glucose
transport. The decreased Ucp3 expression suggests that these
insulin-resistant and diabetic hamsters have impaired HFD-induced
(lipotoxic) thermogenesis (30).
Finally, the reduced expression of skeletal muscle PPARγ and its
target genes, such as PGC-1α, Lpl, Adipoq and GLUT4, also
contribute to the development of FISMIR. The reduced expression of
PPARγ is not likely to have induced the gene expression of
glutathione peroxidase (GPx3), which, therefore, would not reduce
the extracellular H2O2 levels causing insulin
resistance in skeletal muscle (31).
A reduction in the expression of Lpl in skeletal muscle contributes
to insulin resistance in other key metabolic tissues and ultimately
leads to systemic insulin resistance (32).
The reduced expression of PGC-1α, one of target
genes of PPARγ, results in a reduction in the biogenesis of
mitochondria, respiration and muscle oxidative phenotype, which
contributes to skeletal muscle lipid accumulation and FISMIR
(33). The decreased expression of
adiponectin may abolish its ability to activate AMPK and/or
increase the transcriptional activity of PPARα and its target genes
in skeletal muscle to stimulate fatty acid combustion (28,34).
Adiponectin when expressed at low levels, would lost the ability to
suppress the expression of SREBP-1c through the adiponectin/liver
kinase B1/AMPK pathway (28,35). Thus, the decreased expression of
adiponectin contributes to skeletal muscle lipid accumulation
associated with the development of FISMIR. Therefore, it appears
that the reduced expression of skeletal muscle PPARs and
PPAR-responsive genes leads to a reduction of skeletal muscle fatty
acid β-oxidation and contributes to abnormal skeletal muscle
glucose and lipid metabolism and skeletal muscle lipid
accumulation, subsequently causing deteriorated skeletal muscle
insulin resistance.
In conclusion, the metabolic characteristics and
clinical syndromes of obesity-related insulin resistance and type 2
diabetes exhibited in the hamster models induced by a HFD and
streptozotocin treatment were partially due to the combined
abnormal expression of skeletal muscle SREBP, LXR and PPAR
transcriptional programs. In addition, the results of the present
study also demonstrate that the decreased expression of two main
steps among all three major steps in non-oxidative glucose
processing, namely glucose transport (GLUT4) and phosphorylation
(Hk2), and glycogen synthesis (Gys) was regulated by the combined
abnormal expression of skeletal muscle LXR, PPAR and SREBP
transcriptional programs in the skeletal muscle of
insulin-resistant and type 2 diabetic hamsters, which might be
implicated as major defects responsible for causing insulin
resistance. The changes in these gene transcriptional programs
could partially explain the association between obesity induced by
a HFD, abnormal skeletal muscle glucose and lipid metabolism, and
skeletal muscle lipid accumulation contributing to the occurrence
and development of skeletal muscle insulin resistance and overt
type 2 diabetes. Thus, it appears that associations exist among
disturbed skeletal muscle glucose and lipid metabolism, skeletal
muscle lipid accumulation, FISMIR and type 2 diabetes.
Acknowledgements
The authors would like to thank Kerang Shou and Hong
Gao for assistance with the animal experiments and technical help.
They also thank Hao Yang of the Beijing Proteome Research Center
and Xiaobing Zhang of CapitalBio Corporation (Beijing, China).
References
|
1
|
Anandharajan R, Sayyed SG, Doshi LS, Dixit
P, Chandak PG, Dixit AV, Brahma MK, Deshmukh NJ, Gupte R, Damre A,
et al: 18F9 (4-(3,6-bis (ethoxycarbonyl)-4,5,6,7-tetrahydrothieno
(2,3-c)pyridin-2-ylamino)-4-oxobutanoic acid) enhances
insulin-mediated glucose uptake in vitro and exhibits antidiabetic
activity in vivo in db/db mice. Metabolism. 58:1503–1516. 2009.
View Article : Google Scholar : PubMed/NCBI
|
|
2
|
Guri AJ, Hontecillas R and
Bassaganya-Riera J: Dietary modulators of peroxisome
proliferator-activated receptors: Implications for the prevention
and treatment of metabolic syndrome. J Nutrigenet Nutrigenomics.
1:126–135. 2008. View Article : Google Scholar : PubMed/NCBI
|
|
3
|
Unger RH and Orci L: Lipotoxic diseases of
nonadipose tissues in obesity. Int J Obes Relat Metab Disord.
24(Suppl 4): S28–S32. 2000. View Article : Google Scholar : PubMed/NCBI
|
|
4
|
Smith AG and Muscat GE: Skeletal muscle
and nuclear hormone receptors: Implications for cardiovascular and
metabolic disease. Int J Biochem Cell Biol. 37:2047–2063. 2005.
View Article : Google Scholar : PubMed/NCBI
|
|
5
|
Guilherme A, Virbasius JV, Puri V and
Czech MP: Adipocyte dysfunctions linking obesity to insulin
resistance and type 2 diabetes. Nat Rev Mol Cell Biol. 9:367–377.
2008. View
Article : Google Scholar : PubMed/NCBI
|
|
6
|
Li G, Liu X, Zhu H, Huang L, Liu Y, Ma C
and Qin C: Insulin resistance in insulin-resistant and diabetic
hamsters (Mesocricetus auratus) is associated with abnormal
hepatic expression of genes involved in lipid and glucose
metabolism. Comp Med. 59:449–458. 2009.PubMed/NCBI
|
|
7
|
Brown MS, Faust JR and Goldstein JL: Role
of the low density lipoprotein receptor in regulating the content
of free and esterified cholesterol in human fibroblasts. J Clin
Invest. 55:783–793. 1975. View Article : Google Scholar : PubMed/NCBI
|
|
8
|
Livak KJ and Schmittgen TD: Analysis of
relative gene expression data using real-time quantitative PCR and
the 2(−Delta Delta C(T)) method. Methods. 25:402–408. 2001.
View Article : Google Scholar : PubMed/NCBI
|
|
9
|
Patti ME, Butte AJ, Crunkhorn S, Cusi K,
Berria R, Kashyap S, Miyazaki Y, Kohane I, Costello M, Saccone R,
et al: Coordinated reduction of genes of oxidative metabolism in
humans with insulin resistance and diabetes: Potential role of PGC1
and NRF1. Proc Natl Acad Sci USA. 100:8466–8471. 2003. View Article : Google Scholar : PubMed/NCBI
|
|
10
|
Dumas JF, Simard G, Flamment M, Ducluzeau
PH and Ritz P: Is skeletal muscle mitochondrial dysfunction a cause
or an indirect consequence of insulin resistance in humans?
Diabetes Metab. 35:159–167. 2009. View Article : Google Scholar : PubMed/NCBI
|
|
11
|
Mullen KL, Pritchard J, Ritchie I, Snook
LA, Chabowski A, Bonen A, Wright D and Dyck DJ: Adiponectin
resistance precedes the accumulation of skeletal muscle lipids and
insulin resistance in high-fat-fed rats. Am J Physiol Regul Integr
Comp Physiol. 296:R243–R251. 2009. View Article : Google Scholar : PubMed/NCBI
|
|
12
|
Mauvais-Jarvis F, Clegg DJ and Hevener AL:
The role of estrogens in control of energy balance and glucose
homeostasis. Endocr Rev. 34:309–338. 2013. View Article : Google Scholar : PubMed/NCBI
|
|
13
|
Choi CS, Fillmore JJ, Kim JK, Liu ZX, Kim
S, Collier EF, Kulkarni A, Distefano A, Hwang YJ, Kahn M, et al:
Overexpression of uncoupling protein 3 in skeletal muscle protects
against fat-induced insulin resistance. J Clin Invest.
117:1995–2003. 2007. View
Article : Google Scholar : PubMed/NCBI
|
|
14
|
Nieto-Vazquez I, Fernández-Veledo S, de
Alvaro C and Lorenzo M: Dual role of interleukin-6 in regulating
insulin sensitivity in murine skeletal muscle. Diabetes.
57:3211–3221. 2008. View Article : Google Scholar : PubMed/NCBI
|
|
15
|
Tsou RC and Bence KK: The genetics of
PTPN1 and obesity: Insights from mouse models of tissue-specific
PTP1B deficiency. J Obes. 2012:9268572012. View Article : Google Scholar : PubMed/NCBI
|
|
16
|
Heikkinen S, Suppola S, Malkki M, Deeb SS,
Jänne J and Laakso M: Mouse hexokinase II gene: Structure, cDNA,
promoter analysis and expression pattern. Mamm Genome. 11:91–96.
2000. View Article : Google Scholar : PubMed/NCBI
|
|
17
|
Norris AW, Hirshman MF, Yao J, Jessen N,
Musi N, Chen L, Sivitz WI, Goodyear LJ and Kahn CR: Endogenous
peroxisome proliferator-activated receptor-gamma augments fatty
acid uptake in oxidative muscle. Endocrinology. 149:5374–5383.
2008. View Article : Google Scholar : PubMed/NCBI
|
|
18
|
Hessvik NP, Boekschoten MV, Baltzersen MA,
Kersten S, Xu X, Andersén H, Rustan AC and Thoresen GH: LXR{beta}
is the dominant LXR subtype in skeletal muscle regulating
lipogenesis and cholesterol efflux. Am J Physiol Endocrinol Metab.
298:E602–E613. 2010. View Article : Google Scholar : PubMed/NCBI
|
|
19
|
Zhu R, Ou Z, Ruan X and Gong J: Role of
liver X receptors in cholesterol efflux and inflammatory signaling.
Mol Med Rep. 5:895–900. 2012.PubMed/NCBI
|
|
20
|
Guillet-Deniau I, Pichard AL, Koné A,
Esnous C, Nieruchalski M, Girard J and Prip-Buus C: Glucose induces
de novo lipogenesis in rat muscle satellite cells through a
sterol-regulatory-element-bnding-protein-1c-dependent pathway. J
Cell Sci. 117:1937–1944. 2004. View Article : Google Scholar : PubMed/NCBI
|
|
21
|
Yahagi N, Shimano H, Hasty AH, Matsuzaka
T, Ide T, Yoshikawa T, Amemiya-Kudo M, Tomita S, Okazaki H, Tamura
Y, et al: Absence of sterol regulatory element-binding protein-1
(SREBP-1) ameliorates fatty livers but not obesity or insulin
resistance in Lep(ob)/Lep(ob) mice. J Biol Chem. 277:19353–19357.
2002. View Article : Google Scholar : PubMed/NCBI
|
|
22
|
Thompson AL and Cooney GJ: Acyl-CoA
inhibition of hexokinase in rat and human skeletal muscle is a
potential mechanism of lipid-induced insulin resistance. Diabetes.
49:1761–1765. 2000. View Article : Google Scholar : PubMed/NCBI
|
|
23
|
Yen CF, Jiang YN, Shen TF, Wong IM, Chen
CC, Chen KC, Chang WC, Tsao YK and Ding ST: Cloning and expression
of the genes associated with lipid metabolism in Tsaiya ducks.
Poult Sci. 84:67–74. 2005. View Article : Google Scholar : PubMed/NCBI
|
|
24
|
Liang G, Yang J, Horton JD, Hammer RE,
Goldstein JL and Brown MS: Diminished hepatic response to
fasting/refeeding and liver X receptor agonists in mice with
selective deficiency of sterol regulatory element-binding
protein-1c. J Biol Chem. 277:9520–9528. 2002. View Article : Google Scholar : PubMed/NCBI
|
|
25
|
Kruszynska YT, Mulford MI, Baloga J, Yu JG
and Olefsky JM: Regulation of skeletal muscle hexokinase II by
insulin in nondiabetic and NIDDM subjects. Diabetes. 47:1107–1113.
1998. View Article : Google Scholar : PubMed/NCBI
|
|
26
|
Gosmain Y, Lefai E, Ryser S, Roques M and
Vidal H: Sterol regulatory element-binding protein-1 mediates the
effect of insulin on hexokinase II gene expression in human muscle
cells. Diabetes. 53:321–329. 2004. View Article : Google Scholar : PubMed/NCBI
|
|
27
|
Whitehead JP, Richards AA, Hickman IJ,
Macdonald GA and Prins JB: Adiponectin - a key adipokine in the
metabolic syndrome. Diabetes Obes Metab. 8:264–280. 2006.
View Article : Google Scholar : PubMed/NCBI
|
|
28
|
Almabouada F, Diaz-Ruiz A, Rabanal-Ruiz Y,
Peinado JR, Vazquez-Martinez R and Malagon MM: Adiponectin
receptors form homomers and heteromers exhibiting distinct ligand
binding and intracellular signaling properties. J Biol Chem.
288:3112–3125. 2013. View Article : Google Scholar : PubMed/NCBI
|
|
29
|
Yamauchi T and Kadowaki T: Physiological
and pathophysiological roles of adiponectin and adiponectin
receptors in the integrated regulation of metabolic and
cardiovascular diseases. Int J Obes (Lond). 32(Suppl 7): S13–S18.
2008. View Article : Google Scholar : PubMed/NCBI
|
|
30
|
Muscat GE and Dressel U: Cardiovascular
disease and PPARdelta: Targeting the risk factors. Curr Opin
Investig Drugs. 6:887–894. 2005.PubMed/NCBI
|
|
31
|
Chung SS, Kim M, Youn BS, Lee NS, Park JW,
Lee IK, Lee YS, Kim JB, Cho YM, Lee HK and Park KS: Glutathione
peroxidase 3 mediates the antioxidant effect of peroxisome
proliferator-activated receptor gamma in human skeletal muscle
cells. Mol Cell Biol. 29:20–30. 2009. View Article : Google Scholar : PubMed/NCBI
|
|
32
|
Wang H, Knaub LA, Jensen DR, Young Jung D,
Hong EG, Ko HJ, Coates AM, Goldberg IJ, de la Houssaye BA, Janssen
RC, et al: Skeletal muscle-specific deletion of lipoprotein lipase
enhances insulin signaling in skeletal muscle but causes insulin
resistance in liver and other tissues. Diabetes. 58:116–124. 2009.
View Article : Google Scholar : PubMed/NCBI
|
|
33
|
Choi CS, Befroy DE, Codella R, Kim S,
Reznick RM, Hwang YJ, Liu ZX, Lee HY, Distefano A, Samuel VT, et
al: Paradoxical effects of increased expression of PGC-1alpha on
muscle mitochondrial function and insulin-stimulated muscle glucose
metabolism. Proc Natl Acad Sci USA. 105:19926–19931. 2008.
View Article : Google Scholar : PubMed/NCBI
|
|
34
|
Kadowaki T and Yamauchi T: Adiponectin and
adiponectin receptors. Endocr Rev. 26:439–451. 2005. View Article : Google Scholar : PubMed/NCBI
|
|
35
|
Awazawa M, Ueki K, Inabe K, Yamauchi T,
Kaneko K, Okazaki Y, Bardeesy N, Ohnishi S, Nagai R and Kadowaki T:
Adiponectin suppresses hepatic SREBP1c expression in an
AdipoR1/LKB1/AMPK dependent pathway. Biochem Biophys Res Commun.
382:51–56. 2009. View Article : Google Scholar : PubMed/NCBI
|