Introduction
Amyotrophic lateral sclerosis (ALS) is a progressive
neurodegenerative disease specifically affecting the upper and
lower motor neurons. Due to frequent early misdiagnosis, patients
do not benefit from early drug intervention and clinical drug
studies have been largely unsuccessful; a correct, early diagnosis
of ALS is therefore crucial.
Such a clinical diagnosis, and study of the
pathogenesis of ALS, could occur through analysis of changes to the
cerebrospinal fluid (CSF) proteins. Insulin-like growth factor-1,
vascular endothelial growth factor, transactive response
DNA-binding protein 43, monocyte chemotactic protein 1 and other
proteins have been reported as possible diagnostic indicators of
ALS (1–4), but a definitive diagnostic indicator
has yet to be established.
CSF quantitative proteomics, including differential
in gel electrophoresis (DIGE) and isotope-coded affinity tags, have
been reported in studies on Alzheimer's disease and Parkinson's
disease (5,6), but have not been widely used to
investigate ALS. In 2005, a study by Ranganathan et al
(7) was the first to investigate the
CSF in ALS patients using surface-enhanced laser
desorption/ionization (SELDI) technology and proteomics; three
proteins, cystatin C, transthyretin and a carboxy-terminal fragment
of the neuroendocrine protein 7B2, were screened and validated for
their sensitivity and specificity as biomarkers. Other previous
studies examined the CSF of ALS with two-dimensional gel
electrophoresis, DIGE and SELDI (8,9), but use
of isobaric tags for relative and absolute quantitation (iTRAQ)
technology in this context has not been reported, to the best of
our knowledge.
The present study compared the CSF protein
expression of ALS patients and healthy [normal control [NC] group)
patients using iTRAQ labeling and 2-dimensional liquid
chromatography/tandem mass spectrometry (2D LC-MS/MS) technology,
screened the resulting proteins and verified their differential
expression by western blotting, in order to determine the most
effective biomarkers for ALS diagnosis.
Patients and methods
Patients
ALS-A group
A total of 35 patients with ALS who presented to
Huashan Hospital between March 2008 and October 2010 were selected
for the study. Informed consent was obtained from all patients, or
their families. Tension headache sufferers were selected as the
normal control (NC) group. The other neurological disease (OND)
group consisted of patients who, during clinical diagnosis, were
subjected to a lumbar puncture; these patients suffered from
conditions such as chronic non-inflammatory peripheral neuropathy,
Parkinson's disease, spastic paraplegia and hydrocephalus. Patient
ages ranged between 30 and 75 years old.
ALS-B group
A total of 10 cases of ALS were randomly selected
from the ALS-A group and used to screen additional proteins.
CSF sample collection
Under fasting conditions, each patient was treated
with the 2 ml local anesthetic lidocaine hydrochloride injection
(2%; Shanghai Harvest Pharmaceutical Co., Ltd., Shanghai, China)
and subjected to a lumbar puncture, from which 8–10 ml of CSF was
collected. A volume of 4–5 ml of CSF was immediately centrifuged at
2,000 × g for 10 min; the resulting supernatant was collected and
placed in 1.5 ml Eppendorf tubes (Eppendorf AG, Hamburg, Germany)
at −80°C. The remaining CSF was used for biochemical and
immunological detection, as subsequently described.
Determination of protein concentration using
iTRAQ and 2D LC-MS/MS
Following the removal of 22 high-abundance proteins,
including albumin and IgG, using ProteoMiner low abundance protein
enrichment kits (Bio-Rad Laboratories, Inc., Hercules, CA, USA),
protein quantification was conducted using a Protein Assay reagent
kit (Bio-Rad Laboratories, Inc., Hercules, CA, USA) based on
Bradford methods, according to manufacturer's protocol. iTRAQ
labeling was performed according to the manufacturer's protocol
(Applied Biosystems Life Technologies, Foster City, CA, USA).
Briefly, 100 µg CSF proteins from the ALS and NC groups were
precipitated with cold acetone (ratio of acetone:sample, 5:1) for 1
h at −20°C and resuspended in 20 µl dissolution buffer,
respectively. Following centrifugation at 2,000 × g for 15 min and
disposal of the supernatant, the precipitant was dissolved into 20
ul iTRAQ solution and 1 ul 1% sodium dodecyl sulfate (SDS).
Subsequently, 1 ul cysteine sealing reagent was added for 10 min at
room temperature. Proteins were trypsinized (Sigma-Aldrich, St.
Louis, MO, USA) at 37°C overnight (ratio of enzyme:protein, 1:20).
Peptides were labeled with iTRAQ regents for 1 h at room
temperature. iTRAQ regents 113 and 118 were used to label the
peptides from the NC and ALS groups, respectively. Following this,
samples were mixed, desalted with Sep-Pak Vac C18 cartridges
(Waters Corporation, Milford, MA, USA) and dried in a vacuum
concentrator.
2D LC-MS/MS analysis
High-performance liquid chromatography and
time-of-flight mass spectrometry (API QSTAR XL Hybrid LC-MS/MS;
Applied Biosystems Life Technologies) were used for protein
separation and analysis. For 2D LC-MS/MS analysis, the
iTRAQ-labeled mixed peptides were fractionated using strong cation
exchange (SCX) chromatography on a 20AD HPLC system (Shimadzu
Corporation, Kyoto, Japan) with a polysulfoethyl column (2.1×100
mm; 5 µm; 200 Å; The Nest Group, Inc., Southborough, MA, USA).
Peptide mixture was reconstituted in Buffer A (SCXA), which
contained 10 mM KH2PO4 in 25% acetonitrile
(pH 2.6; Thermo Fisher Scientific, Waltham, MA, USA), and loaded
onto the column. Peptides were separated at a flow rate of 200
µl/min for 60 min with a gradient of 0–80% Buffer B (Buffer A
supplemented with 350 mM KCl) in Buffer A. Absorbances of 214 nm
and 280 nm were identified by tandem mass spectrometry. A total of
20 SCX fractions were collected.
Protein identification
All data from tandem mass spectrometry were obtained
from the UniProtKB/Swiss-Prot database using ProteinPilot 3.0
software (AB Sciex, Framingham, MA, USA), and the identification
and quantification results were recorded. Search parameters were as
follows: At least 1 matching peptide, a confidence interval (CI) of
the peptide of >95% (P<0.05) and results in accordance with
the peak of the spectrum.
Protein annotation and classification
The Database for Annotation, Visualization and
Integrated Discovery (DAVID) was used for functional annotation of
proteins and gene ontology (GO) was used to classify these
proteins, including their involvement in biological processes, as
cellular components and their molecular function.
Differential expression of proteins
Western blotting was performed to analyze
differential protein expression in the CSF between the ALS-B and NC
groups, in order to verify the iTRAQ results. A total of 1 ml CSF
sample was added into a 3 kD ultrafiltration centrifugal tube (EMD
Millipore, Billerica, CA, USA) for desalination and concentration.
Protein concentrations were subsequently measured via the Bradford
method using Bio-Rad protein assay reagent (Bio-Rad Laboratories,
Inc.). A total of 20 µg protein was separated by 12% SDS
polyacrylamide gel electrophoresis followed by electro-blotting
onto a polyvinylidene difluoride membrane. The membrane was
subsequently incubated with 5% nonfat dry milk in Tris-buffered
saline at room temperature for 2 h, in order to block non-specific
binding. Following this, the membrane was incubated with the
following primary antibodies: Rabbit anti-human insulin-like growth
factor II (IGF-2; l:1,250; ab9574); mouse anti-human leucine-rich
α-2-glycoprotein 1 (LRG1; l:800; ab57992); and rabbit anti-human
glutamate receptor 4 (GRIA4; 1:500; ab61171; all Abcam, Cambridge,
UK), diluted in blocking buffer overnight at 4°C. The membrane was
subsequently incubated with horseradish peroxidase-conjgated
AffinPure goat anti-rabbit (KC-RB-035) and anti-mouse (KC-MM-035)
immunoglobulin G (H+L) secondary antibodies (both 1:5,000; Shanghai
Kangcheng Biotechnology Co., Ltd., Shanghai, China) diluted with
nonfat dry milk and Tris-buffered saline and Tween 20 (TBST). After
rinsing three times with TBST, the western blot protein band was
detected using chemiluminescence, and the gray scales of the bands
were quantified using software Image Lab 3.0 (Bio-Rad Laboratories,
Inc.).
Statistical analysis
SPSS17.0 (SPSS, Inc., Chicago, IL, USA) was used for
statistical analyses, GraphPad Prism 4 (GraphPad Software, Inc., La
Jolla, CA, USA) was used to draw graphs and ProteinPilot 3.0 was
used to detect the protein threshold [where Unused ProtScore
>1.3 (95% CI)]. An error (ProtScore) of 2.0 indicated a credible
identified protein; an error of >1.2 or <0.8 indicated an
identifiable significant difference (P<0.05).
All data were normally distributed when examined
with a one-sample Kolmogorov-Smirnov test. A t-test was used to
compare two groups and data are expressed as the mean ± standard
deviation; P<0.05 was considered to indicate a statistically
significant difference.
Correlation analysis used multiple linear regression
analysis and the disaggregated data was assigned a conversion
score, as follows: i) Gender: male, 1; and female, 2; ii)
diagnostic level: diagnosed, 1; suspected, 2; suspected and
clinically supported, 3; iii) involvement: medullary, 1; cervical,
2; and lumbar, 3.
Results
Clinical data
The average ages of the ALS-B and NC groups were
52.7±12.13 and 51.1±10.62 years old, respectively, and there were 6
men and 4 women in each group. No significant difference in age or
gender balance between these groups was identified (P>0.05).
The average ages of the ALS-A and OND groups were
52.80±11.98 and 51.17±12.44 years old, respectively, and there were
22 men and 13 women in the ALS-A group, and 11 men and 7 women in
the OND group. No significant difference was identified in age or
gender balance between these groups (P>0.05). The protein
concentration of CSF was 350.46±110.09 mg/l in the ALS-A group and
377.56±85.85 mg/l in the control group, with no significant
difference revealed between the two (P>0.05).
CSF protein identification
iTRAQ and 2D-LC-MS/MS analyses were performed and
used to analyze the protein content of the CSF in the ALS and NC
groups. A total of 248 proteins were identified, and their names,
the iTRAQ ratio (where available) and the UniProtKB/Swiss-Prot
database accession number of 243 of these proteins are provided
(95% CI; Tables I and II).
 | Table I.Proteins analyzed in the present
study. |
Table I.
Proteins analyzed in the present
study.
| Unused ProtScore (CL,
%) | Proteins detected,
n | Proteins prior to
grouping, n | Distinct peptides,
n | Spectra identified,
n | % of total
spectra |
|---|
| >2.0 (99) | 211 | 285 | 18106 | 37075 | 33.8 |
| >1.3 (95) | 248 | 347 | 19568 | 38823 | 35.4a |
| >0.47 (66) | 294 | 448 | 21271 | 40761 | 37.2 |
| Table II.Proteins in ALS and NC groups by
cerebrospinal fluid. |
Table II.
Proteins in ALS and NC groups by
cerebrospinal fluid.
| Protein name | iTRAQ ratio
(ALS/NC) | Accession no. |
|---|
| Serum albumin | 0.9262 | sp|P02768| |
| Complement C4-A | 1.0317 | sp|P0C0L4| |
| Complement C3 | 1.0003 | sp|P01024| |
| Transthyretin | 1.0717 | sp|P02766| |
| α-1-antitrypsin | 0.7250 | sp|P01009| |
|
α-2-macroglobulin | 0.9938 | sp|P01023| |
| Serotransferrin | 0.8150 | sp|P02787| |
| Fibronectin | 1.0084 | sp|P02751| |
| Apolipoprotein
A1 | 1.0930 | sp|P02647| |
| Ig γ1 chain C
region | 0.9304 | sp|P01857| |
| Apolipoprotein E | 1.1323 | sp|P02649| |
| Gelsolin | 1.0509 | sp|P06396| |
| Apolipoprotein
A-IV | 1.1446 | sp|P06727| |
| Clusterin | 1.0969 | sp|P10909| |
| Cystatin C | 1.0671 | sp|P01034| |
| Vitamin D-binding
protein | 0.8710 | sp|P02774| |
| Contactin-1 | 1.0430 | sp|Q12860| |
| Complement
factor | 1.0036 | sp|P08603| |
| Pigment
epithelium-derived factor | 0.9803 | sp|P36955| |
| Secretogranin-1 | 1.0670 | sp|P05060| |
| Ceruloplasmin | 0.8720 | sp|P00450| |
| Serum albumin | 1.0588 | sp|P51693| |
| Haptoglobin | 0.6926 | sp|P00738| |
| Secretogranin-3 | 1.1640 | sp|Q8WXD2| |
| Antithrombin-III | 0.8452 | sp|P01008| |
| Chromogranin-A | 1.0098 | sp|P010645| |
| α-1-B
glycoprotein | 0.9835 | sp|P04217| |
| β-Ala-His
dipeptidase | 1.1591 | sp|Q96KN2| |
| Neuronal cell
adhesion molecule | 1.0097 | sp|Q92823| |
| Ig γ2 chain C
region | 1.0383 | sp|P01859| |
| Monocyte
differentiation antigen CD14 | 0.8775 | sp|P08571| |
| Fibrinogen α
chain | 1.0375 | sp|P02671| |
|
α-1-antichymotrypsin | 0.9855 | sp|P01011| |
| Neurosecretory
protein VGF | 1.0510 | sp|015240| |
|
α-2-HS-glycoprotein | 1.0036 | sp|P02765| |
| Angiotensinogen | 1.0014 | sp|P01019| |
| Ig α1 chain C
region | 1.0096 | sp|P01876| |
| Collagen α-1(I)
chain | 1.0412 | sp|P02452| |
| Plasminogen | 0.8738 | sp|P00747| |
| Kininogen-1 | 0.8529 | sp|P01042| |
| Fibulin-1 | 0.9324 | sp|P23142| |
| Hemoglobin subunit
β | 1.4623 | sp|P68871| |
| Prostaglandin-H2
D-isomerase | 0.9310 | sp|P41222| |
|
N-acetyllactosaminide
β-1,3-N-acetylglucosaminyltransferase | 1.0294 | sp|O43505| |
| Neuronal pentraxin
receptor | 1.0815 | sp|O95502| |
| Hemopexin | 0.8432 | sp|P02790| |
| Retinol-binding
protein 4 | 0.9796 | sp|P02753| |
| Apolipoprotein
D | 0.9616 | sp|P05090| |
| Ectonucleotide
pyrophosphatase/phosphodiesterase family member 2 | 0.9689 | sp|Q13822| |
| β-2-glycoprotein
1 | 0.9413 | sp|P02749| |
| Carboxypeptidase
E | 1.0193 | sp|P16870| |
| Collagen α-2(I)
chain | 1.0000 | sp|P08123| |
| Calsyntenin-1 | 1.1224 | sp|O94985| |
| Vitronectin | 0.8401 | sp|P04004| |
| Nucleobindin-1 | 1.0513 | sp|Q02818| |
| Ig µ chain C
region | 0.8467 | sp|P01871| |
| Ig κ chain C
region | 1.0135 | sp|P01834| |
| Ig γ3 chain C
region | 0.9289 | sp|P01860| |
| Extracellular
superoxide dismutase (Cu-Zn) | 1.0356 | sp|P08294| |
| Cathepsin D | 0.9478 | sp|P07339| |
| Afamin | 1.0176 | sp|P43652| |
| Complement
component C7 | 0.9460 | sp|P10643| |
| Apolipoprotein
A-II | 1.2524 | sp|P02652| |
| Contactin-2 | 1.0433 | sp|Q02246| |
| Inter-α-trypsin
inhibitor heavy chain | 1.0549 | sp|Q14624| |
| Neural cell
adhesion molecule 1 | 1.0091 | sp|P13591| |
| EGF-containing
fibulin-like extracellular matrix protein | 0.9392 | sp|Q12805| |
| Ig λ chain C
regions | 1.0045 | sp|P01842| |
| Complement
component C9 | 0.7597 | sp|P02748| |
| Neural cell
adhesion molecule L1-like protein | 1.0405 | sp|O00533| |
| Procollagen
C-endopeptidase enhancer 1 | 1.0410 | sp|Q15113| |
| Mimecan | 0.9845 | sp|P20774| |
| Fibrinogen β
chain | 1.0713 | sp|P02675| |
| Hemoglobin subunit
α | 1.5451 | sp|P69905| |
| ProSAAS | 1.0492 | sp|Q9UHG2| |
| Neuronal
pentraxin-1 | 1.1167 | sp|Q15818| |
|
β-2-microglobulin | 1.0138 | sp|P61769| |
| Collagen α-1(VI)
chain | 1.0602 | sp|P12109| |
| Neural cell
adhesion molecule 2 | 0.9561 | sp|O15394| |
| Leucine-rich
α-2-glycoprotein | 0.6430 | sp|P02750| |
| Insulin-like growth
factor-binding protein 2 | 0.9574 | sp|P18065| |
| Insulin-like growth
factor-binding protein 6 | 0.9883 | sp|P24592| |
| Protein kinase
C-binding protein NELL2 | 0.9929 | sp|Q99435| |
| Keratin, type II
cytoskeletal 1 | 0.9729 | sp|P04264| |
| Dickkopf-related
protein 3 | 1.0396 | sp|Q9UBP4| |
| Ig κ chain V–III
region | 0.9945 | sp|P01623| |
| Complement C1r
subcomponent | 0.9240 | sp|P00736| |
| Prothrombin | 0.9113 | sp|P00734| |
| Dystroglycan | 1.0292 | sp|Q14118| |
| Tetranectin | 0.9282 | sp|P05452| |
|
α-2-antiplasmin | 0.9126 | sp|P08697| |
| Complement factor
B | 0.8143 | sp|P00751| |
| Cartilage acidic
protein 1 | 1.0590 | sp|Q9NQ79| |
| Peptidylglycine
α-amidating monooxygenase | 0.8763 | sp|P19021| |
| Major prion
protein | 1.0478 | sp|P04156| |
|
Zinc-α-2-glycoprotein | 0.7912 | sp|P25311| |
| Neuroendocrine
protein 7B2 | 1.1447 | sp|P05408| |
| Multiple epidermal
growth factor-like domains 8 | 0.9706 | sp|Q7Z7M0| |
| Insulin-like growth
factor-binding protein 7 | 1.0327 | sp|Q16270| |
| SPARC | 0.8425 | sp|P09486| |
| Trypsin-1 | 1.2077 | sp|P07477| |
|
Secretogranin-2 | 0.9307 | sp|P13521| |
| Voltage-dependent
calcium channel subunit α2δ-1 | 0.9343 | sp|P54289| |
| Pyruvate kinase
isozymes M1/M2 | 1.0611 | sp|P14618| |
| Cadherin 13 | 1.0163 | sp|P55290| |
| GM2 Ganglioside
activator | 1.0083 | sp|P17900| |
| Fibrinogen γ
chain | 1.0925 | sp|P02679| |
| Extracellular
matrix protein 1 | 1.0849 | sp|Q16610| |
| Collagen α-1(XVIII)
chain | 1.0000 | sp|P39060| |
| Cadherin-2 | 1.0560 | sp|P19022| |
| Semaphorin 7A | 0.9433 | sp|O75326| |
| Ig κ chain V–II
region GM607 | 0.9526 | sp|P06309| |
| Ig λ chain V–III
region LOI | 0.7060 | sp|P01617| |
| Transmembrane
protein 132A | 1.1680 | sp|Q24JP5| |
| Metalloproteinase
inhibitor 2 | 0.9855 | sp|P16035| |
| Osteopontin | 1.0354 | sp|P10451| |
| Kallikrein-6 | 0.9713 | sp|Q92876| |
| Sex hormone-binding
globulin | 0.6051 | sp|P04278| |
| Actin, cytoplasmic
1 | 0.8566 | sp|P60709| |
| Ig γ-4 chain C
region | 1.1808 | sp|P01861| |
| Protein FAM3C | 0.9182 | sp|Q92520| |
| Chorionic
somatomammotropin hormone | 0.5234 | sp|P01243| |
| Keratin, type I
cytoskeletal 9 | 0.9161 | sp|P35527| |
| Limbic
system-associated membrane protein | 0.9398 | sp|Q13449| |
| Phospholipid
transfer protein | 1.1687 | sp|P55058| |
| Ig heavy chain
V–III region BRO | 0.9650 | sp|P01766| |
| SPARC-like protein
1 | 0.9325 | sp|Q14515| |
|
Fructose-bisphosphate aldolase | 0.9490 | sp|P04075| |
|
N-acetylmuramoyl-L-alanine
amidase | 0.9820 | sp|Q96PD5| |
| Complement C1s
subcomponent | 0.9598 | sp|P09871| |
| Ig κ chain V–IV
region B17 | 0.8581 | sp|P06314| |
| Lumican | 1.0259 | sp|P51884| |
| Opioid-binding
protein/cell adhesion molecule | 0.8758 | sp|Q14982| |
| Ribonuclease
pancreatic | 0.7527 | sp|P07998| |
| Ig κ chain V–III
region CLL | 0.8486 | sp|P04207| |
| Immunoglobulin
superfamily member 8 | 0.8751 | sp|Q969P0| |
| 78-kDa
glucose-regulated protein | 0.9751 | sp|P11021| |
| Protein AMBP | 0.7950 | sp|P02760| |
| Coagulation factor
V | 1.0938 | sp|P12259| |
| Histidine-rich
glycoprotein | 0.9048 | sp|P04196| |
| Ig heavy chain
V–III region KOL | 0.9839 | sp|P01772| |
| L-lactate
dehydrogenase B chain | 0.9649 | sp|P07195| |
| Complement
component C6 | 0.9164 | sp|P13671| |
| Ephrin type-A
receptor 4 | 0.9178 | sp|P54764| |
| Cerebellin-3 | 1.0609 | sp|Q6UW01| |
| Proenkephalin
A | 1.0079 | sp|P01210| |
| Insulin like growth
factor binding protein 4 | 0.8461 | sp|P22692| |
| Apolipoprotein
C-III | 1.1181 | sp|P02656| |
| Trypsin −3 | 1.1478 | sp|P35030| |
| Transforming growth
factor-β-induced protein ig-h3 | 1.0709 | sp|Q15582| |
| IgG Fc-binding
protein | 1.0775 | sp|Q9Y6R7| |
| Plasma serine
protease inhibitor | 0.9604 | sp|P05154| |
| Coagulation factor
XII | 0.9422 | sp|P00748| |
| Biotinidase | 1.2970 | sp|P43251| |
| Ig κ chain V–III
region VG (Fragment) | 1.09987 | sp|P04433| |
| Collagen α-3(VI)
chain | 0.9422 | sp|P00748| |
| Neuroserpin | 1.0459 | sp|Q99574| |
|
| Keratin, type I
cytoskeletal 10 | 0.8858 | sp|P13645| |
| Fibulin-5 | 0.9587 | sp|Q9UBX5| |
| Receptor-type
tyrosine-protein phosphatase S | 1.1670 | sp|Q13332| |
| Complement factor
I | 0.8627 | sp|P05156| |
|
| Ig heavy chain
V–III region TRO | 1.1189 | sp|P01762| |
| Basement
membrane-specific heparan sulfate proteoglycan core protein | 0.9080 | sp|P98160| |
| α-1 acid
glycoprotein 1 | 0.7355 | sp|P02763| |
| Chitinase-3-like
protein 1 | 0.9904 | sp|P36222| |
| Cell adhesion
molecule 3 | 0.8572 | sp|Q8N126| |
| Galectin-3-binding
protein | 0.9876 | sp|Q08380| |
| Ig heavy chain
V–III region POM | 1.0712 | sp|P01774| |
| Endonuclease
domain-containing 1 protein | 1.0166 | sp|P01776| |
| Ig λ chain V–I
region HA | 1.0838 | sp|P01779| |
| Complement C1q
subcomponent subunit B | 1.0301 | sp|P02746| |
| Leucine-rich
repeat-containing protein 4B | 1.0174 | sp|Q9NT99| |
|
Peroxiredoxin-2 | 1.6278 | sp|P32119| |
|
Glyceraldehyde-3-phosphate
dehydrogenase | 1.2506 | sp|P04406| |
| Serum
paraoxonase/arylesterase 1 | 0.8635 | sp|P27169| |
|
Calcium/calmodulin-dependent protein
kinase type II α chain | 1.1677 | sp|Q9UQM7| |
| Fibrillin-1 | 0.2204 | sp|P35555| |
| Complement C2 | 0.9405 | sp|P06681| |
| Cell growth
regulator with EF hand domain protein 1 | 1.3740 | sp|Q99674| |
| Myopalladin | 0.6801 | sp|Q86TC9| |
| Neuronal growth
regulator 1 | 1.0667 | sp|Q7Z3B1| |
| Serum amyloid A-4
protein | 1.0645 | sp|P35542| |
| Protocadherin Fat
2 | 1.1409 | sp|Q9NYQ8| |
| Cathepsin F | 1.1142 | sp|Q9UBX1| |
| DNA repair protein
RAD50 | 0.9463 | sp|Q92878| |
| α-enolase | 1.1591 | sp|P06733| |
| Insulin-like growth
factor II | 0.4053 | sp|P01344| |
| Ig λ chain V–III
region SH | 1.0399 | sp|P01714 |
| Reelin | 1.1149 | sp|P78509| |
| Pregnancy-specific
β-1-glycoprotein 1 | 0.7522 | sp|P11464| |
| Retinoic acid
receptor responder protein 2 | 1.0850 | sp|Q99969| |
| Lymphocyte antigen
6H | 1.0322 | sp|O94772| |
| Receptor-type
tyrosine-protein phosphatase N2 | 1.0020 | sp|Q92932| |
| Multimerin-2 | 1.0029 | sp|Q9H8L6| |
| Apolipoprotein
L1 | 0.9537 | sp|O14791| |
| Ig κ chain V–I
region Roy | a | sp|P01608| |
| Neurofascin | 1.0305 | sp|O94856| |
| V-type proton
ATPase | 0.8780 | sp|Q15904| |
|
| Heparin cofactor
2 | 1.0087 | sp|P05546| |
| Plasma glutamate
carboxypeptidase | 1.0663 | sp|Q9Y646| |
| Hypoxia upregulated
protein 1 | 1.0213 | sp|Q9Y4L1| |
| Ig κ chain V–I
region Ka | 0.9834 | sp|P01603| |
| Protein DJ-1 | 1.2886 | sp|Q99497| |
| Laminin subunit
γ-1 | 0.8128 | sp|P11047| |
| Cell surface
glycoprotein MUC18 | 0.7681 | sp|P43121| |
| Neuroendocrine
convertase 2 | 1.2290 | sp|P16519| |
| Inter-α-trypsin
inhibitor heavy chain H5 | 0.9165 | sp|Q86UX2| |
| Exostosin-like
2 | 0.9342 | sp|Q9UBQ6| |
| Metalloproteinase
inhibitor 1 | 1.0673 | sp|P01033| |
| Immunoglobulin J
chain | 1.0429 | sp|P01591| |
| Ig κ chain V–I
region BAN | a | sp|P04430| |
| Ig κ chain V–I
region DEE | 1.0241 | sp|P01597| |
| Ig κ chain V–I
region Wes | 0.8814 | sp|P01611| |
| Serum amyloid A-1
protein | 0.6516 | sp|P02735| |
| Glutamate receptor
4 | 1.3098 | sp|P48058| |
| Amyloid β A4 | 1.0164 | sp|P05067| |
| Zinc finger
protein | 0.9751 | sp|B1APH4| |
| Nidogen-2 | 1.0441 | sp|Q14112| |
| 72-kDa type IV
collagenase | 0.8378 | sp|P08253| |
| WAP, kazal,
immunoglobulin, Kunitz and NTR domain-containing protein 2 | 1.0204 | sp|Q8TEU8| |
| Kallistatin | 0.8933 | sp|P29622| |
| 45-kDa
calcium-binding protein | 1.0575 | sp|Q9BRK5| |
| Tissue
α-L-fucosidase | 1.1211 | sp|P04066| |
| protein Cut A | 1.0521 | sp|O60888| |
| Ig heavy chain V–I
region | 0.9126 | sp|P06326| |
| Ig heavy chain V–I
region | 0.9126 | sp|P06326| |
| γ-glutamyl
hydrolase | 1.2209 | sp|Q92820| |
| Complement
component C8 γ chain | 0.9202 | sp|P07360| |
|
Phosphatidylethanolamine-binding protein
1 | 1.1293 | sp|P30086| |
| Thy-1 membrane
glycoprotein | 0.7535 | sp|P04216| |
| Cell adhesion
molecule 4 | 0.9868 | sp|Q8NFZ8| |
| Sjoegren
syndrome/scleroderma autoantigen 1 | 0.9615 | sp|O60232| |
| Uncharacterized
protein C6orf170 | 1.1061 | sp|Q96NH3| |
|
N-acetylglucosamine-1-phosphotransferase
subunit γ | 1.0938 | sp|Q9UJJ9| |
| Testican-2 | 1.2140 | sp|Q92563| |
|
Fructose-bisphosphate aldolase C | a | sp|P09972| |
| Lysozyme C | 0.8222 | sp|P61626| |
| V-type proton
ATPase subunit D | 1.2915 | sp|Q9Y5K8| |
| Coagulation factor
XI | a | sp|P03951| |
| Complement C1q
subcomponent subunit C | 0.8441 | sp|02747| |
| Dermcidin | 0.7257 | sp|P81605| |
| Ig κ chain V–II
region RPMI 6410 | 0.7960 | sp|P06310| |
| Hemoglobin subunit
δ | a | sp|P06310| |
| Titin | 0.9960 | sp|Q8WZ42| |
| Tumor protein
63 | 0.7445 | sp|Q9H3D4| |
| Cysteine-rich with
EGF-like domain protein 1 | 1.0219 | sp|Q96HD1| |
| Putative
α-1-antitrypsin-related protein | 0.8877 | sp|P20848| |
| Scrapie-responsive
protein 1 | 1.0576 | sp|O75711| |
Analyses of differential protein
expression
A total of 35 differentially-expressed proteins were
compared between the ALS and NC groups; of these, 14 were
upregulated and 21 were downregulated (Tables III and IV). These proteins had a ProtScore between
the values of >1.2 and <0.8, corresponding to P<0.05.
| Table III.Proteins decreased in ALS group. |
Table III.
Proteins decreased in ALS group.
| Protein | Ratio of ALS vs.
control | Accession no. |
|---|
| α-1-antitrypsin
α1 | 0.7250 | sp|P01009| |
| Haptoglobin | 0.6926 | sp|P00738| |
| Complement
component 9 | 0.7597 | sp|P02748| |
| Leucine-rich
α-2-glycoprotein | 0.6430 | sp|P02750| |
|
Zinc-α-2-glycoprotein | 0.7912 | sp|P25311| |
| Sex hormone-binding
globulin | 0.6051 | sp|P04278| |
| Chorionic
somatomammotropin hormone 1 | 0.5234 | sp|P01243| |
| Ribonuclease
pancreatic | 0.7527 | sp|P07998| |
| Protein AMBP | 0.7950 | sp|P02760| |
| α-1-acid
glycoprotein 1 | 0.7355 | sp|P02763| |
| Fibrillin-1 | 0.2204 | sp|P35555| |
| Myopalladin | 0.6801 | sp|Q86TC9| |
| Insulin-like growth
factor II | 0.4053 | sp|P01344| |
| Pregnancy-specific
β-1-glycoprotein 1 | 0.7522 | sp|P43251| |
| Cell surface
glycoprotein MUC18 | 0.7681 | sp|P43121| |
| Serum amyloid A
protein | 0.6516 | sp|P02735| |
| Thy-1 membrane
glycoprotein | 0.7535 | sp|P04216| |
| Dermcidin | 0.7257 | sp|P81605| |
| Ig λ chain V–III
region LOI | 0.7060 | sp|P01617| |
| Ig κ chain V–II
region RPMI 6410 | 0.7960 | sp|P06310| |
| Tumor protein
63 | 0.7444 | sp|Q9H3D4| |
| Table IV.Increased proteins in ALS group. |
Table IV.
Increased proteins in ALS group.
| Protein | Ratio of ALS vs.
control | Accession no. |
|---|
|
Peroxiredoxin-2 | 1.6278 | sp|P32119| |
| Glutamate receptor
4 | 1.3097 | sp|P02735| |
| Apolipoprotein
A-II | 1.2523 | sp|P48058| |
| Hemoglobin subunit
α | 1.5451 | sp|P69905| |
| Trypsin-1 | 1.2076 | sp|P69905| |
| Biotinidase | 1.2970 | sp|P43251| |
| Hemoglobin subunit
β | 1.4623 | sp|P68871| |
|
Glyceraldehyde-3-phosphate
dehydrogenase | 1.2505 | sp|P04406| |
| Cell growth
regulator with EF hand domain protein 1 | 1.3748 | sp|Q99674| |
| Protein DJ-1 | 1.2886 | sp|Q99497| |
| Neuroendocrine
convertase 2 | 1.2294 | sp|P16519| |
| γ-glutamyl
hydrolase | 1.2209 | sp|Q92820| |
| Testican-2 | 1.2140 | sp|Q92563| |
| V-type proton
ATPase subunit D | 1.2915 | sp|Q9Y5K8| |
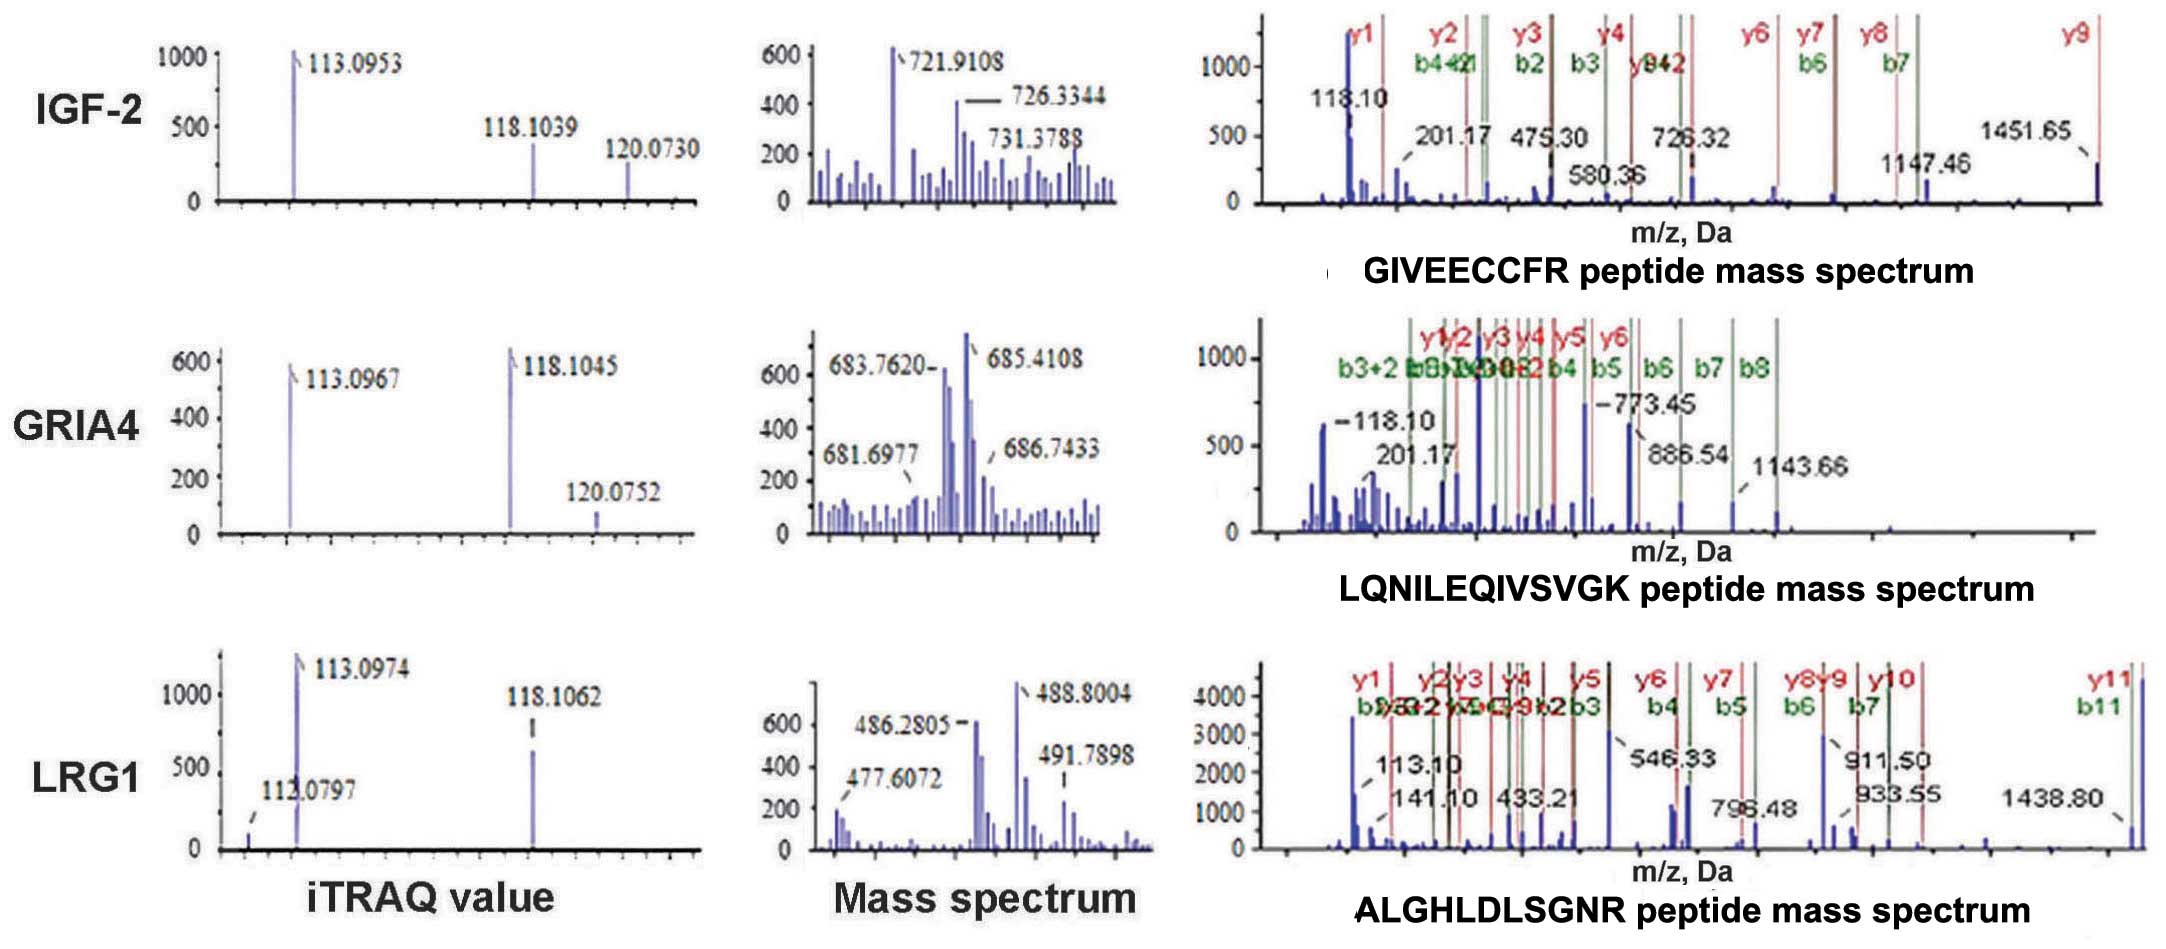
Sample data of specific
differentially-expressed proteins
IGF-2 and LRG1 protein expression was decreased in
the experimental groups, whereas GRIA4 expression was increased
(Fig. 1).
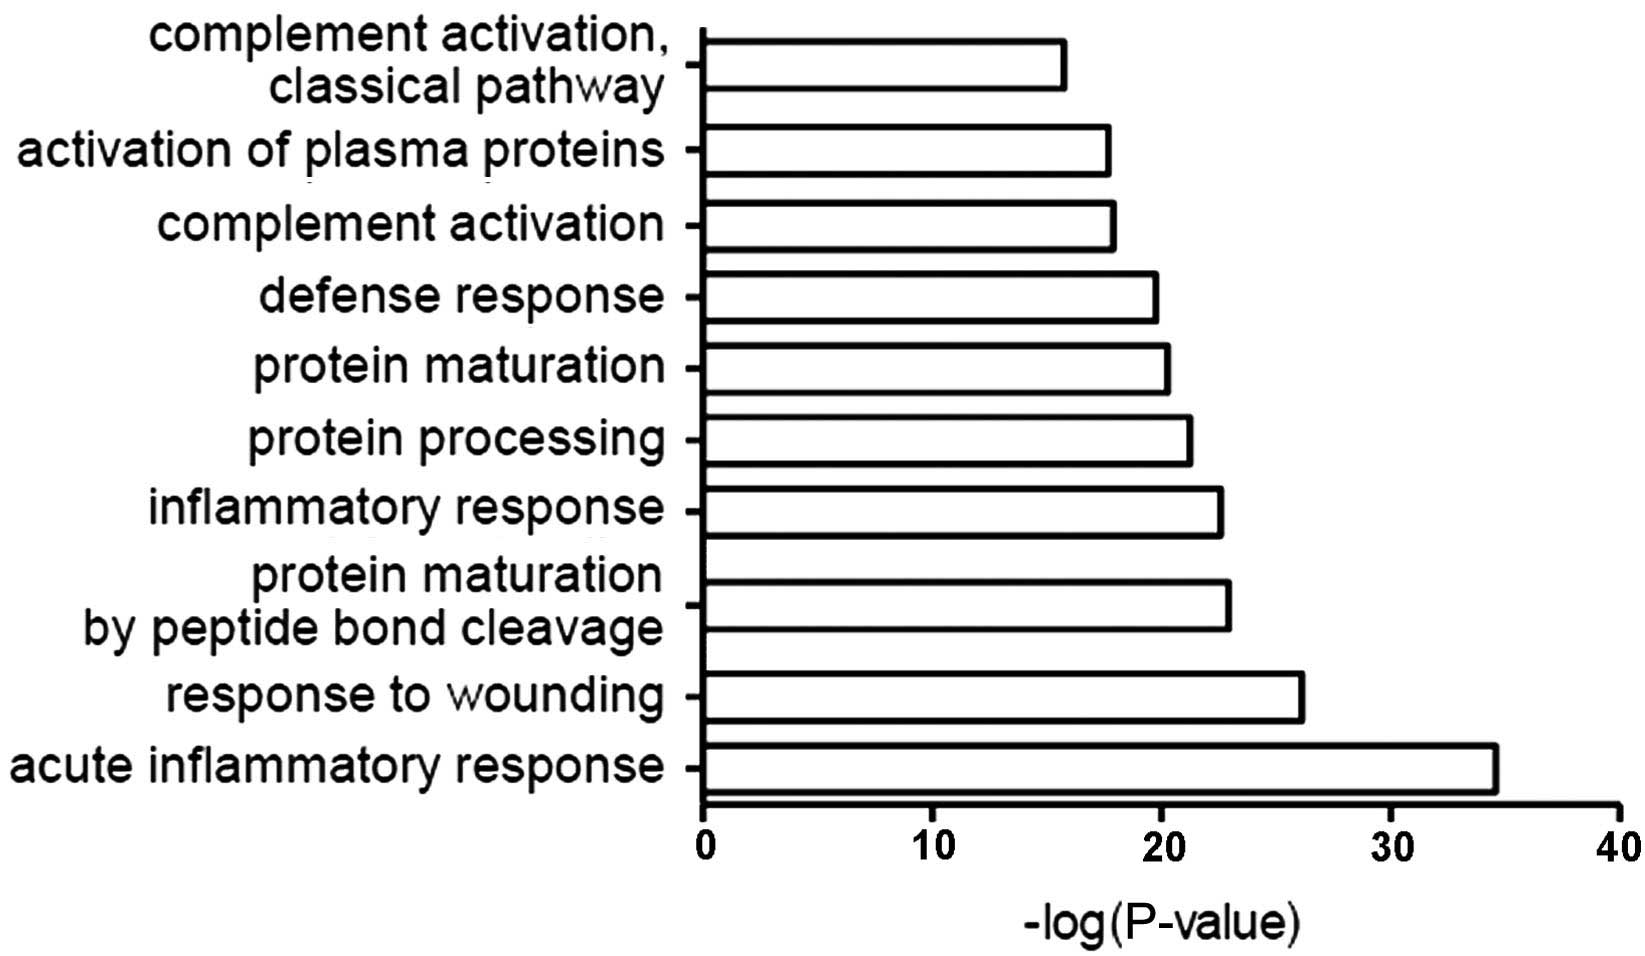
DAVID results and the classification
of proteins by biological role
The function of all identified proteins was analyzed
using GO in conjunction with DAVID software. The most common
biological roles of CSF proteins were in acute inflammation, damage
response, protein maturation, inflammation, defense response,
complement activation and other associated immune pathways
(Fig. 2).
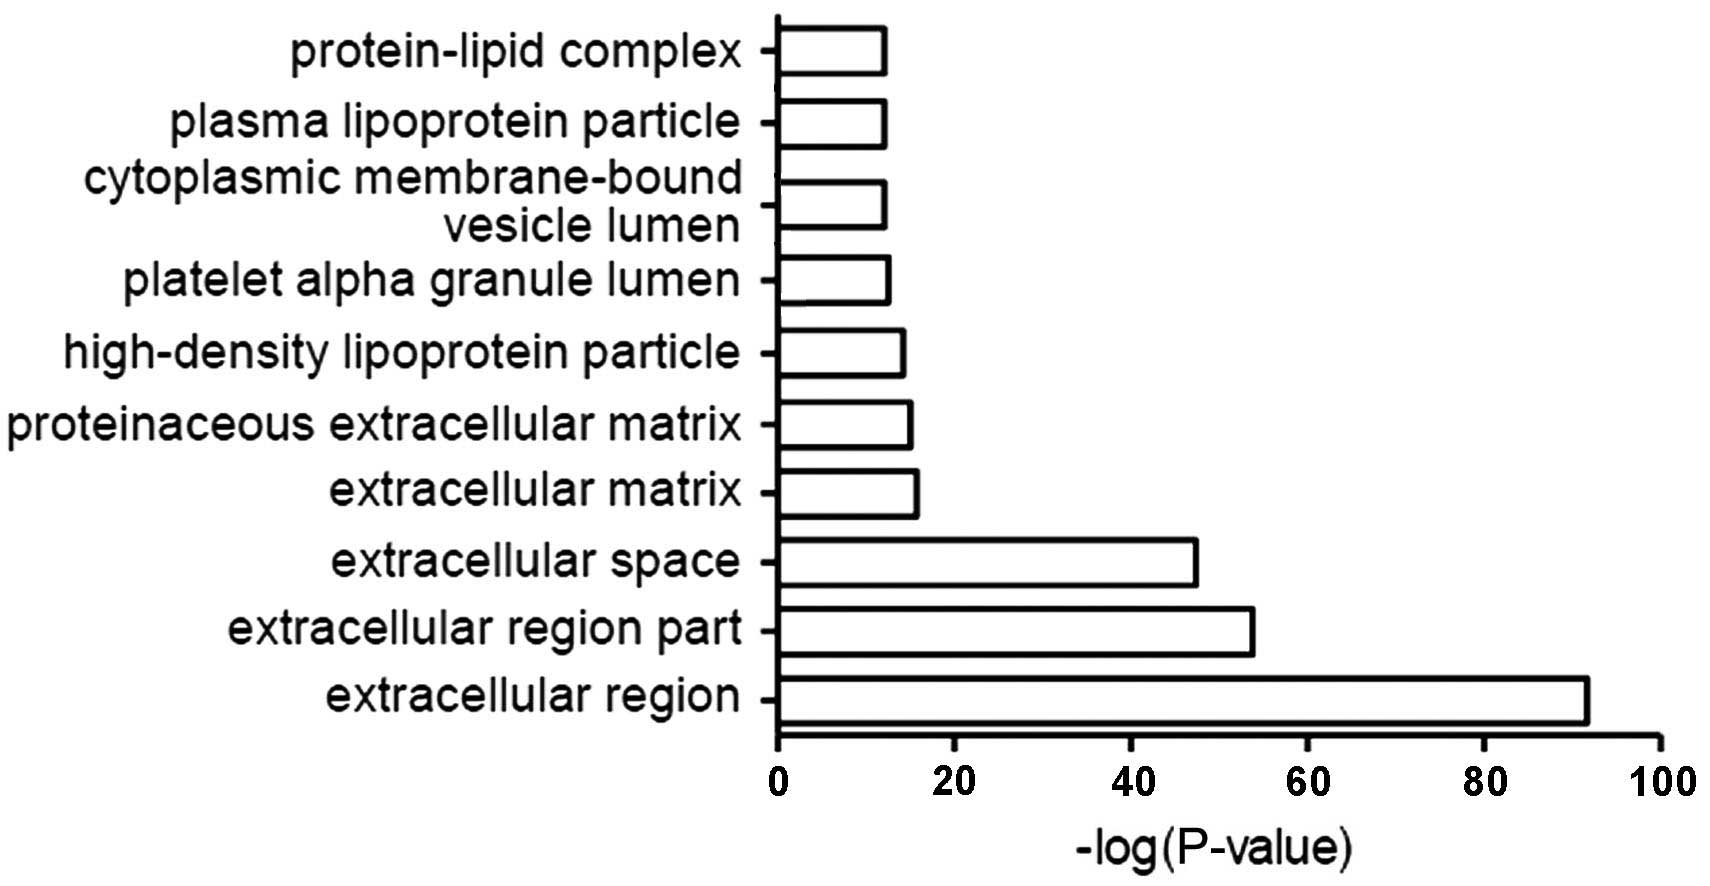
Classification by cellular
localization
The most common localization of CSF proteins
relative to cells included the extracellular domain, extracellular
space, extracellular matrix and protein-lipid complexes (Fig. 3).
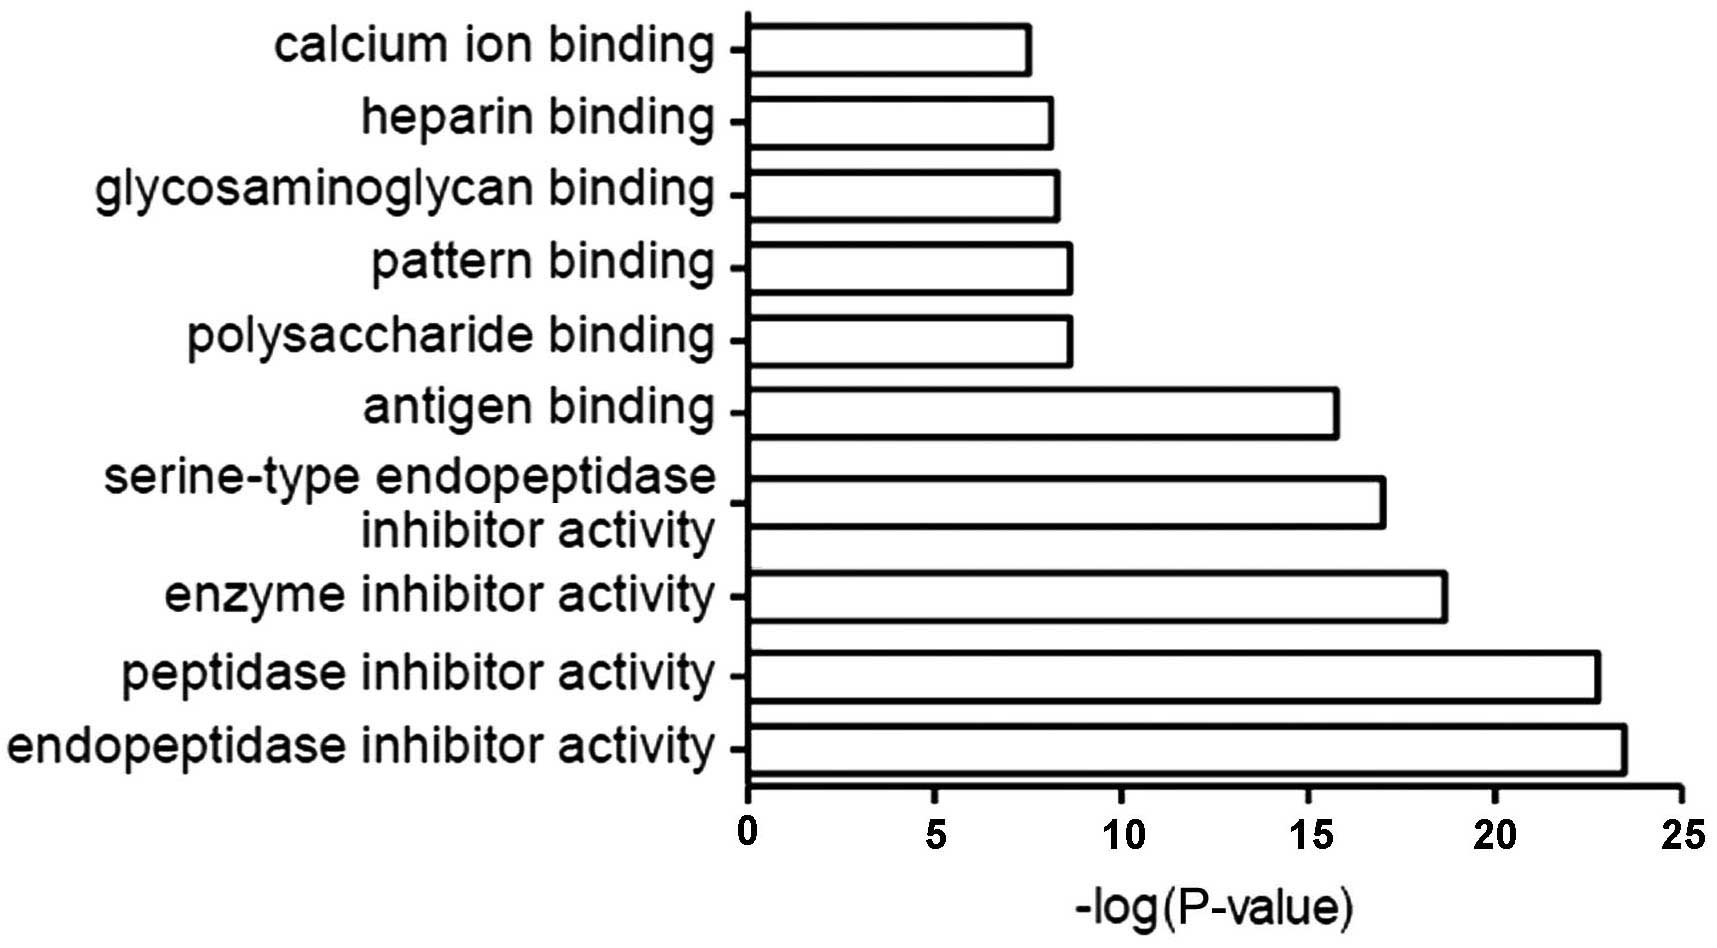
Classification by molecular
function
The most common molecular functions of CSF proteins
were endopeptidase, peptidase, enzyme and serine-type endopeptidase
inhibitors, and antigen-, calcium- and heparin-binding proteins
(Fig. 4).
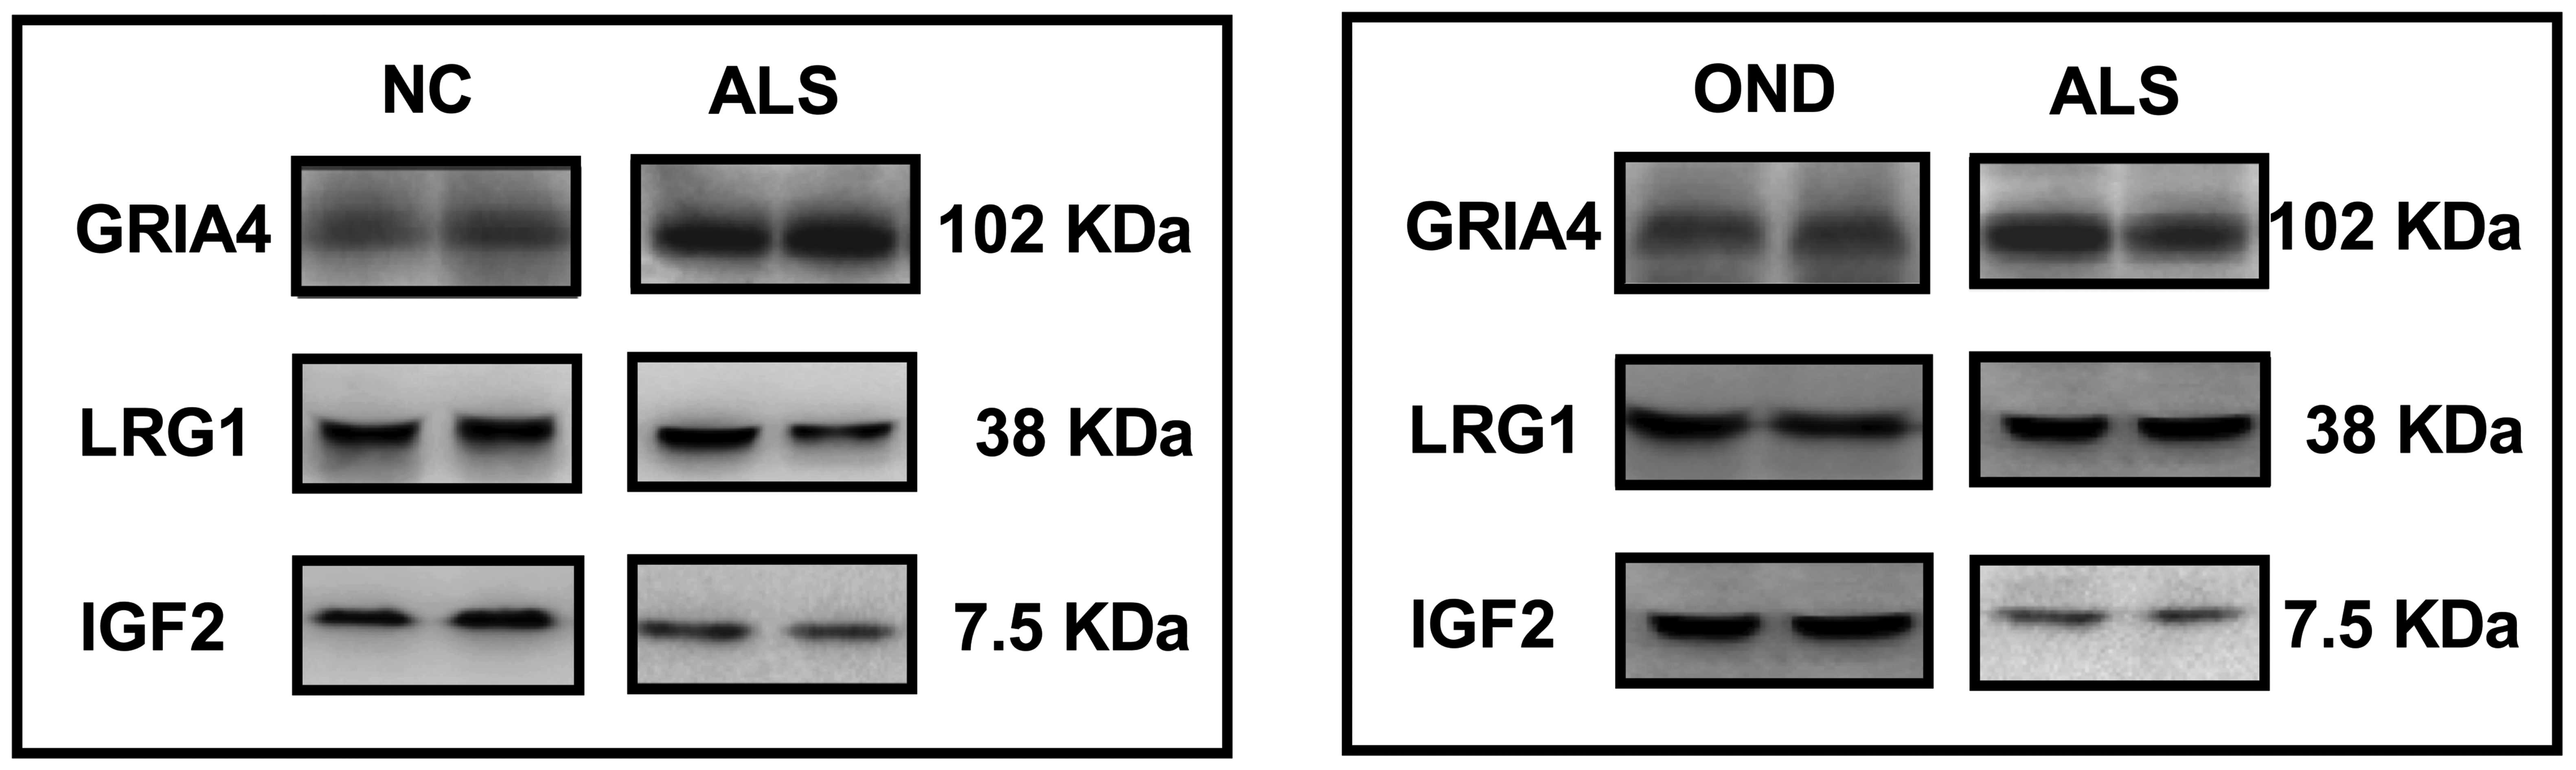
Western blotting
A total of 3 candidate proteins were randomly
selected to be examined by western blot analysis in the ALS and the
NC groups (Fig. 5); of these, IGF-2
was revealed to be significantly downregulated and GRIA4 was
significantly upregulated in the ALS group when compared with the
normal control group (P<0.05; Table
V), but LRG1 expression was not significantly altered (P=0.224;
Table V). These proteins were also
examined by western blot analysis in the ALS-A and OND groups,
again demonstrating a significant downregulation of IGF-2 and a
significant upregulation of GRIA4 in the ALS group compared with
the OND group (P<0.01; Table
VI), but no significant difference in LRG1 expression between
these groups (P=0.196; Table
VI).
| Table V.Western blotting results of ALS-B and
NC groups. |
Table V.
Western blotting results of ALS-B and
NC groups.
| Protein | Molecular weight,
KDa | ALS group
(n=10) | NC group
(n=10) | P-value |
|---|
| IGF-2 | 7.5 | 225700±126090 | 436857±212550 | 0.017a |
| GRIA4 | 102 | 715730±432220 | 305796±130600 | 0.016a |
| LRG1 | 38 | 1278000±702040 |
1807000±1115500 | 0.224 |
| Table VI.Western blotting results of ALS-A and
OND groups. |
Table VI.
Western blotting results of ALS-A and
OND groups.
| Protein | ALS group
(n=35) | OND group
(n=18) | P-value |
|---|
| IGF-2 | 222200±123648 | 452500±255620 | 0.002a |
| GRIA4 | 608502±519012 | 200100±150810 | 0.002a |
| LRG1 | 1097255±961025 | 746070±703690 | 0.196 |
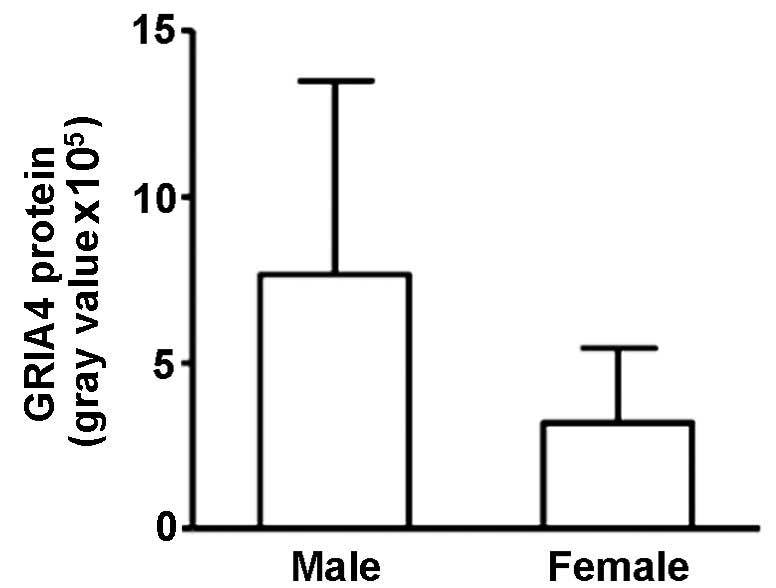
Correlation between GRIA4 and
gender
GRIA4 expression in the ALS-A group was
significantly higher in male patients than in female patients
(765,483±583,227 and 319,766±224,242, respectively; r=−0.574;
P=0.003; Fig. 6).
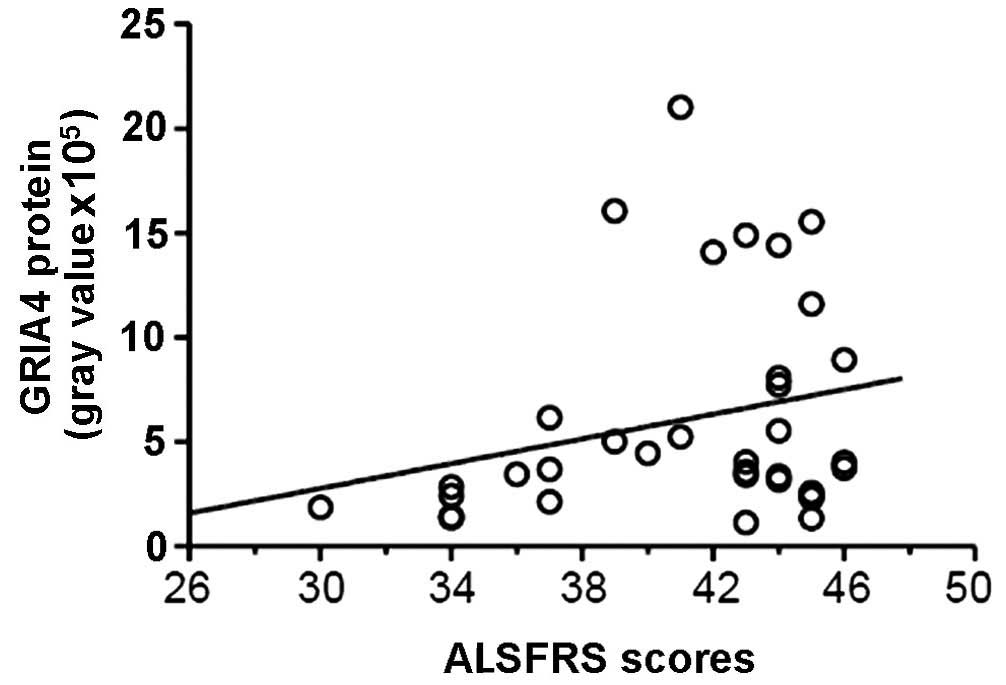
GRIA4 expression in the ALS-A group was also
positively correlated with ALS clinical scores (r=0.487; P=0.017),
indicating a negative correlation with clinical severity (Fig. 7).
Discussion
In the present study, 248 different low-abundance
proteins were identified in human CSF and the details of these
proteins were established in ALS patients. All proteins were
subjected to GO analysis with DAVID software and were classified
according to their involvement in biological processes, their
cellular localization and their molecular function. Data indicated
that the primary roles of these proteins were in the acute
inflammatory response and injury response, that the proteins were
predominantly localized to extracellular regions and that the
majority of these proteins were endopeptidase and peptidase
inhibitors. These data aid the understanding of CSF protein
profiles in patients with ALS, and provide possible biomarkers of
the disease. A screening of 35 of these proteins revealed
significant differences in protein expression between the ALS and
NC groups, primarily in inflammation-associated proteins,
neurotrophic factors and signal transduction proteins.
IGF-2, GRIA4 and LRG1 were randomly selected to
verify their differential expression in ALS patients using western
blot analysis. Consistent with the results of the proteomic
analysis, IGF-2 and GRIA4 expression was altered in the CSF of ALS
patients, but there was no significant difference in LRG1
expression between the ALS and NC groups; this led to the
conclusion that additional verification of the altered protein
expression reported in the present study is necessary to confirm
these proteomic results.
To confirm the expression specificity of IGF-2,
GRIA4 and LRG1, expression levels of these proteins were compared
in patients with ALS and patients with OND; IGF-2 expression was
significantly decreased, but GRIA4 expression was significantly
increased.
Alterations to protein expression are complex with
regard to disease progression, age, gender and duration of illness;
it was thus important to examine the correlation between
alterations to protein expression and clinical features. Clinical
data of 35 ALS patients was collected and were subjected to
multiple linear regression analysis to reveal any confounding
factors.
The clinical data in the present study revealed a
higher male incidence of ALS (male to female ratio, 1.7:1), which
was in support of a previous study; the 2009 European
epidemiological study revealed a similar ratio of 1.4:1 (10). The present results demonstrated a
correlation of GRIA4 expression with gender; male GRIA4 levels were
2.5-fold those of female levels (P<0.01).
To the best of our knowledge, the association
between glutamate receptor levels and clinical characteristics has
not been studied; however, glutamate excitotoxicity damage is
widely recognized in the pathogenesis of ALS. Fiszman et al
(11) reported no significant
correlation between glutamate ligand concentration in the CSF of
patients with different severities of ALS, suggesting that
glutamate is involved in the occurrence of ALS and not in the
severity of the disease. Excitotoxicity of glutamate also requires
the presence of a glutamate receptor, meaning that high expression
of glutamate receptors may be responsible for the neuronal toxicity
injury induced by glutamate. As the concentration of glutamate is
increased in the CSF of ALS patients (11), and GRIA4 expression was increased in
ALS in the current study, the high incidence of ALS may be
associated with the expression of GRIA4.
In the present study, the ALS score was estimated
using the ALSFRS-R scale; a lower score on this scale corresponded
to more severe disease. A multivariate analysis indicated that
GRIA4 expression was positively correlated with the ALS score,
revealing a negative correlation with the severity of the disease.
However, ALS patients with mild symptoms were selected, defined in
accordance with a previous scoring system attributing a score
>25 to less severe ALS and scores of <25 to moderate and
severe phases of ALS (12). As the
glutamate concentration is significantly increased in the CSF of
ALS patients (7), glutamate is
likely to be involved in the pathogenesis of the disease. From the
present results, it was concluded that GRIA4 expression is likely
to be involved in the pathogenesis of ALS, resulting in a negative
feedback regulatory mechanism to subsequently reduce its
expression. The glutamate receptor antagonist, riluzole, is
effective in the early treatment of ALS (13). In conjunction with the present report
suggesting the early-stage overexpression of GRIA4, these data
indicate that early treatment with anti-glutamate-associated drugs
may prove a useful therapeutic measure.
The multivariate analysis examining IGF-2 and LRG1
expression and the clinical data revealed no significant
correlations. This may be attributable to the sample size of the
present study being too small or too few clinical factors being
included. Based on the standard deviation values, the expression
levels of IGF-2 and LRG1 were relatively balanced, as compared with
the standard deviation of the GRIA4 expression levels, which
suggested that IGF-2 may be a valuable biomarker of ALS with higher
credibility due to fewer interference factors.
In summary, GRIA4 expression varied based on gender
and may be reflective of ALS severity, providing a meaningful
reference value for the timing of treatment. Furthermore, IGF-2 may
prove an effective diagnostic marker of ALS.
Acknowledgements
The present study was supported by the Scientific
Research Foundation of Huashan Hospital, Fudan University (Dr Yan
Chen; 2007). The authors would like to thank staff from the
Institute of Biomedical Science (Fudan University, Shanghai, China)
for providing technical support.
References
|
1
|
Corbo M, Lunetta C, Magni P, Dozio E,
Ruscica M, Adobbati L and Silani V: Free insulin-like growth factor
(IGF)-1 and IGF-binding proteins-2 and −3 in serum and
cerebrospinal fluid of amyotrophic lateral sclerosis patients. Eur
J Neurol. 17:398–404. 2010. View Article : Google Scholar : PubMed/NCBI
|
|
2
|
Devos D, Moreau C, Lassalle P, Perez T, De
Seze J, Brunaud-Danel V, Destée A, Tonnel AB and Just N: Low levels
of the vascular endothelial growth factor in CSF from early ALS
patients. Neurology. 62:2127–2129. 2004. View Article : Google Scholar : PubMed/NCBI
|
|
3
|
Kasai T, Tokuda T, Ishigami N, Sasayama H,
Foulds P, Mitchell DJ, Mann DM, Allsop D and Nakagawa M: Increased
TDP-43 protein in cerebrospinal fluid of patients with amyotrophic
lateral sclerosis. Acta Neuropathol. 117:55–62. 2009. View Article : Google Scholar : PubMed/NCBI
|
|
4
|
Nagata T, Nagano I, Shiote M, Narai H,
Murakami T, Hayashi T, Shoji M and Abe K: Elevation of MCP-1 and
MCP-1/VEGF ratio in cerebrospinal fluid of amyotrophic lateral
sclerosis patients. Neurol Res. 29:772–776. 2007. View Article : Google Scholar : PubMed/NCBI
|
|
5
|
Zhang J, Goodlett DR, Quinn JF, Peskind E,
Kaye JA, Zhou Y, Pan C, Yi E, Eng J, Wang Q, et al: Quantitative
proteomics of cerebrospinal fluid from patients with Alzheimer
disease. J Alzheimers Dis. 7:125–133; discussion 173–180.
2005.PubMed/NCBI
|
|
6
|
Jin J, Meredith GE, Chen L, Zhou Y, Xu J,
Shie FS, Lockhart P and Zhang J: Quantitative proteomic analysis of
mitochondrial proteins: Relevance to Lewy body formation and
Parkinson's disease. Brain Res Mol Brain Res. 134:119–138. 2005.
View Article : Google Scholar : PubMed/NCBI
|
|
7
|
Ranganathan S, Williams E, Ganchev P,
Gopalakrishnan V, Lacomis D, Urbinelli L, Newhal K, Cudkowicz ME,
Brown RH Jr and Bowser R: Proteomic profiling of cerebrospinal
fluid identifies biomarkers for amyotrophic lateral sclerosis. J
Neurochem. 95:1461–1471. 2005. View Article : Google Scholar : PubMed/NCBI
|
|
8
|
Ryberg H, An J, Darko S, Lustgarten JL,
Jaffa M, Gopalakrishnan V, Lacomis D, Cudkowicz M and Bowser R:
Discovery and verification of amyotrophic lateral sclerosis
biomarkers by proteomics. Muscle Nerve. 42:104–111. 2010.
View Article : Google Scholar : PubMed/NCBI
|
|
9
|
Ekegren T, Hanrieder J and Bergquist J:
Clinical perspectives of high-resolution mass spectrometry-based
proteomics in neuroscience: Exemplified in amyotrophic lateral
sclerosis biomarker discovery research. J Mass Spectrom.
43:559–571. 2008. View
Article : Google Scholar : PubMed/NCBI
|
|
10
|
Logroscino G, Traynor BJ, Hardiman O, Chiò
A, Mitchell D, Swingler RJ, Millul A, Benn E and Beghi E: EURALS:
Incidence of amyotrophic lateral sclerosis in Europe. J Neurol
Neurosurg Psychiatry. 81:385–390. 2009. View Article : Google Scholar : PubMed/NCBI
|
|
11
|
Fiszman ML, Ricart KC, Latini A, Rodríguez
G and Sica RE: In vitro neurotoxic properties and excitatory
aminoacids concentration in the cerebrospinal fluid of amyotrophic
lateral sclerosis patients. Relationship with the degree of
certainty of disease diagnoses. Acta Neurol Scand. 121:120–126.
2010. View Article : Google Scholar : PubMed/NCBI
|
|
12
|
Iłzecka J: Cerebrospinal fluid Flt3 ligand
level in patients with amyotrophic lateral sclerosis. Acta Neurol
Scand. 114:205–209. 2006. View Article : Google Scholar : PubMed/NCBI
|
|
13
|
Miller RG, Mitchell JD, Lyon M and Moore
DH: Riluzole for amyotrophic lateral sclerosis (ALS)/motor neuron
disease (MND). Cochrane Database Syst Rev.
1:CD0014472007.PubMed/NCBI
|