Introduction
Genotoxic substances are specific chemical or
physical agents, including viruses and hormones, that can damage
the genetic information within a cell, thereby inducing mutations
or cancer, and genotoxicity refers to the capacity of a chemical or
physical substance to damage genetic information. Although
genotoxicity differs from mutagenicity, the terms are often used
confusedly; all mutagens are genotoxic, however, not all genotoxic
substances are mutagenic. Mutagens induce direct or indirect damage
to DNA that leads to mutations, which are permanent and heritable
changes that can affect somatic cells to be transmitted onto future
generations (1). When DNA damage
occurs, a DNA damage response, including cell cycle arrest, DNA
repair and apoptosis, is induced in cells to suppress the induction
of mutation; however, this DNA damage may not always be processed
resulting in mutagenesis (2,3).
When evaluating genotoxic substances, scientists
test for DNA damage in cells with exposure to the toxic agents.
This DNA damage can be categorized as single- and double-strand
breaks, loss of excision repair, cross-linking, the formation of
alkali-labile sites, point mutations, and structural and numerical
chromosomal aberrations (4). The
loss of integrity of the genetic information can lead to cancer. To
evaluate the potential of chemicals to cause DNA damage, various
methods have been developed. Among these, the Ames assay, in
vitro and in vivo toxicology tests and the Comet assay
are widely used (5,6). The deleterious effect of the genotoxic
substance is DNA damage induced by interaction with the DNA
sequence and structure. On occasion, lesions within DNA under
oxidative stress conditions can lead to mutation, and the
accumulation of mutations can contribute to the development of
cancer (7).
Natural materials have received special attention as
a potential source of bioactive components in the pharmaceutical
industry (8). Although materials
such as herbs, medicinal plants and crude drug substances obtained
from them are generally accepted as being safe (9), it is important to evaluate natural
substances for mutagenicity. Evidence suggests that certain types
of foods may cause toxic, genotoxic or carcinogenic hazards for
humans (10). Contaminated foods are
known to show harmful effects, and certain food additives may have
mutagenic and/or carcinogenic potential (11). In addition, the cooking process may
generate carcinogenic compounds (12), and certain foods with natural
constituents may show mutagenic and/or carcinogenic toxicity
(13).
Persicariae Rhizoma (PR) is dried stem parts of
Persicaria tinctoria H. Gross (Polygonaceae), and has been
traditionally used as an anti-inflammatory and detoxification agent
in Korea (14). PR contains two
biologically active anti-inflammatory and antioxidative dyes,
namely purple indirubin and blue indigo (15). Indirubin, a 3,2′-bisindole isomer of
indigo, was first identified as the active ingredient of a
traditional Chinese medicine preparation, Danggui Longhui Wan,
which is used to treat various chronic diseases (16). Indirubin derivatives exhibit strong
anti-inflammatory and anti-leukemic activities (17). A previous study showed that indirubin
is a potent inhibitor of a wide range of kinases, but, in
particular, it strongly suppresses the activation of
cyclin-dependent kinases (18).
Herbal extracts containing indigo or their derivatives have also
exhibited potent antibacterial (19), antitumor (20), anti-inflammatory (21) and antioxidant (22) activities. In a previous study, it was
revealed that natural indigo products showed no mutagenicity but
all synthetic indigo products showed enzyme-mediated mutagenicity
(23). It has also been demonstrated
that the mutagenic effect of purified synthetic indigo and natural
indigo may be attributed to one or more structurally related
contaminants, and the metabolic activation of these promutagenic
factors appears to involve glutathione (24). In addition, mutagenic effects of
synthetic indigo of technical grade or 98% purity have been
observed in the Ames test (25), and
some synthetic colorants are harmful when ingested in large amounts
(13). As mammalian intestinal
microorganisms are able to cleave azo bonds and lead to the
generation of degradation products such as aromatic amines that are
potentially mutagenic and carcinogenic, the use of azo dyes has
been limited (26). However, no
preclinical studies of PR extract containing the natural dyes
indigo and indirubin, have been performed, to the best of our
knowledge, not even a basic rodent single-dose toxicity test.
Moreover, the demand for PR extract has increased for use in
foodstuffs and functional food materials, as well as for its
nutritive value and as a natural dye. Therefore, the present study
was conducted to test the genotoxicity of an aqueous extract of PR
containing indigo and indirubin using a standard battery of tests,
including the bacterial reverse mutation assay, the chromosomal
aberration assay and the mouse micronucleus assay, as used to test
other materials in our previous studies (27,28).
Materials and methods
Chemicals, culture medium and S9
activation system
Fetal bovine serum (FBS) was obtained from
Invitrogen (Thermo Fisher Scientific, Inc., Waltham, MA, USA).
Cyclophosphamide (CPA), ethylmethanesulfonate (EMS), sodium azide
(SA), 4-nitroquinolone-1-oxide (4NQO), 9-aminoacridine (9-AA),
2-aminoanthracene (2-AA), indigo and indirubin standards,
dimethylsulfoxide (DMSO), formic acid and acetonitrile were
supplied by Sigma-Aldrich (St. Louis, MO, USA). Bacto agar was
obtained from Difco (BD Biosciences, Franklin Lakes, NJ, USA). Cell
culture-grade water used in the chromosomal aberration assay and
the reverse mutation assay, culture medium, antibiotics and
L-glutamine were purchased from Invitrogen (Thermo Fisher
Scientific, Inc.).
The S9 mix was purchased from Molecular Toxicology,
Inc. (Boone, NC, USA). For the reverse mutation assay, the S9 mix
(per 1 ml) was composed of MgCl2.6H2O (8
µmol), KCl (33 µmol), glucose 6-phosphate (5 µmol), nicotinamide
adenine dinucleotide phosphate (NADPH; 4 µmol), nicotinamide
adenine dinucleotide (NADH; 4 µmol), sodium phosphate buffer (100
µmol, pH 7.4) and S9 (50 µl). The S9 mix was used at 0.5 ml/plate,
and the activities were determined using 2-AA. In the chromosomal
aberration test, the S9 mix (per 1 ml) was composed of
MgCl2.6H2O (8 µmol), KCl (33 µmol), G-6-P (5
µmol), NADPH (4 µmol), NADH (4 µmol), sodium phosphate buffer (0.1
M, pH 7.4) and S9 (0.3 ml). The S9 mix was prepared just prior to
use and maintained in an ice bath. The S9 mix was used at 0.5 ml/5
ml/T-25 flask, and the effectiveness of the S9 mix was identified
by its ability to activate CPA to induce a mutagenic effect.
Test substance
Preparation of aqueous extract
Aqueous PR extract (yield, 12.00%) as a greenish
brown powder was prepared using a rotary vacuum evaporator (Eyela
N-1110; Tokyo Rikakikai Co., Ltd., Tokyo, Japan) and programmable
freeze dryer (FDB-5503; Operon, Gimpo, South Korea). The extract
was prepared from dried stem parts of Persicaria tinctoria
H. Gross (Polygonaceae) collected from the South Korean province of
Yeongcheon, which were purchased from Omniherb (Yeongcheon, South
Korea) after checking the morphology under a microscope. Voucher
specimens (code. CD2012Ku) were kept in the herbarium of the
Medical Research Center for Globalization of Herbal Formulation,
Daegu Haany University (Gyeongsan, South Korea). Next, 200 g herbs
were boiled at 80°C in 2 L distilled water for 3 h, then evaporated
and lyophilized. As a result, 24 g extract was acquired
(yield=12%). All test materials were stored in a refrigerator at
−20°C to protect them from light and degeneration until use.
Measurement of indigo and indirubin content in
the PR extract
Standard solutions containing 1 µg/ml concentrations
of indigo and indirubin in DMSO were prepared and diluted with 1:1
DMSO:acetonitrile mixtures to concentrations of 1, 5 and 10 ng/ml.
Standard stock solutions and working solutions were stored at 4°C.
For preparation of the sample, samples of PR extract were weighed,
and dissolved in 1:1 DMSO and acetonitrile mixtures. The samples
were then sonicated for 1 h at room temperature. Prior to high
performance liquid chromatographic system (HPLC) analysis, the
sample preparations were filtered through a 0.45-µm membrane
filter. A Waters Alliance HPLC system (Waters Corporation, Milford,
MA, USA), equipped with a Waters 2489 UV/Visible detector was used
for analysis. An Empower Data System and YMC-Pack Pro C-18 column
(1.7 µm, 2.1×100 mm; both Waters Corporation) were used for
recording the output signal of the detector and for separation,
respectively. The mobile phase consisted of 0.1% aqueous formic
acid and 0.1% formic acid in acetonitrile. The flow rate in the
gradient elution system was 1.0 ml/min, the injection volume was 10
µl, the UV detection wavelength was 540 nm and the column was
maintained at room temperature.
Reverse mutation assay
The bacterial reverse mutation assay was conducted
according to standard procedures (29,30).
Salmonella typhimurium (TA98, TA100, TA1535 and TA1537) and
Escherichia coli WP2uvrA were used to determine
whether reverse mutations were induced at histidine and tryptophan
loci, respectively.
Materials
All strains were obtained from Molecular Toxicology
Inc., and confirmed for retention of their characteristic
phenotypic markers at the time of use, as previously described
(31). Tester strains were
inoculated into 25 ml 2.5% Oxoid nutrient broth no. 2 and incubated
at 37°C for 10 h in a 200-rpm shaking incubator (LabTech LSI-3016R;
Daihan Labtech Co., Ltd., Namyangju, Korea). Minimal glucose agar
plates were prepared with 1.5% Bacto agar, Vogel-Bonner medium E
and 2% glucose/liter, and dispensed into 25-ml 100×15 mm Petri
dishes. For the E. coli strain, 0.25 ml/l 0.1% tryptophan
solution was added to the agar plates.
Treatment
Sterile distilled water was used to prepare PR
extract solution and was also used as a negative control to compare
with the PR extract. PR extract solution was diluted with sterile
distilled water to prepare stock solutions for each treatment
without (−S) or with (+S) the S9 mix. 2-AA, 9-AA and 4NQO solutions
were prepared in DMSO. SA solutions were prepared in sterilized
distilled water. Following autoclaving, 2 ml top agar was dispensed
into 12×75-mm tubes at 45°C. PR extract (0.1 ml), S9 mix (or
sodium-phosphate buffer, pH 7.4; 0.5 ml) and bacterial culture (0.1
ml) were then added and mixed gently for 2–3 sec. This mixture was
then poured onto a minimal glucose agar plate. In addition, the PR
extract test solution and S9 mix, without bacterial culture, were
plated to confirm sterility. When the top agar had hardened, the
plates were turned upside down and incubated at 37°C for ~48 h.
Revertants were then counted and the formation of a background lawn
and other abnormalities were observed. The PR extract was assayed
in quadruplicate per concentration.
Judgment
Results are shown as the mean number of colonies±
standard deviation (SD) of quadruplicate plates. After checking for
contamination, the formation of a background lawn and other
abnormalities were analyzed. If the ratio number of colonies on a
treated plate/number of colonies on a negative control plate was
<0.5, the test material was judged to have an antibacterial
effect. A result was considered positive if the frequency of
revertant colonies per plate in at least one strain was
concentration-dependently increased over the range tested and/or
there was a reproducible increase at one or more concentrations
regardless of S9 activation.
Chromosomal aberration assay
Assays were conducted using methods described
previously (32) with slight
modifications.
Materials
Chinese hamster lung (CHL) cells (33) were supplied by the Division of
Genetic Toxicology, Department of Toxicology, Korea Food and Drug
Administration (KFDA; Seoul, South Korea). Cells were grown in
reconstituted minimum essential medium supplemented with sodium
bicarbonate (2.2 g), L-glutamine (292 mg), streptomycin sulfate
(100 µg/ml), sodium penicillin G (1×10⁵ units) and FBS
(10% v/v). Cells were maintained in incubator with a humidified
atmosphere of 5% CO2 in air at 37°C. Rapidly growing
cultures were separated with trypsin. Cells (4×10⁴) were
seeded in culture flasks (25-cm2) in 5 ml medium and
incubated for 3 days.
Treatment
In this assay, cells were directly treated with test
(PR extract) and positive control materials (CPA and EMS). Cells
were divided into series I, II and III groups. The PR extract was
added following a 1 h incubation in 4.0 ml medium for series I
(+S9) and 4.5 ml medium for series II and III (−S9). Cultures of
series I and II were treated with PR extract for 6 h, the treatment
mixture was then removed, and the cells were washed once with
Ca2+- and Mg2+-free Dulbecco's
phosphate-buffered saline (DPBS) followed by further incubation in
5 ml fresh medium until harvesting. Cultures of series III were
cultured with PR extract for 24 h and the washing procedure was
omitted. At ~22 h after treatment, colchicine (1 µM) was treated to
each culture, and the cultures were incubated for an additional 2
h. Mitotic cells were isolated by shaking gently. Following
centrifugation at 150 × g for 5 min, the supernatant was removed
and cell pellets were resuspended in 5 ml 0.075 M KCl solution.
After 10 min at room temperature, fixative solution
(methanol:glacial acetic acid, 3:1 v/v) was rapidly added and the
suspension was kept at 4°C for 20 min. The fixed cell suspension
was dropped onto glass slides and then air-dried followed by
staining with Giemsa (3% in Sorensen buffer, pH 6.8).
Judgment
The criteria for the identification of chromosomal
aberrations were those of Evans (34). The structural aberrations were
divided into two broad types: Chromatid and chromosome gaps,
chromatid type deletions and exchanges; and chromosome type
deletions and exchanges. Each slide was scanned systematically, and
each set of metaphases was examined under ×1,000 magnification. To
identify aberrations, 100 metaphases on each slide that had a
chromosome count of between 23 and 27 were examined. After
recording each type of aberration, the number of aberrant
metaphases (showing one or more aberrations, including/excluding
gaps) and total aberrations (including/excluding gaps) were
calculated. The results are shown as mean aberrant metaphases
excluding gaps per 100 metaphases from quadruple flasks/dose.
In vivo mouse micronucleus assay
Animals and husbandry
A total of 62 male specific pathogen-free
CrljOri:CD1 (ICR) mice (6 weeks old and body weight in the range of
31–34 g upon receipt; Orient Bio Inc., Seungnam, Korea) were
obtained, and five groups of 10 mice each (total 50 mice) were
selected based on the body weights at 9 days after acclimatization
[mean ± standard deviation (SD), 36.16±1.98 g; range 33.6–40.7 g].
Animals were maintained at five per polycarbonate cage in a
controlled room of 50–55% humidity and 20–25°C temperature. The
light:dark cycle was 12 h:12 h, and standard rodent chow (Samyang
Feed, Seoul, Korea) and water were supplied ad libitum. All
animals were maintained in accordance with international
regulations for the usage and welfare of laboratory animals, and
approved by the Institutional Animal Care and Use Committee of
Daegu Haany University (Approval No. DHU2014-017).
Treatment
Mice were treated by oral gavage for 2 consecutive
days with 500, 1,000 or 2,000 mg/kg/day PR extract in a volume of
10 ml/kg, dissolved in distilled water as vehicle or with an equal
volume of vehicle (for vehicle control mice), with ~24 h between
doses. As there are no available toxicological data for PR extract
administered orally to female and male mice, the highest dosage
used in the present study was selected as 2,000 mg/kg, the limited
dosage for rodents (35), and 1,000
and 500 mg/kg were selected for administration to the middle and
lower dosage groups according to the recommendations of the KFDA. A
similar group was treated once with the positive control (70 mg/kg
of CPA) at ~24 h prior to sacrifice.
Observation of clinical signs
According to the functional observational battery
test, all abnormalities were checked at least twice a day (36). If any abnormal clinical signs were
detected, they were subdivided into three degrees according to the
status of animals: 3+ severe, 2+ moderate and 1+ slight (37).
Changes of body weights
Body weights were measured at 1 day before
administration, immediately prior to treatments and at sacrifice
(24 h after the end of the second treatment).
Bone marrow preparation
Animals were asphyxiated with CO2, and
gross necropsy was performed in all surviving animals at 24 h after
the end of the second treatment, and bilateral femurs were
separated. Bone marrow preparations were made according to the
method of Schmid (38). Bone marrow
cells were collected from the femur in 3 ml inactivated FBS,
centrifuged at 300 × g for 10 min in room temperature and smeared
onto a slide. Preparations were then dried, and dipped into
absolute methanol for 10–20 min. Fixed slides were serially stained
using May-Grünwald stock (3 min; Sigma-Aldrich), May-Grünwald stock
and tap water (1:1) diluted solution (2 min) and Giemsa and tap
water (1:6) diluted solution (10 min), respectively.
Judgment
Slides were randomly observed through a microscope
(Eclipse 80i, Nikon Corporation, Tokyo, Japan) at ×400
magnification and examined blindly by two experts. Micronuclei were
morphologically identified according to the criteria defined by
Schmid (39). Micronuclei, which
appeared as small round or oval-shaped bodies, ranging in size from
~1/5 to 1/20 of the diameter of a polychromatic erythrocyte (PCE)
were counted and recorded. In total, 2,000 PCEs per animal were
examined to determine the number of micronuclei. Cytotoxicity was
evaluated by counting the frequency of PCEs and normochromatic
erythrocytes (NCEs) in at least the first 500 erythrocytes from
each animal. Furthermore, in cases where all of the PCE/[PCE +
normochromatic erythrocyte (NCE)] ratios were >0.20, the
experimental results were accepted (40).
Statistical analysis
Quantitative data are presented as means ± standard
deviations. One-way analysis of variance (ANOVA) or the
Kruskal-Wallis H test for multiple comparisons were conducted. When
a significant difference was detected in a statistical hypothesis
test, the Scheffe's test or Mann-Whitney U test with Bonferroni
correction was conducted to determine the significantly different
pairs of groups. Statistical analyses were performed using SPSS for
Windows (version 14.0K; SPSS, Inc., Chicago, IL, USA), and
P<0.05 was considered to indicate a statistically significant
difference.
Results
Indigo and indirubin content in the PR
extract
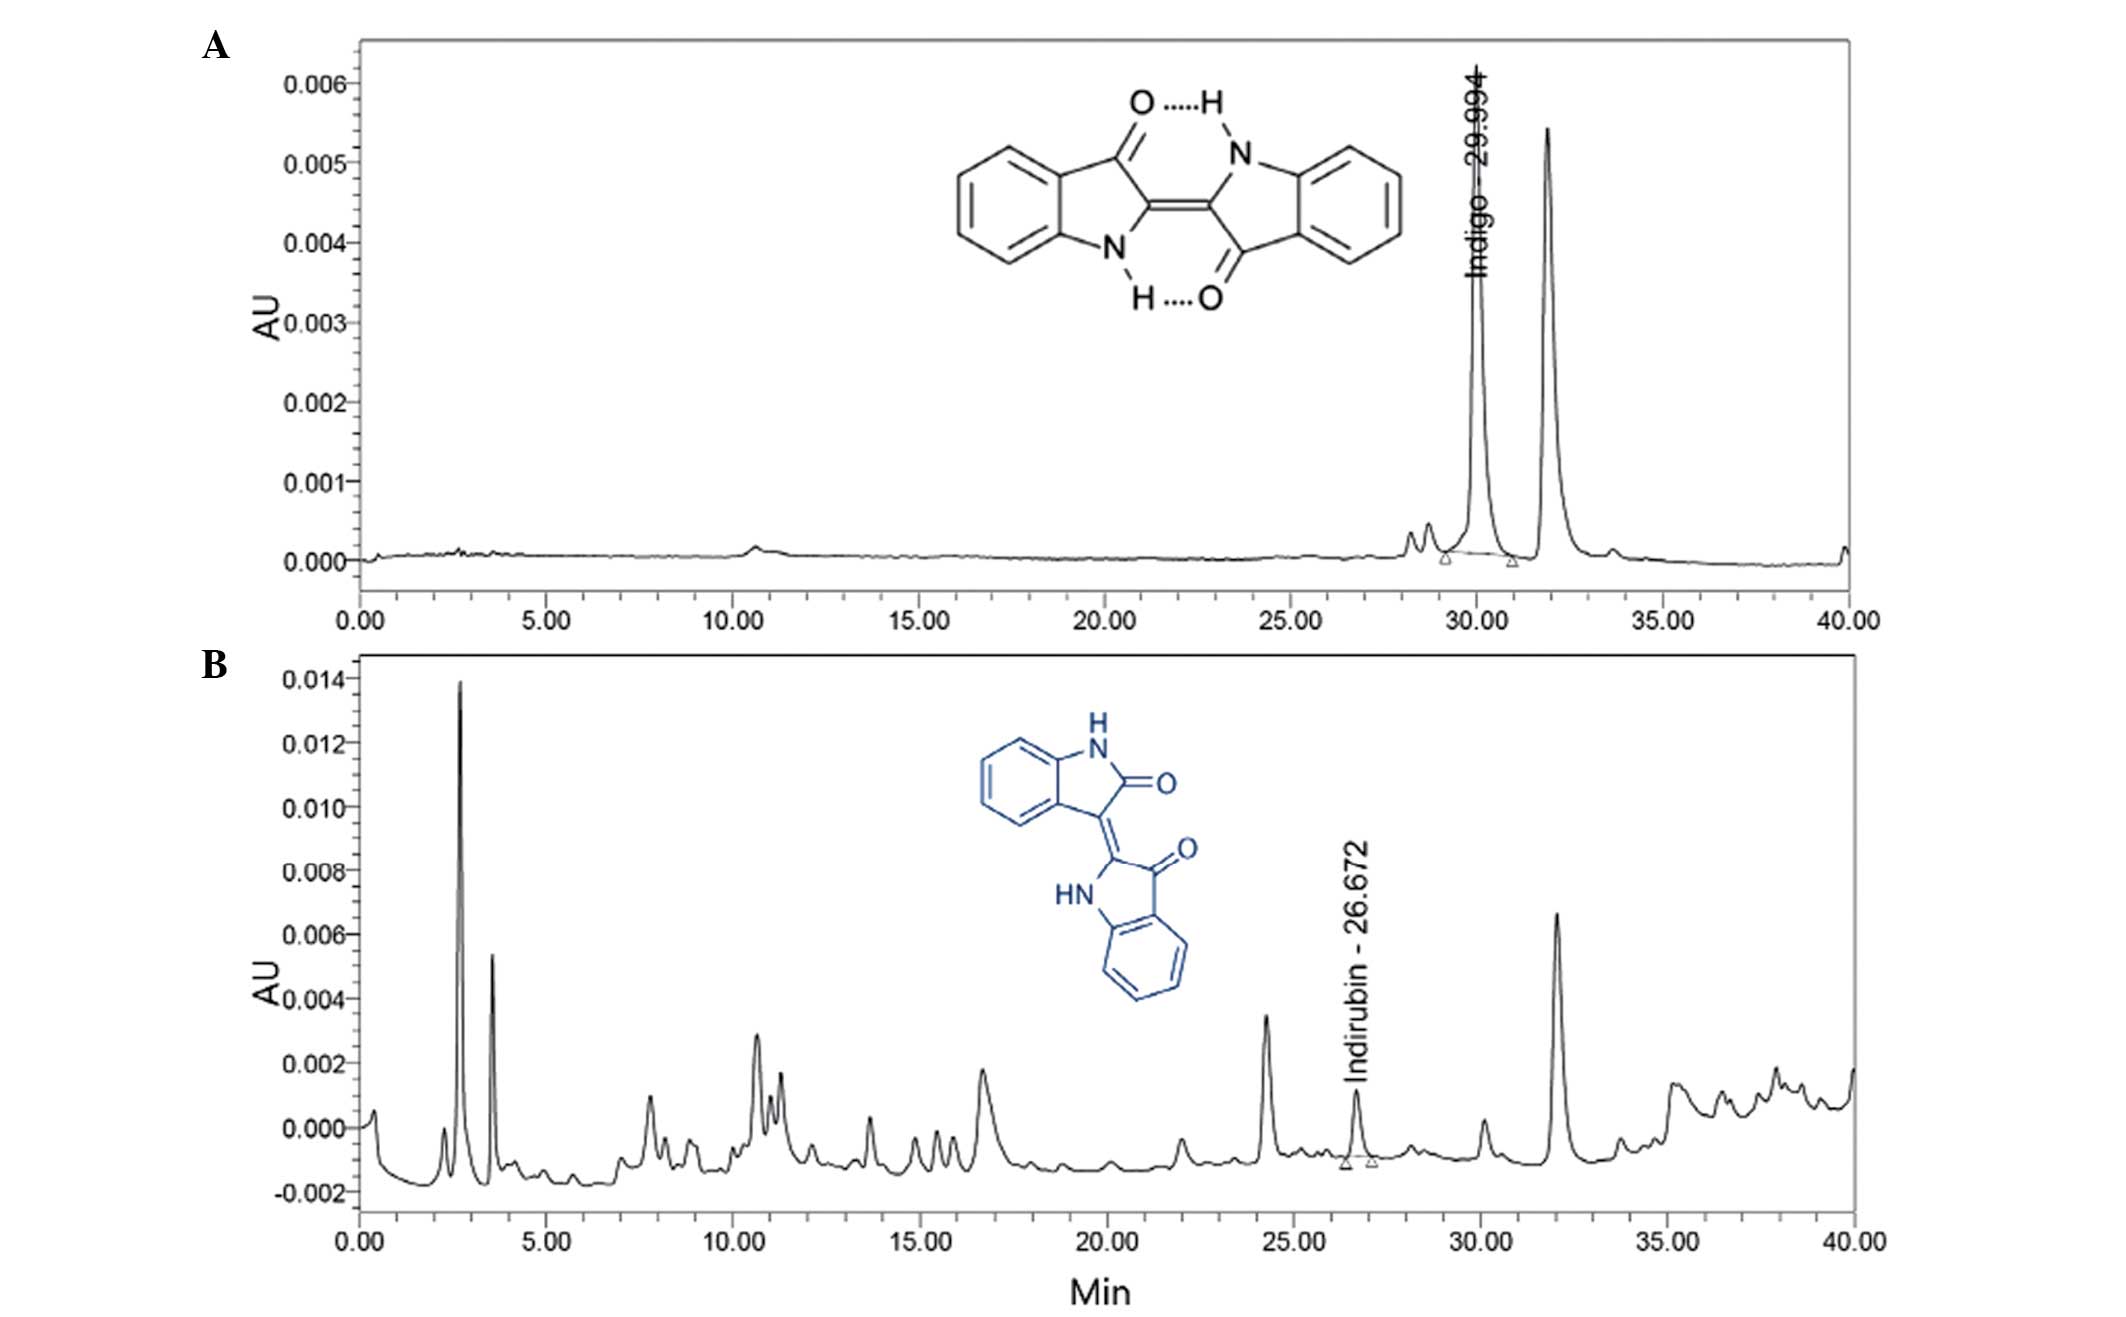
Determination of the quantities of indigo and
indirubin in the PR extract was established by use of HPLC. The
indigo and indirubin contents of the extract were calculated from
the calibration curve of the standards. The results indicated that
the lyophilized aqueous extract of PR contained 0.043% indigo and
0.009% indirubin (Fig. 1).
Reverse mutation assay
The mutagenicity of the PR extract in bacteria was
assessed up to a maximal dose of 1,000 µg/plate, because PR extract
exhibited antibacterial activity at 5,000 and 2,500 µg/plate in all
five test strains of the preliminary test (Table I). All strains showed normal growth,
and the test material was freely soluble at all doses evaluated in
the absence and presence of S9. The revertant frequencies of all PR
extract doses in all tester strains were not changed, regardless of
S9 activation, compared with those in the vehicle control cultures.
All four positive control agents that were tested exhibited
significant (P<0.05) increases in revertant frequencies of
tested strains (Table II).
 | Table I.Results of preliminary range-finding
tests in the bacterial reverse mutation assay. |
Table I.
Results of preliminary range-finding
tests in the bacterial reverse mutation assay.
|
|
| Colonies/plate,
mean (factor)a |
|---|
|
|
|
|
|---|
| Treatment | Dose
(µg/plate) | TA98 | TA100 | TA1535 | TA1537 | WP2uvrA |
|---|
| Without S9 |
|
| Vehicle
controlb |
| 29 (1.00) | 127 (1.00) | 14 (1.00) | 11 (1.00) | 21 (1.00) |
| PR
extract | 0.05 | 27 (0.93) | 119 (0.94) | 15 (1.07) | 8 (0.73) | 19 (0.90) |
|
| 0.5 | 26 (0.90) | 132 (1.04) | 12 (0.86) | 9 (0.82) | 20 (0.95) |
|
| 5 | 30 (1.03) | 125 (0.98) | 13 (0.93) | 10 (0.91) | 21 (1.00) |
|
| 50 | 29 (1.00) | 106 (0.83) | 12 (0.86) | 11 (1.00) | 17 (0.81) |
|
| 500 | 23 (0.79) | 98 (0.77) | 9 (0.64) | 7 (0.64) | 16 (0.76) |
|
| 1,000 | 10 (0.34) | 51 (0.40) | 5 (0.36) | 5 (0.45) | 9 (0.43) |
|
| 5,000 | 8 (0.28) | 38 (0.30) | 3 (0.21) | 3 (0.27) | 4 (0.19) |
| Sodium
azide | 0.5 |
| 398 (3.13) | 483 (34.50) |
|
|
|
4-Nitroquinolone-1-oxide | 0.5 | 282 (9.72) |
|
|
| 132 (6.29) |
|
9-Aminoacridine | 50 |
|
|
| 295 (26.82) |
|
| With S9 |
|
| Vehicle
controlb |
| 38 (1.00) | 119 (1.00) | 9 (1.00) | 17 (1.00) | 17 (1.00) |
| PR
extract | 0.05 | 36 (0.95) | 121 (1.02) | 7 (0.78) | 16 (0.94) | 16 (0.94) |
|
| 0.5 | 40 (1.05) | 117 (0.98) | 9 (1.00) | 18 (1.06) | 14 (0.82) |
|
| 5 | 32 (1.84) | 108 (0.91) | 10 (1.11) | 17 (1.00) | 13 (0.76) |
|
| 50 | 35 (0.92) | 105 (0.88) | 8 (0.89) | 15 (0.88) | 18 (1.06) |
|
| 500 | 30 (0.79) | 93 (0.78) | 6 (0.67) | 11 (0.65) | 15 (0.88) |
|
| 1,000 | 15 (0.39) | 42 (0.35) | 3 (0.33) | 6 (0.35) | 7 (0.41) |
|
| 5,000 | 7 (0.18) | 32 (0.27) | 2 (0.22) | 4 (0.24) | 4 (0.24) |
|
2-Aminoanthracene | 0.4 | 406 (11.28) | 252 (2.08) |
|
|
|
|
| 2 |
|
| 327 (46.71) | 351 (21.94) |
|
|
| 4 |
|
|
|
| 223 (13.94) |
| Table II.Results of the bacterial reverse
mutation assay. |
Table II.
Results of the bacterial reverse
mutation assay.
|
|
| Colonies/plate |
|---|
|
|
|
|
|---|
| Treatment | Dose
(µg/plate) | TA98 | TA100 | TA1535 | TA1537 | WP2uvrA |
|---|
| Without S9 |
|
| Vehicle
controla |
|
26.50±2.65 |
135.00±6.48 |
14.75±1.26 |
11.00±1.83 |
14.50±2.65 |
| PR
extract | 0.01 |
25.25±2.50 |
131.75±8.34 |
15.25±2.63 |
10.75±1.26 |
14.75±3.59 |
|
| 0.1 |
25.00±2.94 |
132.00±4.83 |
14.75±2.50 |
10.25±2.63 |
15.00±2.94 |
|
| 1 |
26.75±3.59 |
133.25±5.97 |
14.50±1.73 |
10.25±1.71 |
14.25±2.22 |
|
| 10 |
24.75±2.50 |
134.75±8.22 |
15.00±1.83 |
11.00±2.16 |
14.50±2.38 |
|
| 100 |
25.50±2.08 |
137.25±5.74 |
14.25±1.71 |
9.75±2.50 |
12.75±1.71 |
|
| 1,000 |
22.25±3.86 |
130.25±4.03 |
12.75±1.71 |
8.75±2.50 |
11.50±2.08 |
| Sodium
azide | 0.5 |
|
456.50±69.63b |
494.25±105.18b |
|
|
|
4-Nitroquinolone-1-oxide | 0.5 |
346.50±73.58b |
|
|
|
112.25±19.16b |
|
9-Aminoacridine | 50 |
|
|
|
273.75±19.45b |
|
| With S9 |
|
| Vehicle
controla |
|
32.50±5.07 |
146.25±12.18 |
10.75±3.10 |
17.75±2.22 |
19.50±2.38 |
| PR
extract | 0.01 |
30.75±7.54 |
145.50±10.91 |
11.00±2.16 |
18.00±2.94 |
18.25±2.75 |
|
| 0.1 |
29.50±1.29 |
145.50±11.98 |
11.50±1.29 |
18.00±2.16 |
18.75±2.22 |
|
| 1 |
32.50±6.19 |
146.75±9.67 |
9.50±1.29 |
17.25±1.71 |
18.25±3.50 |
|
| 10 |
32.00±5.94 |
145.75±10.90 |
10.00±2.71 |
17.25±3.77 |
20.00±1.83 |
|
| 100 |
29.50±6.76 |
139.75±10.40 |
9.75±1.26 |
16.50±2.65 |
17.50±2.08 |
|
| 1,000 |
27.00±2.58 |
132.25±11.15 |
8.75±1.50 |
14.00±4.08 |
16.00±3.92 |
|
2-Aminoanthracene | 0.4 |
311.50±27.33b |
343.50±63.82b |
|
|
|
|
| 2 |
|
|
231.75±47.13b |
332.50±37.04b |
298.50±11.45b |
|
| 4 |
|
Chromosomal aberration assay
In the chromosomal aberration assay, the highest
concentration of PR extract tested was 5,000 µg/ml since the
calculated relative cell count for 5,000 µg/ml was > 89% in the
preliminary experiments (Table
III). There were no differences in structural and numerical
chromosomal aberrations between all doses of PR extract in all
three series of treatments (I, II and III) regardless of the
presence or absence of the metabolic activator S9 when compared
with those in the vehicle control. The two positive control agents
tested in this study showed significant (P<0.05) increases in
structural and numerical chromosomal aberrations (Table IV).
| Table III.Results of preliminary range-finding
tests for the chromosomal aberration assay. |
Table III.
Results of preliminary range-finding
tests for the chromosomal aberration assay.
| Treatment
conditions | Dose (µg/ml) | Viable
cells/flask | RCCa (%) |
|---|
| Treatment time 6 h,
recovery time 18 h, with S9 |
|
| Vehicle
controlb |
|
11,871.25±1,034.27 | 100.00 |
| PR
extract | 0.05 |
11,327.00±941.60 | 95.42 |
|
| 0.5 |
12,054.25±1,123.84 | 101.54 |
|
| 5 |
11,482.50±871.57 | 96.73 |
|
| 50 |
11,931.50±568.58 | 100.51 |
|
| 500 |
12,085.25±77.74 | 101.80 |
|
| 1,000 |
10,641.25±691.62 | 89.64 |
|
| 5,000 |
11,292.75±975.90 | 95.13 |
|
Cyclophosphamide | 6 |
7,694.00±822.28 | 64.81 |
| Treatment time 6 h,
recovery time 18 h, without S9 |
|
| Vehicle
controlb |
|
11,954.00±2,032.45 | 100.00 |
| PR
extract | 0.05 |
11,469.00±852.76 | 95.94 |
|
| 0.5 |
11,859.50±1,540.14 | 99.21 |
|
| 5 |
11,902.75±1,909.86 | 99.57 |
|
| 50 |
12,344.00±1,063.40 | 103.26 |
|
| 500 |
11,473.75±895.79 | 95.98 |
|
| 1,000 |
12,118.00±1,116.35 | 101.37 |
|
| 5,000 |
10,836.00±436.41 | 90.65 |
|
Ethylmethanesulfonate | 800 |
7,609.75±465.86 | 63.66 |
| Treatment time 24
h, recovery time 0 h, without S9 |
|
| Vehicle
controlb |
|
11,220.75±978.78 | 100.00 |
| PR
extract | 0.05 |
10,062.50±882.62 | 89.68 |
|
| 0.5 |
11,643.25±1,526.13 | 103.77 |
|
| 5 |
11,900.75±556.52 | 106.06 |
|
| 50 |
11,304.50±2,231.19 | 100.75 |
|
| 500 |
10,628.25±519.86 | 94.63 |
|
| 1,000 |
11,380.00±2,133.52 | 101.42 |
|
| 5,000 |
12,308.25±1,459.35 | 109.69 |
|
Ethylmethanesulfonate | 600 |
7,019.75±1,146.26 | 62.56 |
| Table IV.Results of the chromosomal aberration
assay. |
Table IV.
Results of the chromosomal aberration
assay.
|
|
| Aberrant
metaphases | Total
aberrations |
|
|
|---|
|
|
|
|
|
|
|
|---|
| Treatment
conditions | Dose (µg/ml) | With gaps | Without gaps | With gaps | Without gaps | PP | ER |
|---|
| Treatment time 6 h,
recovery time 18 h, with S9 |
|
| Vehicle
controla |
|
0.50±0.58 |
0.00±0.00 |
1.25±0.96 |
0.75±0.96 |
0.50±0.58 |
0.25±0.50 |
| PR
extract | 0.5 |
0.25±0.50 |
0.00±0.00 |
1.25±0.50 |
1.00±0.00 |
0.50±0.58 |
0.50±0.58 |
|
| 5 |
0.75±0.50 |
0.00±0.00 |
1.00±0.82 |
0.25±0.50 |
0.25±0.50 |
0.00±0.00 |
|
| 50 |
0.75±0.50 |
0.00±0.00 |
1.75±0.50 |
1.00±0.00 |
0.50±0.58 |
0.50±0.58 |
|
| 500 |
0.25±0.50 |
0.00±0.00 |
0.50±0.58 |
0.25±0.50 |
0.25±0.50 |
0.00±0.00 |
|
| 1,000 |
0.50±0.58 |
0.00±0.00 |
1.50±1.00 |
1.00±0.82 |
0.75±0.50 |
0.25±0.50 |
|
| 5,000 |
0.50±0.58 |
0.00±0.00 |
1.00±0.00 |
0.50±0.58 |
0.25±0.50 |
0.25±0.50 |
|
Cyclophosphamide | 6 |
26.75±3.30b |
23.50±2.38b |
28.75±3.50b |
25.50±2.65b |
0.75±0.50 |
1.25±0.96 |
| Treatment time 6 h,
recovery time 18 h, without S9 |
|
| Vehicle
controla |
|
1.00±0.82 |
0.25±0.50 |
2.00±1.41 |
1.25±0.96 |
0.50±0.58 |
0.50±0.58 |
| PR extract | 0.5 |
0.25±0.50 |
0.00±0.00 |
1.00±0.82 |
0.75±0.50 |
0.25±0.50 |
0.50±0.58 |
|
| 5 |
0.50±0.58 |
0.00±0.00 |
1.50±0.58 |
1.00±0.82 |
0.50±0.58 |
0.50±0.58 |
|
| 50 |
1.00±0.82 |
0.25±0.50 |
1.50±1.29 |
0.75±0.96 |
0.00±0.00 |
0.50±0.58 |
|
| 500 |
0.25±0.50 |
0.00±0.00 |
0.75±0.50 |
0.50±0.58 |
0.25±0.50 |
0.25±0.50 |
|
| 1,000 |
0.75±0.96 |
0.25±0.50 |
1.50±1.29 |
1.00±0.82 |
0.50±0.58 |
0.25±0.50 |
|
| 5,000 |
0.75±0.96 |
0.25±0.50 |
1.25±0.96 |
0.75±0.50 |
0.25±0.50 |
0.25±0.50 |
|
Ethylmethanesulfonate | 800 |
38.50±6.14b |
32.00±4.97b |
39.75±6.55b |
33.25±5.38b |
0.50±0.58 |
0.75±0.50 |
| Treatment time 24
h, recovery time 0 h, without S9 |
|
| Vehicle
controla |
|
1.75±1.71 |
0.75±0.96 |
2.75±1.71 |
1.75±0.96 |
0.25±0.50 |
0.50±0.58 |
| PR
extract | 0.5 |
2.25±1.26 |
0.75±0.96 |
3.25±2.22 |
1.75±1.71 |
0.00±0.00 |
0.50±0.58 |
|
| 5 |
2.00±1.63 |
1.00±0.82 |
3.25±2.22 |
2.25±1.50 |
0.50±0.58 |
0.50±0.58 |
|
| 50 |
2.00±1.83 |
0.75±0.96 |
3.25±0.96 |
2.00±0.82 |
0.50±0.58 |
0.25±0.50 |
|
| 500 |
1.00±0.82 |
0.25±0.50 |
1.25±0.50 |
0.50±0.58 |
0.25±0.50 |
0.00±0.00 |
|
| 1,000 |
1.25±1.89 |
0.50±1.00 |
3.00±2.83 |
2.25±2.22 |
0.50±1.00 |
0.75±0.96 |
|
| 5,000 |
1.00±0.82 |
0.50±1.00 |
2.00±0.82 |
1.50±0.58 |
0.25±0.50 |
0.25±0.50 |
|
Ethylmethanesulfonate | 600 |
56.25±11.41b |
48.25±10.21b |
59.25±13.57b |
51.25±12.50b |
0.75±0.50 |
1.00±0.82 |
In vivo mouse micronucleus assay
No PR extract or CPA treatment-related unscheduled
mortalities or changes in body weight were detected. All of the
five experimental groups tested in the present study were subjected
to bone marrow cell harvesting or blood sampling at 24 h after the
end of the final treatment. In addition, no treatment-related
abnormal clinical signs were observed in mice treated with any of
the three different dosages of PR extract or CPA, with the
exception of slight (1+) diarrhea signs, restrictedly and
transiently detected in three (3/10; 30%) mice treated with 2,000
mg/kg PR extract following the first administration, but not after
the second treatment (Table V).
| Table V.Results of micronucleus test. |
Table V.
Results of micronucleus test.
|
|
| Body weight
(g) |
|
|
|
|
|---|
|
|
|
|
|
|
|
|
|---|
| Treatment | Dose, mg/kg | First
treatment | Sacrifice | No. of
MNPCEa | PCE/(PCE +
NCE)b | Slight diarrhea,
n/total | Mortality,
n/total |
|---|
| Vehicle
controlc |
|
31.73±0.88 |
36.31±1.75 |
1.30±1.42 |
0.55±0.05 | 0/10 | 0/10 |
| PR extract | 2,000 |
31.88±1.03 |
36.35±1.63 |
0.90±0.88 |
0.55±0.05 | 3/10 | 0/10 |
|
| 1,000 |
31.78±1.55 |
36.08±2.08 |
1.10±0.99 |
0.51±0.07 | 0/10 | 0/10 |
|
|
500 |
31.60±1.17 |
36.30±1.08 |
0.40±0.52 |
0.51±0.05 | 0/10 | 0/10 |
|
Cyclophosphamide | 70 |
31.92±0.86 |
36.08±0.97 |
41.70±16.89e |
0.31±0.03d | 0/10 | 0/10 |
Significant (P<0.01) increases in the numbers of
micronucleated bone marrow polychromatic erythrocytes (MNPCEs)
detected among 2,000 PCEs were observed in the CPA-treated group as
compared with the vehicle control group, but no significant changes
in MNPCE numbers were observed for the mice in the 2,000, 1,000 and
500 mg/kg PR extract-treated mice as compared with the vehicle
control group. Although the numbers of PCEs in the 70 mg/kg
CPA-treated mice were significantly (P<0.01) decreased as
compared with those in the vehicle control group, individual
PCE/(PCE + NCE) ratios were >0.25 in the present study. No
significant or noteworthy changes in the PCE/(PCE + NCE) ratio were
observed for the mice treated with 2,000, 1,000 and 500 mg/kg doses
of PR extract when compared with corresponding ratio in the vehicle
control (Table V and Fig. 2).
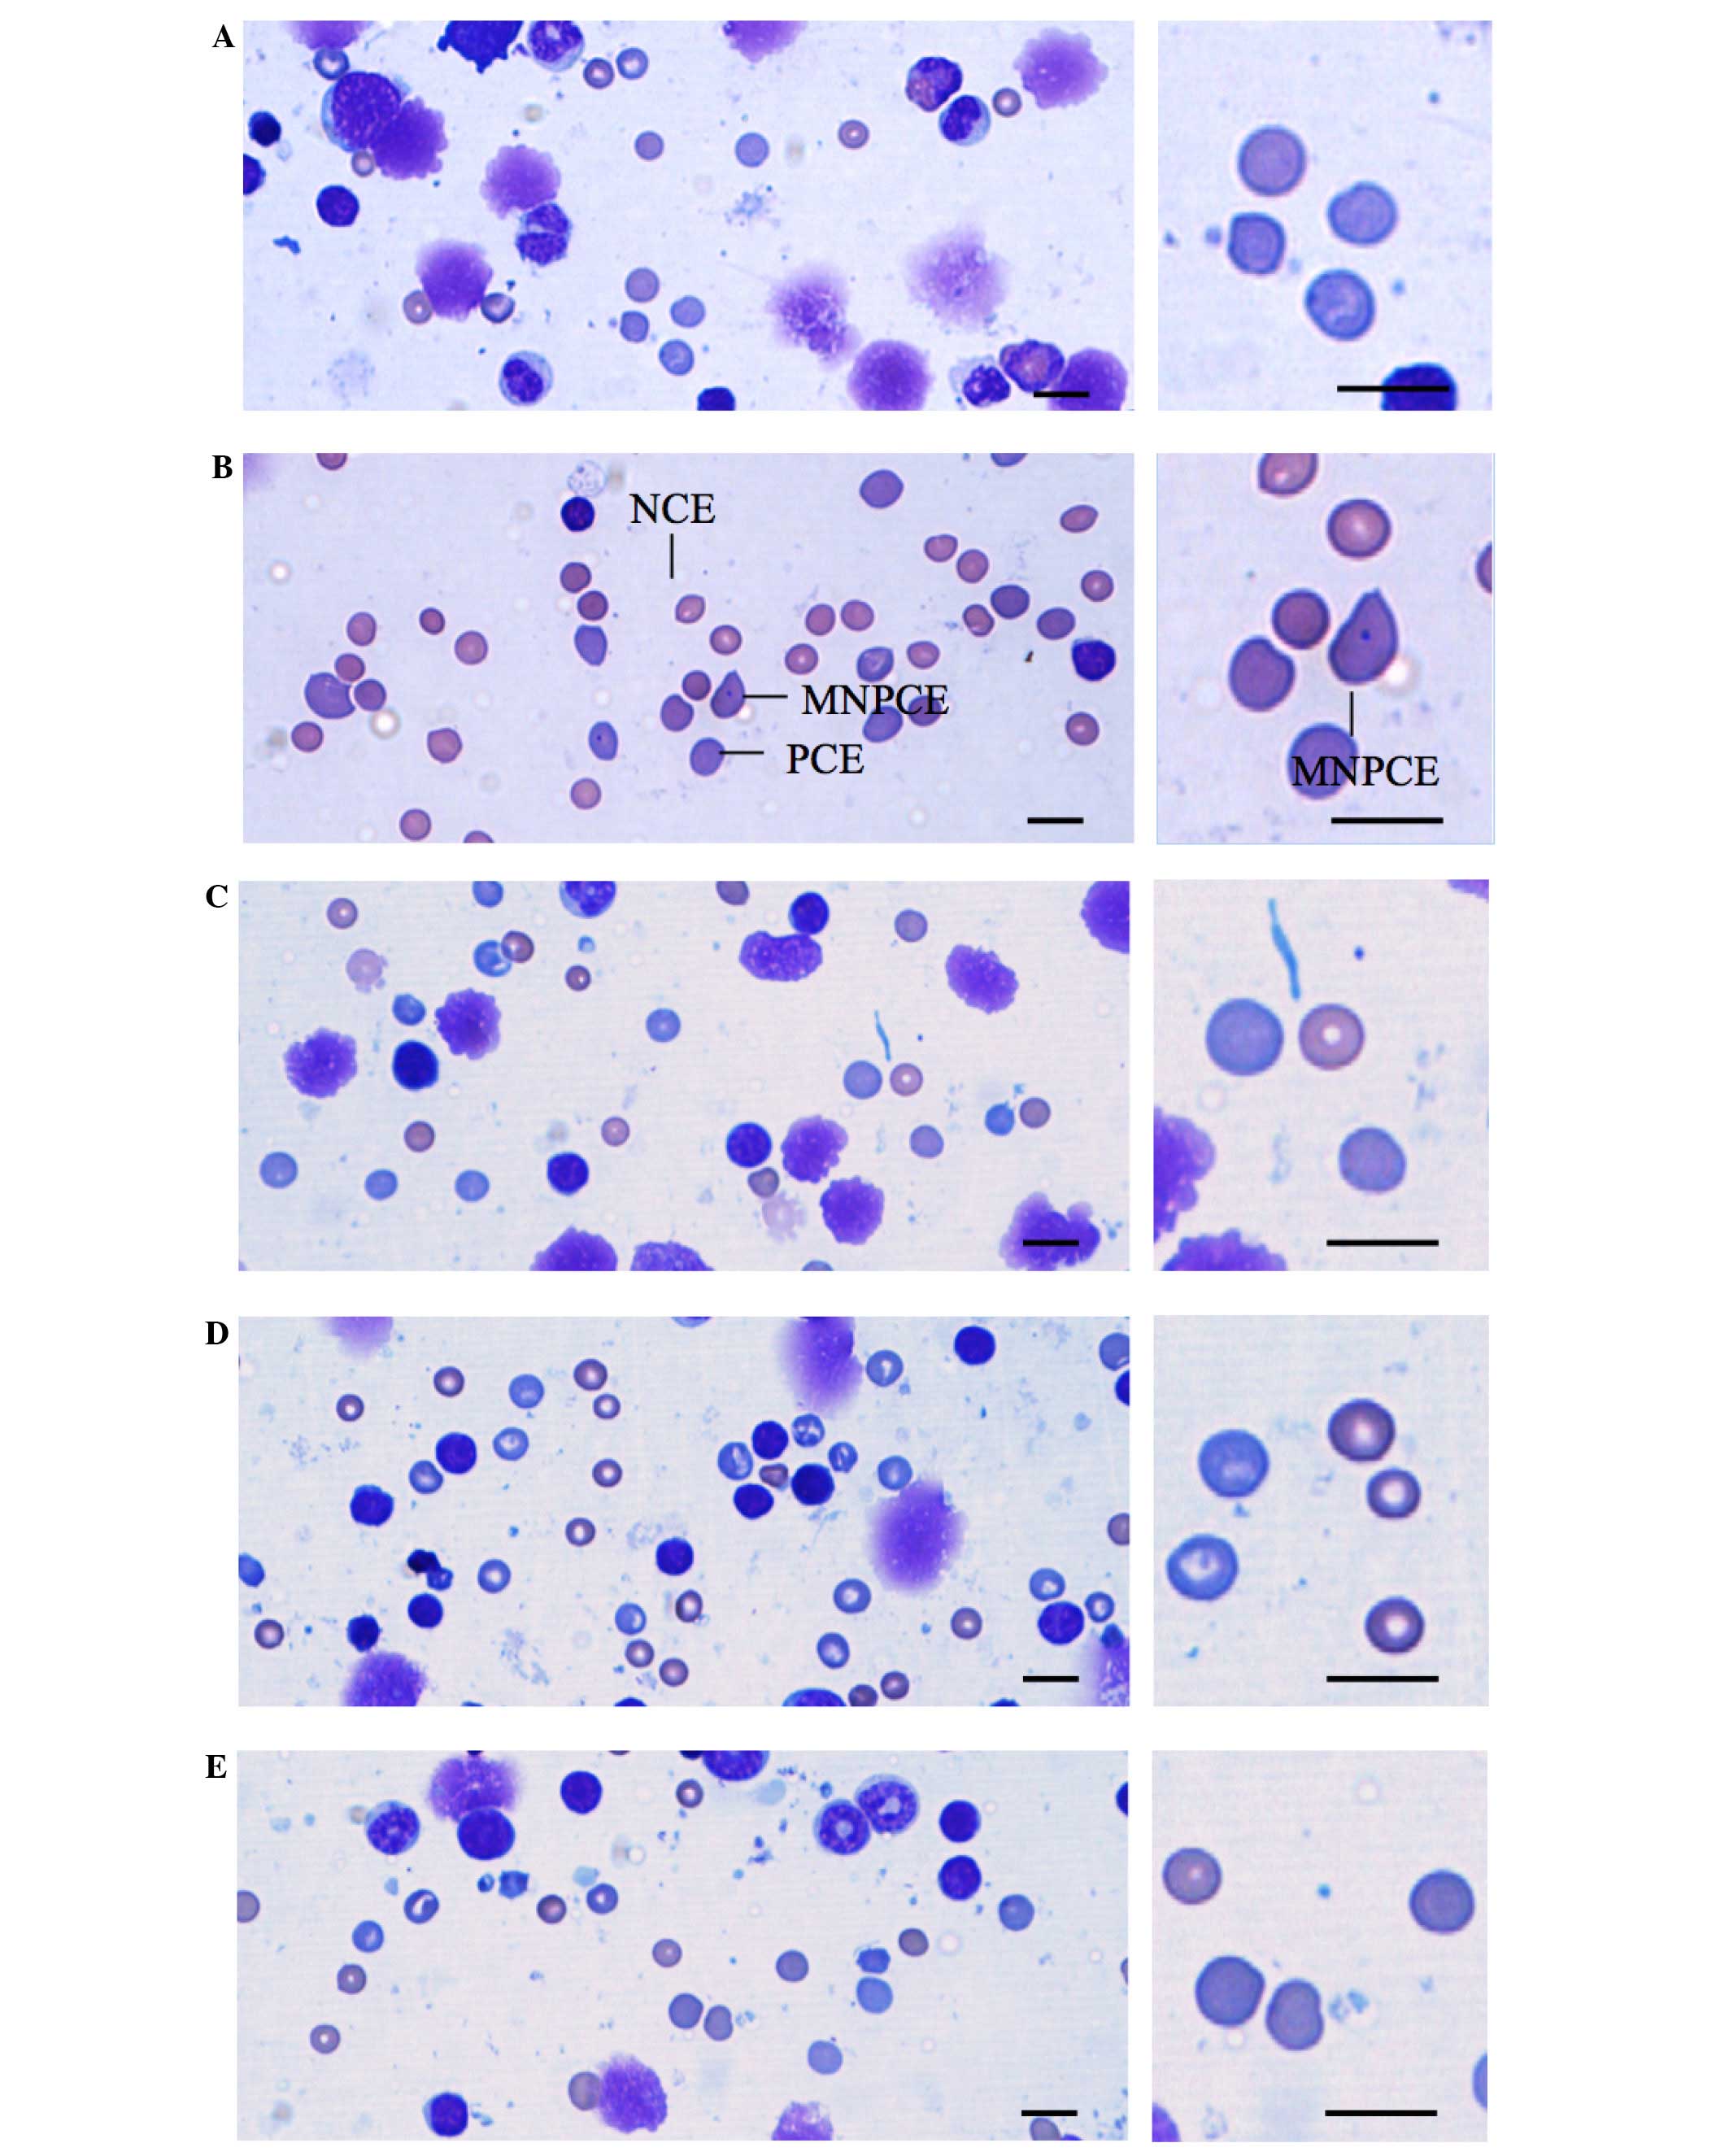 | Figure 2.Representative cytology of bone
marrow cell smears of mice treated with (A) vehicle, (B) CPA, (C)
2,000 mg/kg PR extract, (D) 1,000 mg/kg PRextract and (E) 500 mg/kg
PR extract. In the prepared bone marrow cell smears, PCEs, NCEs and
MNPCEs were counted on the basis of morphology. NCEs containing
nuclei were not calculated. Significant (P<0.01) increases of
the numbers of MNPCEs among 2,000 PCEs were detected in the CPA
group as compared with the vehicle control, but no notable changes
in MNPCE numbers were observed for mice treated with any of the
three doses of PR extract when compared with the vehicle control.
Although PCE numbers in the 70 mg/kg CPA-treated mice were
significantly (P<0.01) decreased as compared with the vehicle
control, individual PCE/(PCE + NCE) ratios were >0.25. No
significant changes on the PCE/(PCE + NCE) ratio were observed for
mice treated with any of the three PR extract doses as compared
with the vehicle control. CPA, cyclophosphamide; PR, Persicariae
Rhizoma; PCE, polychromatic erythrocyte; NCE, normochromatic
erythrocyte; MNPCE, micronucleated bone marrow polychromatic
erythrocytes. Scale bar, 5 µm. |
Discussion
Genotoxicity tests carried out using bacterial,
yeast and mammalian cells are aimed to assess whether substances
will damage genetic material (1,41). The
primary use of in vitro testing is to evaluate whether
chemical and physical agents, or environmental factors can damage
genetic material. The information obtained from such tests can
provide appropriate or sufficient control in the early development
of vulnerable organisms to genotoxic substances (2,3). The
bacterial reverse mutation assay (Ames assay) is used to detect for
gene mutation (42) and various
bacterial strains can be used to compare different changes in the
genetic material. This assay detects specific genetic changes
(mutations and cytogenetic abnormalities) and carcinogens; the
types of mutations identified are frame shifts and base
substitutions (29,30). The chromosome aberration assay is
used to identify structural and numerical chromosomal aberrations
in mammalian cells (32). Genotoxic
substance-induced aberrations include chromatid and chromosome
gaps, chromosome breaks, chromatid deletions, fragmentation,
translocation and complex rearrangements (33). Thus, an increase in the frequency of
structural or numerical aberrations indicates that a genotoxic
substance is generating clastogenic or aneugenic effects (43). The micronucleus test is used to
indicate the potential of genotoxic agents to influence chromosomal
structure or destroy the mitotic spindle that controls chromosome
number. An increase in the frequency of MNPCEs is regarded as a
positive result of induced chromosomal damage (44). When DNA fragments or whole
chromosomes are not incorporated into the main nuclei during
mitosis, micronuclei are formed as small satellite structure nuclei
(40).
Indigo and indirubin, which is a 3,2-bisindole
isomer of indigo, are representative bioactive anti-inflammatory
and antioxidative natural dyes (16,17), and
herbal extracts containing indigo or their derivatives also have
been shown to have potent antibacterial (19), antitumor (20), anti-inflammatory (21) and antioxidant (22) activities. However, certain synthetic
colorants, if they enter into the human body in sufficient
quantities, may be harmful (13).
For example, mammalian intestinal microorganisms can generate
degradation products such as aromatic amines from azo dyes under
anerobic conditions. As these aromatic amines show potential
mutagenic and carcinogenic effects, the use of azo dyes in foods
has been limited (26). In addition,
synthetic indigo of technical grade or 98% purity has exhibited
mutagenic effects in the Salmonella/mammalian microsome
assay (23) and also in the Ames
test (25). PR is known to contain
purple indirubin and blue indigo (15), and has been traditionally used as
anti-inflammatory and detoxification agent in Korea (14). Until now, no preclinical studies of
PR extracts containing indigo and indirubin, have been performed,
to the best of our knowledge. Therefore, the genotoxicity of an
aqueous extract of PR (yield=12.0%) containing indigo (0.043%) and
indirubin (0.009%) was evaluated in the present study using a
standard battery of various tests (27,28) as
part of a safety testing process aiming to clarify its clinical
safety. The PR extract was not found to be genotoxic under the
conditions of the reverse mutation assay, chromosomal aberration
assay or mouse micronucleus assay conducted in this study.
In the reverse mutation assay, with or without S9
mix as a metabolic activation system, no increase in revertant
colony number was detected. In addition, the PR extract did not
induce chromosomal aberration in a short-term exposure test with
the S9 mix or in the continuous (24 h) test. Although slight signs
of diarrhea were restrictedly and transiently detected in three
(3/10; 30%) mice treated with 2,000 mg/kg PR extract after the
first administration, there were no significant increases of the
frequency of MNPCEs at doses ≤2,000 mg/kg.
Firstly, whether PR extract induces revertant
colonies in four histidine auxotrophic strains of S.
typhimurium and one tryptophan auxotrophic strain of E. coli
was tested. There were no increases of the number of revertant
colonies at any PR extract dose with or without the S9 mix
metabolic activation system. These findings indicate a negative
response to the PR extract in the bacterial reverse mutation assay.
Secondly, to evaluate the mutagenicity of the PR extract,
chromosome aberration testing was performed in cultured CHL cells.
The number of aberrant metaphases did not increase in the PR
extract-exposed groups at any dose or regardless of S9 mix, while a
marked increase in the number of aberrant metaphases was detected
in the positive controls. Thus, PR extract did not exhibit
mutagenic potential in the chromosome aberration assay. Finally, to
determine the mutagenic potential of the PR extract, a micronucleus
assay was performed in male ICR mice. Although slight signs of
diarrhea were restrictedly and transiently detected in three (3/10;
30%) mice following the first administration of 2,000 mg/kg PR
extract, no significant increases in the incidence of MNPCEs or the
ratio of PCEs to total erythrocytes, which is an indicator of
cytotoxicity (40), were observed
following treatment with ≥2,000 mg/kg PR extract. These results of
the micronucleus test indicate that the PR extract was not
mutagenic. In vivo micronucleus testing has been widely used
to detect genotoxicity due to its simplicity and efficacy.
Furthermore, if the micronucleus assay is conducted in combination
with other cytogenetic assays, this assay has greater relevance in
the evaluation of the mutagenicity and carcinogenicity of test
materials (40). All mice used in
this study, including CPA-treated mice, were found to have normal
body weights and weight gains throughout the experimental testing
period, in comparison with age-matched normal reference mice
(45), and no mortalities were
recorded.
In summary, the results of the present study
indicate that the aqueous PR extract should be safe to use,
particularly if it is consumed in small amounts compared with the
doses used in the genotoxicity tests. Furthermore, these results
suggest that PR extract may be a useful bioactive agent following
further toxicity evaluation.
Acknowledgements
This study was supported by the National Research
Foundation of Korea (NRF) funded by the Korean government (Ministry
of Science, ICT and Future Planning; grant no. 2011-0030124) and as
a Basic Science Research Program by the Ministry of Education,
Science and Technology (grant no. NRF-2012R1A1A2043886).
References
|
1
|
Keong LC and Halim AS: In vitro models in
biocompatibility assessment for biomedical-grade chitosan
derivatives in wound management. Int J Mol Sci. 10:1300–1313. 2009.
View Article : Google Scholar : PubMed/NCBI
|
|
2
|
Mei N, Guo L, Fu PP, Fuscoe JC, Luan Y and
Chen T: Metabolism, genotoxicity, and carcinogenicity of comfrey. J
Toxicol Environ Health B Crit Rev. 13:509–526. 2010. View Article : Google Scholar : PubMed/NCBI
|
|
3
|
Momi N, Kaur S, Ponnusamy MP, Kumar S,
Wittel UA and Batra SK: Interplay between smoking-induced
genotoxicity and altered signaling in pancreatic carcinogenesis.
Carcinogenesis. 33:1617–1628. 2012. View Article : Google Scholar : PubMed/NCBI
|
|
4
|
DeMarini DM: Genotoxicity biomarkers
associated with exposure to traffic and near-road atmospheres: A
review. Mutagenesis. 28:485–505. 2013. View Article : Google Scholar : PubMed/NCBI
|
|
5
|
Burlinson B: The in vitro and in vivo
comet assays. Genetic Toxicology. Parry JM and Parry EM: Springer.
(New York, NY). 143–163. 2012. View Article : Google Scholar
|
|
6
|
Magdolenova Z, Collins A, Kumar A, Dhawan
A, Stone V and Dusinska M: Mechanisms of genotoxicity. A review of
in vitro and in vivo studies with engineered nanoparticles.
Nanotoxicology. 8:233–278. 2014. View Article : Google Scholar : PubMed/NCBI
|
|
7
|
Chen T, Mei N and Fu PP: Genotoxicity of
pyrrolizidine alkaloids. J Appl Toxicol. 30:183–196.
2010.PubMed/NCBI
|
|
8
|
Jeong YT, Kim YD, Jung YM, Park DC, Lee
DS, Ku SK, Li X, Lu Y, Chao GH, Kim KJ, et al: Low molecular weight
fucoidan improves endoplasmic reticulum stress-reduced insulin
sensitivity through AMP-activated protein kinase activation in L6
myotubes and restores lipid homeostasis in a mouse model of type 2
diabetes. Mol Pharmacol. 84:147–157. 2013. View Article : Google Scholar : PubMed/NCBI
|
|
9
|
Noh JR, Kim YH, Gang GT, Hwang JH, Kim SK,
Ryu SY, Kim YS, Lee HS and Lee CH: Hepatoprotective effect of
Platycodon grandiflorum against chronic ethanol-induced
oxidative stress in C57BL/6 mice. Ann Nutr Metab. 58:224–231. 2011.
View Article : Google Scholar : PubMed/NCBI
|
|
10
|
Aeschbacher HU: Genetic toxicology of food
products. Mutation and the Environment: Environmental Genotoxicity,
Risk and Modulation, Part E. Mendelsohn ML and Albertini RJ:
Wiley-Liss, Inc. (New York, NY). 117–126. 1990.
|
|
11
|
Williams GM: Food-borne carcinogens.
Genetic Toxicology of the Diet. Knudsen I: A.R. Liss. (New York,
NY). 3–81. 1986.
|
|
12
|
Sugimura T, Sato S, Ohgaki H, Takayama S,
Nagao M and Wakabayashi K: Mutagens and carcinogens in cooked food.
Genetic and Toxicology of the Diet. Knudsen I: A.R. Liss. (New
York, NY). 105–107. 1986.
|
|
13
|
Sarıkaya R, Selvi M and Erkoç F:
Evaluation of potential genotoxicity of five food dyes using the
somatic mutation and recombination test. Chemosphere. 88:974–979.
2012. View Article : Google Scholar : PubMed/NCBI
|
|
14
|
Woo YM, Kim AJ, Kim JY and Lee CH:
Tyrosinase inhibitory compounds isolated from Persicaria
tinctoria flower. J Appl Biol Chem. 54:2011. View Article : Google Scholar
|
|
15
|
Kim SJ, Ko JH, Park SH, Kim MS and Kim KS:
Preparation method of indigo standard solution and variation of
indigo contents in blue dye extract from breeding lines of
Persicaria tinctoria H. Gross. Korean J Medicinal Crop Sci.
21:213–219. 2013. View Article : Google Scholar
|
|
16
|
Xiao Z, Hao Y, Liu B and Qian L: Indirubin
and meisoindigo in the treatment of chronic myelogenous leukemia in
China. Leuk Lymphoma. 43:1763–1768. 2002. View Article : Google Scholar : PubMed/NCBI
|
|
17
|
Mok CK, Kang SS, Chan RW, Yue PY, Mak NK,
Poon LL, Wong RN, Peiris JS and Chan MC: Anti-inflammatory and
antiviral effects of indirubin derivatives in influenza A (H5N1)
virus infected primary human peripheral blood-derived macrophages
and alveolar epithelial cells. Antiviral Res. 106:95–104. 2014.
View Article : Google Scholar : PubMed/NCBI
|
|
18
|
Hoessel R, Leclerc S, Endicott JA, Nobel
ME, Lawrie A, Tunnah P, Leost M, Damiens E, Marie D, Marko D, et
al: Indirubin, the active constituent of a Chinese antileukaemia
medicine, inhibits cyclin-dependent kinases. Nat Cell Biol.
1:60–67. 1999. View
Article : Google Scholar : PubMed/NCBI
|
|
19
|
Kataoka M, Hirata K, Kunikata T, Ushio S,
Iwaki K, Ohashi K, Ikeda M and Kurimoto M: Antibacterial action of
tryptanthrin and kaempferol, isolated from the indigo plant
(Polygonum tinctorium Lour.), against Helicobacter
pylori-infected mongolian gerbils. J Gastroenterol. 36:5–9.
2001. View Article : Google Scholar : PubMed/NCBI
|
|
20
|
Jang HG, Heo BG, Park YS, Namiesnik J,
Barasch D, Katrich E, Vearasilp K, Trakhtenberg S and Gorinstein S:
Chemical composition, antioxidant and anticancer effects of the
seeds and leaves of Indigo (Polygonum tinctorium Ait) plant.
Appl Biochem Biotechnol. 167:1986–2004. 2012. View Article : Google Scholar : PubMed/NCBI
|
|
21
|
Lin YK, Leu YL, Huang TH, Wu YH, Chung PJ,
Su Pang JH and Hwang TL: Anti-inflammatory effects of the extract
of indigo naturalis in human neutrophils. J Ethnopharmacol.
125:51–58. 2009. View Article : Google Scholar : PubMed/NCBI
|
|
22
|
Lin YK, Chen HW, Yang SH, Leu YL, Huang YH
and Yen HC: Protective effect of indigo naturalis extract against
oxidative stress in cultured human keratinocytes. J Ethnopharmacol.
139:893–896. 2012. View Article : Google Scholar : PubMed/NCBI
|
|
23
|
Jongen WM and Alink GM: Enzyme-mediated
mutagenicity in Salmonella typhimurium of contaminants of
synthetic indigo products. Food Chem Toxicol. 20:917–920. 1982.
View Article : Google Scholar : PubMed/NCBI
|
|
24
|
Jongen WM: Metabolic activation of
promutagenic factors in synthetic indigo by mammalian microsomes.
Carcinogenesis. 3:1321–1323. 1982. View Article : Google Scholar : PubMed/NCBI
|
|
25
|
Rannug U, Bramstedt H and Nilsson U: The
presence of genotoxic and bioactive components in indigo dyed
fabrics - a possible health risk? Mutat Res. 282:219–225. 1992.
View Article : Google Scholar : PubMed/NCBI
|
|
26
|
Ashkenazi P, Yarnitzky C and Cais M:
Determination of synthetic food colours by means of a novel sample
preparation system. Anal Chim Acta. 248:289–299. 1991. View Article : Google Scholar
|
|
27
|
Seo JY, Park MY, Jung TY, Choi HY, Kim JD,
Lee HS and Ku SK: Genotoxicity testing of aqueous extracts of
Mahwangyounpae-tang, a polyherbal formula. Food Chem Toxicol.
46:3827–3831. 2008. View Article : Google Scholar : PubMed/NCBI
|
|
28
|
Song MY, Ku SK and Han JS: Genotoxicity
testing of low molecular weight fucoidan from brown seaweeds. Food
Chem Toxicol. 50:790–796. 2012. View Article : Google Scholar : PubMed/NCBI
|
|
29
|
Ames BN, McCann J and Yamasaki E: Methods
for detecting carcinogens and mutagens with the
Salmonella/mammalian-microsome mutagenicity test. Mutat Res.
31:347–364. 1975. View Article : Google Scholar : PubMed/NCBI
|
|
30
|
Green MH and Muriel WJ: Mutagen testing
using TRP+ reversion in Escherichia coli. Mutat
Res. 38:3–32. 1976. View Article : Google Scholar : PubMed/NCBI
|
|
31
|
Maron DM and Ames BN: Revised methods for
the Salmonella mutagenicity test. Mutat Res. 113:173–215.
1983. View Article : Google Scholar : PubMed/NCBI
|
|
32
|
Dean BJ and Danford N: Assays for the
detection of chemically-induced chromosome damage in cultured
mammalian cells. Mutagenicity Testing - A Practical Approach.
Venitt S and Parry JM: IRL Press. (Oxford). 187–232. 1984.
|
|
33
|
Koyama H, Utakoji T and Ono T: A new cell
line derived from newborn Chinese hamster lung tissue. Gan.
61:161–167. 1970.PubMed/NCBI
|
|
34
|
Evans H: Cytological methods for detecting
chemical mutagens. Chemical Mutagens, Principles and Methods for
their Detection. 4:Hollaender A: Plenum Press. (New York, NY).
1–29. 1976. View Article : Google Scholar
|
|
35
|
Flecknell P: Laboratory Animal Anaesthesia
(3rd). Elsevier Academic Press. New York, NY: 2009. View Article : Google Scholar
|
|
36
|
Dourish CT: Effects of drugs on
spontaneous motor activity. Experimental Psychopharmacology.
Greenshaw AJ and Dourish CT: Humana Press. (Clifton, NJ). 153–176.
1987. View Article : Google Scholar
|
|
37
|
Choi JS, Kim JW, Kim KY, Ku SK and Sohn
JH: Single-dose oral toxicity of fermented rice extracts (FREs): A
14-day observation. Pak J Pharm Sci. 27:129–137. 2014.PubMed/NCBI
|
|
38
|
Schmid W: The micronucleus test. Mutat
Res. 31:9–15. 1975. View Article : Google Scholar : PubMed/NCBI
|
|
39
|
Schimd W: The micronucleus test for
cytogenetic analysis. In: Chemical Mutagens. Principles and Methods
for their Detection. 4:Hollaender A: Plenum Press. (New York).
31–53. 1976.
|
|
40
|
Heddle JA, Stuart E and Salamone MF: The
bone marrow micronucleus test. Handbook of Mutagenicity Test
Procedures (2nd). Kilbey BJ, Legator M, Nicholson W and Ramel C:
Elsevier. (Amsterdam). 441–457. 1984.
|
|
41
|
Scholz S, Fischer S, Gündel U, Küster E,
Luckenbach T and Voelker D: The zebrafish embryo model in
environmental risk assessment-applications beyond acute toxicity
testing. Environ Sci Pollut Res Int. 15:394–404. 2008. View Article : Google Scholar : PubMed/NCBI
|
|
42
|
Mortelmans K and Zeiger E: The ames
Salmonella/microsome mutagenicity assay. Mutat Res.
455:29–60. 2000. View Article : Google Scholar : PubMed/NCBI
|
|
43
|
Speit G, Kühner S, Linsenmeyer R and
Schütz P: Does formaldehyde induce aneuploidy? Mutagenesis.
26:805–811. 2011. View Article : Google Scholar : PubMed/NCBI
|
|
44
|
Chung IK, Cheon WH and Ku SK: Micronucleus
test of Picrorrhiza Rhizoma aqueous extract in bone marrow
cells of male ICR mice. Toxicol Res. 27:119–123. 2011. View Article : Google Scholar : PubMed/NCBI
|
|
45
|
Tajima Y and Horiuchi S: Biological
Reference Data Book on Experimental Animals. Soft Science (Tokyo).
2–3. 1989.(In Japanese).
|