Introduction
Coronary artery disease (CAD) is a leading cause of
mortality in developed countries, causing 7.3 million deaths in the
year 2001 worldwide (1). It can be
attributed to disturbances of the coronary circulation, a process
that is responsible for the oxygen and nutrient supply to the
myocardium, and may involve dysfunction within the
microcirculation, in addition to the coronary arteries (2). The atherosclerotic plaques that develop
along the inner walls of the coronary arteries are a direct cause
of the disease, narrowing the arteries and reducing blood flow to
the heart. Currently, single-photon emission computed tomography,
cardiac magnetic resonance and positron emission tomography
perfusion imaging are the three most commonly used diagnosis
techniques (3), however, only 20% of
CAD cases are diagnosed prior to a heart attack (4). Thus, there is an urgent requirement for
a novel, more efficient and credible methods.
A biological network contains certain small,
repeated and conserved network motifs that appear at significantly
higher frequencies than random ones (5). Doncic and Skotheim (6) have reported that a three-gene motif
within a complex network is capable of explaining yeast cellular
state decisions in response to mating pheromones, suggesting that
it may not be necessary to model the full complexity of biological
networks when attempting to capture the molecular determinants of
cellular behaviors. Furthermore, investigation of network motifs
have proven useful for the prediction of protein-protein
interaction (7), decomposition of
hierarchical networks (8) and
analysis of temporal gene expression patterns (9). Thus, the network motif-based method is
a potential approach for future CAD research.
Microarray analysis is used to detect gene
expression changes occurring in patients with CAD (10,11);
however, the reproducibility of single-gene methods is often poor
(12). In the present study, a novel
network motif-based approach was employed to select motifs
associated with CAD occurrence, which is considered to be more
reproducible and interpretable. Through comparing this method with
a conventional individual differentially expressed gene (DEG)-based
method for the classification of CAD and normal control samples,
the aforementioned motif-based method was demonstrated to be
efficient and credible.
Materials and methods
Extraction and preprocessing of gene
microarray data
Gene expression profile dataset GSE42148 was
downloaded from the Gene Expression Omnibus (GEO; http://www.ncbi.nlm.nih.gov/geo/) database. The
gene annotation platform used was GPL13607 Agilent-028004 SurePrint
G3 Human GE 8×60K Microarray. The data were collected from the
whole blood samples of 13 patients with CAD and 11 population-based
asymptomatic controls. First, the extracted microarray data were
subject to log2 conversion, followed by quantile
standardization (13).
Screening of common genes and
construction of an integrated regulation network
Transcriptional regulation data comprising
transcription factors and target genes were downloaded from
Encyclopedia of DNA Elements (14).
In addition, protein-protein interaction pairs were downloaded from
the Human Protein Reference Database (15).
Transcriptional regulation data and protein-protein
interaction data downloaded from the two databases (R 3.2.2;
https://www.r-project.org/) were
integrated to screen the common genes. Any gene that exists in only
the regulation network or the protein-protein interaction network
was removed. The retained common genes were further compared with
those annotated from the gene microarrays to screen the same genes.
Final-screened common genes and associated transcription factors
were used to construct an integrated regulation network.
Detection of significant three-node
network motifs
Three-node network motifs that occurred at a
significantly greater frequency compared with random networks in
the constructed integrated network (P<0.05) were detected using
Fast Network Motif Detection (version 2.2; http://theinf1.informatik.uni-jena.de/motifs/)
(16). The significance test was
conducted over 1,000 randomized networks, and a motif including at
least one transcription factor with P<0.05 was considered to
indicate a statistically significant difference.
Screening of differential network
motifs
R-package GlobalAncova software (http://www.bioconductor.org) was used to screen
network motifs, which revealed a significant differential score
between the CAD group and the normal control (P<0.05) based on
the gene expression data from microarrays (17). The significance of the network motifs
was assessed by calculating random differential scores in 1,000
random disturbances.
Functional analysis of genes involved
in the differential network motifs
Genes involved in the resulting differential network
motifs were subject to pathway enrichment analysis based on Kyoto
Encyclopedia of Genes and Genomes (KEGG; www.genome.jp/kegg) (18) and functional annotation analysis
based on the gene ontology (GO) database (19) using Database for Annotation,
Visualization and Integrated Discovery (version 6.7; https://david.ncifcrf.gov/) (20). P<0.05 was used as a cut-off.
Comparison of the two classification
method
Differential expression analysis of the genes of 13
patients with CAD and 11 asymptomatic controls was performed to
screen DEGs (false discovery rate, <0.05) using the significant
analysis of microarrays (SAM) method (21). Subsequent to this, the patient and
control samples were classified based on the resulting DEGs using a
hierarchical clustering method. Further to this, the patient and
control samples were also clustered based on the expression values
of the top three-node network motifs detected in the present study
and the expression value of a motif was defined as the mean of the
expression values of the three genes within a motif. The clustering
results of the two different methods were then compared.
Results
Genes annotated from gene
microarrays
In total, 27,531 genes were annotated from the gene
microarray data GSE42148.
Genes annotated from gene microarrays
and detection of three-node network motifs
A total of 27,531 genes were annotated from the gene
microarray data GSE42148. An integrated regulation network was
constructed using the final-screened common genes and the
associated transcription factors, which consisted of 13,133 genes,
including 76 transcription factors and 60,709 associated pairs,
including 24,573 transcriptional regulation pairs and 36,136
protein-protein interaction pairs.
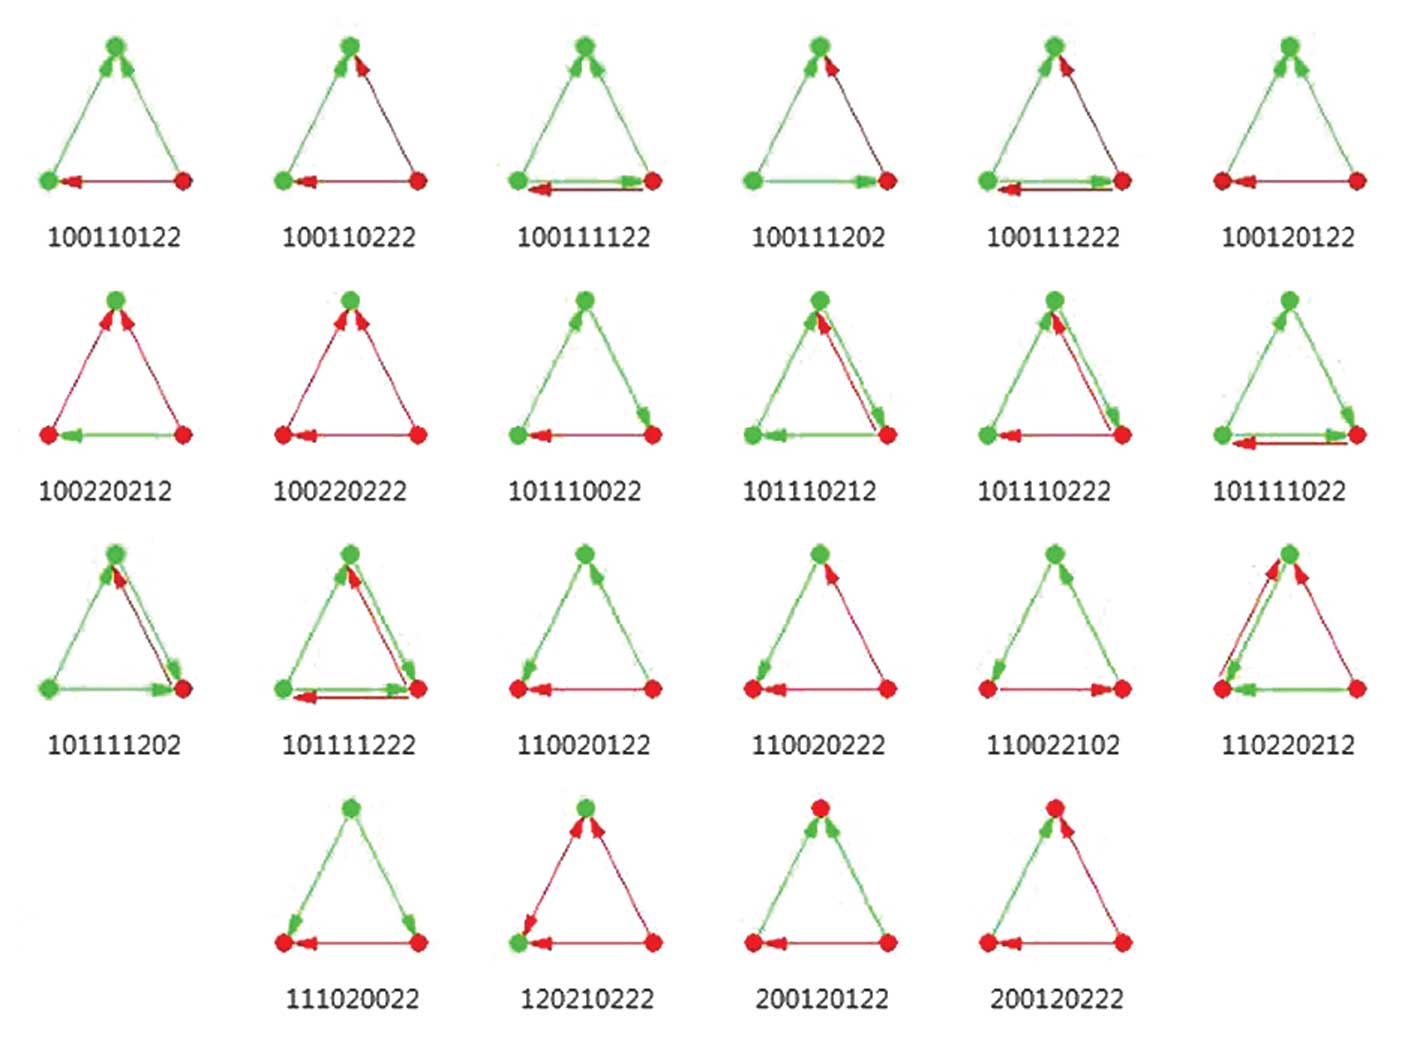
Finally, 9,008 three-node network motifs involving a
total of 2,774 genes were detected, with each motif containing at
least one transcription factor. The aforementioned network motifs
may be categorized into 22 modes according to the pattern of
interior molecular interaction (Fig.
1).
Screening of differential network
motifs
A total of 1,132 differentially expressed network
motifs involving 697 genes, between the CAD group and the control
group were screened using R-package GlobalAncova software.
Of the 1,132 differential network motifs, there were
304 network motifs sharing the interaction pattern 100110222
(26.86%). In the mode 100110222, one transcription factor regulates
two co-expressed target genes. The motif consisting of structural
maintenance of chromosomes 3 (SMC3), CCAAT/enhancer binding
protein beta (CEBPB) and tribbles pseudokinase 1
TRIB1 and that consisting of IQCG, Myc Associated
Factor X (MAX) and BAT3 [also known as BCL2
associated athanogene 6 (BAG6)] were of this type. Among the
top 20 network motifs, 10 shared this mode. Furthermore, 228/1,132
(20.14%) differential network motifs shared the interaction pattern
100220212, in which two transcription factors regulates the same
target gene. Among the top 20 network motifs, six shared this
interaction mode, including the motif consisting of USF1 and
USF2 and zinc finger protein 507 (ZNF507; Table I).
 | Table I.Top 20 three-gene network motifs. |
Table I.
Top 20 three-gene network motifs.
|
| Network motif |
|
|
|---|
|
|
|
|
|
|---|
| ID | Gene 1 | Gene 2 | Gene 3 | F-value | P-valuea |
|---|
| 100220212 | USF2 | ZNF507 | USF1 |
9.2369 | <0.001 |
| 100220212 | SMARCA4 | SMARCB1 | H3F3B |
7.4731 | <0.001 |
| 100110222 | CTCF | MAP2K1 | TRIB1 | 12.1154 | <0.001 |
| 100220212 | SMARCA4 | SMARCB1 |
HIST1H2AE |
8.9551 | <0.001 |
| 100220212 | TBP | H3F3B | NFYB | 11.2600 | <0.001 |
| 100220212 | TBP | C1orf55 | GTF2B |
9.6064 | <0.001 |
| 100110222 | RAD23B | UBB | CEBPB |
7.4253 | <0.001 |
| 100110222 | RAD23B | TAF1 | ZFAND5 |
6.9660 | <0.001 |
| 100220222 | SMC3 | CEBPB | TRIB1 | 13.4760 | <0.001 |
| 100110222 | IQCG | MAX | BAT3 | 10.7233 | <0.001 |
| 100110222 | TCF12 | FADD | CFLAR |
6.8301 | <0.001 |
| 101110022 | SGK1 | SMARCA4 | CREB1 |
8.1492 | <0.001 |
| 100210212 | ETS1 | SP1 |
HIST1H2AE |
6.8723 | <0.001 |
| 100220222 | CTCF | CEBPB | TRIB1 | 12.1933 | <0.001 |
| 100110222 | TAF1 | EIF3D | EIF5 | 15.9259 | <0.001 |
| 100110222 | TAF1 | CSNK2B | EIF5 | 17.2414 | <0.001 |
| 100110222 | TAF1 | EIF4G2 | EIF5 | 17.0751 | <0.001 |
| 100210212 | NR3C1 | CEBPB | TRIB1 | 12.7046 | <0.001 |
| 100220222 | TRIB1 | CEBPB | RAD21 | 14.0708 | <0.001 |
| 100110222 | GATA2 | FOXO3 | SGK1 |
6.8563 |
0.001 |
Functional analysis of genes involved
in the differential network motifs
The 697 genes involved in 1,132 differential network
motifs were enriched in 154 GO terms, including 21 molecular
function terms, 14 cellular component terms and 119 biological
process (BP) terms, in addition to 14 KEGG pathways and various
cancer pathways, including small cell lung cancer and the
mitogen-activated protein kinase (MAPK) signaling pathway. Numerous
genes were enriched in apoptosis-related BP terms, including
FADD and MYC. Furthermore, 43 genes were enriched in
the KEGG signaling pathway, including FADD and
MAX.
Comparison of the two classification
methods
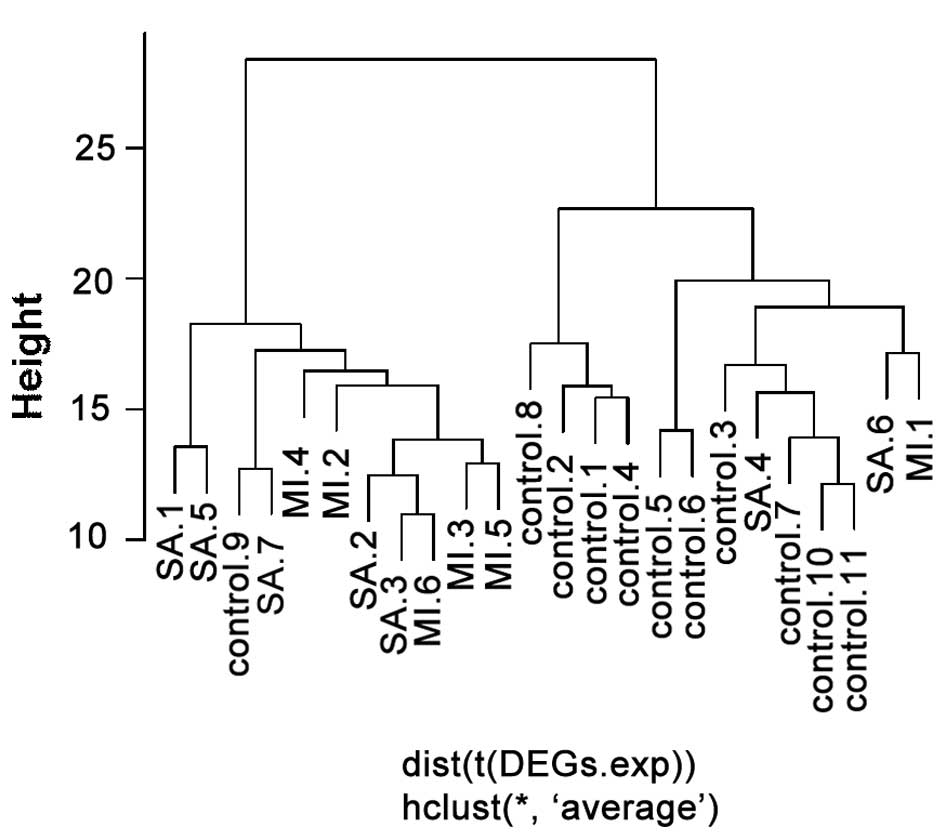
A total of 336 DEGs were screened using the SAM
method. According to the hierarchical clustering based on these 336
DEGs, there was one control sample clustered in the patient group
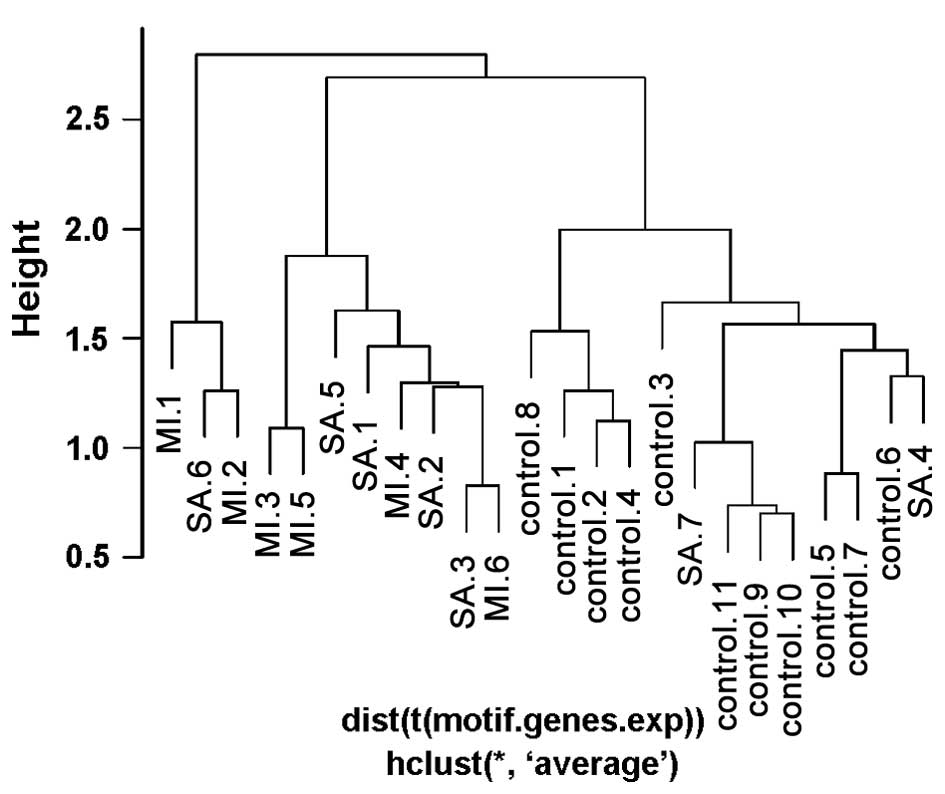
and three patient samples in the control group (Fig. 2). Conversely, according to the
clustering based on the top 20 three-node network motifs, there
were two patient samples in the control group and no control
samples in the patient group (Fig.
3). Therefore, clustering based on the screened network motifs
was demonstrated to be more accurate. Furthermore, only 38 genes in
the top 20 network motifs were used compared with the 336 DGEs used
for the clustering based on individual genes.
Discussion
In the present study, 1,132/9,008 network motifs
revealed a significant difference between the CAD group and the
normal control, indicating that the aforementioned motifs may be
associated with the occurrence of CAD.
Several studies have identified apoptosis in
atherosclerosis, which is a typical pathological feature in
patients with CAD (22–24). Various genes were demonstrated to be
enriched in apoptosis regulation-related BP terms in the present
study, including FADD. Previously, FADD was observed
to have a role in cancer pathways (25). It was demonstrated that FADD,
together with CASP8 and FADD-like apoptosis regulator
(CFLAR), was regulated by transcription factor 12
(TCF12) in a network motif. FADD mediates a death
signaling pathway via its binding to the death domain of the Fas
receptor (26), followed by the
recruitment of CASP8. CFLAR encodes c-FLIP, which is
a protein that regulates apoptosis and is structurally similar to
caspase-8, yet possesses no caspase activity. c-FLIP is able to
interfere with the death receptor signaling pathways via binding to
FADD (27). c-FLIP expression
has been reported in the smooth muscle cells of normal human
coronary arteries and the downregulation of c-FLIP was observed in
human atherosclerotic atheroma (28). As the two co-expressed genes are both
regulated by TCF12, which encodes a protein belonging to the
basic helix-loop-helix (bHLH) E-protein family that recognizes the
consensus binding site (E-box) CANNTG, this transcription factor
may be associated with the occurrence of CAD.
BAT3 (also known as BAG6), which is a member
of the Bcl-2 associated anthanogene family of proteins, has also
been reported to regulate apoptosis via modulating
ubiquitin-mediated proteolysis of the Xenopus elongation
factor Xenopus laevis elongation factor 1α oocyte form in
Xenopus embryos (29).
However, to the best of our knowledge, its role in atherosclerosis
has yet to be reported. In the motifs consisting of IQCG, MAX and
BAT3, they are regulated by MAX. MAX encodes a
transcription factor belonging to the bHLH leucine zipper family,
which is a binding partner of c-Myc (30). c-Myc/MAX expression has been observed
to be elevated by oxidized low-density lipoprotein, which is able
to promote atherogenesis (31). In
the present study, MAX was also demonstrated to function in
CAD via cancer pathways, including small cell lung cancer and MAPK
signaling pathways. IQCG was the second gene regulated by
MAX. As it is co-expressed with BAT3, it is likely that this
gene may also have a role in apoptosis.
Furthermore, dyslipidemia is also recognized as an
important risk factor for CAD in the general population (32). The upstream stimulatory factor family
USF1/2 is a major transcription factor family that
bind their target genes via the E-box element (33). USF1, is responsible for
governing numerous genes involved in lipid and glucose metabolism
(34), and has been confirmed to
contribute to aortic atherosclerosis (35). However, the role of USF2 in
atherosclerosis has seldom been reported. ZNF507 was
observed to display a significant alteration in expression levels
in response to elevated levels of homocysteine (36), which is considered to increase the
risk of atherosclerosis (37). As
the two transcription factors were co-expressed in the network
motif, it may be inferred that USF2 also has a role in
atherosclerosis.
In conclusion, at least one gene in the screened
network motif was associated with the pathological characteristics
occurring in patients with CAD; thus, there is sufficient evidence
to indicate that these screened network motifs may be useful as
markers for identifying CAD. Further consolidation was provided by
the clustering results, which revealed that the network motif-based
method was more accurate and efficient, as compared with the
conventional method based on individual DEGs. Therefore, the
network motif-based method in combination with gene expression data
may be a promising method for the diagnosis of CAD.
References
|
1.
|
Gaziano TA, Bitton A, Anand S,
Abrahams-Gessel S and Murphy A: Growing epidemic of coronary heart
disease in low- and middle-income countries. Curr Probl Cardiol.
35:72–115. 2010. View Article : Google Scholar : PubMed/NCBI
|
|
2.
|
Jaarsma C, Leiner T, Bekkers SC, Crijns
HJ, Wildberger JE, Nagel E, Nelemans PJ and Schalla S: Diagnostic
performance of noninvasive myocardial perfusion imaging using
single-photon emission computed tomography, cardiac magnetic
resonance, and positron emission tomography imaging for the
detection of obstructive coronary artery disease: A meta-analysis.
J Am Coll Cardiol. 59:1719–1728. 2012. View Article : Google Scholar : PubMed/NCBI
|
|
3.
|
Beltrame JF, Dreyer R and Tavella R:
Epidemiology of coronary artery disease. Coronary Artery Disease -
Current Concepts in Epidemiology, Pathophysiology, Diagnostics and
Treatment. Gaze D: (Rijeka). InTech. 1–30. 2012.
|
|
4.
|
Semmlow J and Rahalkar K: Acoustic
detection of coronary artery disease. Annu Rev Biomed Eng.
9:449–469. 2007. View Article : Google Scholar : PubMed/NCBI
|
|
5.
|
Chen L, Qu X, Cao M, Zhou Y, Li W, Liang
B, Li W, He W, Feng C, Jia X and He Y: Identification of breast
cancer patients based on human signaling network motifs. Sci Rep.
3:33682013.PubMed/NCBI
|
|
6.
|
Doncic A and Skotheim JM: Feedforward
regulation ensures stability and rapid reversibility of a cellular
state. Mol Cell. 50:856–868. 2013. View Article : Google Scholar : PubMed/NCBI
|
|
7.
|
Albert I and Albert R: Conserved network
motifs allow protein-protein interaction prediction.
Bioinformatics. 20:3346–3352. 2004. View Article : Google Scholar : PubMed/NCBI
|
|
8.
|
Itzkovitz S, Levitt R, Kashtan N, Milo R,
Itzkovitz M and Alon U: Coarse-graining and self-dissimilarity of
complex networks. Phys Rev E Stat Nonlin Soft Matter Phys.
71:0161272005. View Article : Google Scholar : PubMed/NCBI
|
|
9.
|
Kalir S, McClure J, Pabbaraju K, Southward
C, Ronen M, Leibler S, Surette MG and Alon U: Ordering genes in a
flagella pathway by analysis of expression kinetics from living
bacteria. Science. 292:2080–2083. 2001. View Article : Google Scholar : PubMed/NCBI
|
|
10.
|
Wingrove JA, Daniels SE, Sehnert AJ,
Tingley W, Elashoff MR, Rosenberg S, Buellesfeld L, Grube E, Newby
LK, Ginsburg GS and Kraus WE: Correlation of peripheral-blood gene
expression with the extent of coronary artery stenosis. Circ
Cardiovasc Gene. 1:31–38. 2008. View Article : Google Scholar
|
|
11.
|
Sinnaeve PR, Donahue MP, Grass P, Seo D,
Vonderscher J, Chibout SD, Kraus WE, Sketch M Jr, Nelson C and
Ginsburg GS: Gene expression patterns in peripheral blood correlate
with the extent of coronary artery disease. PLoS One. 4:e70372009.
View Article : Google Scholar : PubMed/NCBI
|
|
12.
|
Subramanian A, Tamayo P, Mootha VK,
Mukherjee S, Ebert BL, Gillette MA, Paulovich A, Pomeroy SL, Golub
TR, Lander ES and Mesirov JP: Gene set enrichment analysis: A
knowledge-based approach for interpreting genome-wide expression
profiles. P Natl Acad Sci USA. 102:15545–15550. 2005. View Article : Google Scholar
|
|
13.
|
Ferrari F, Bortoluzzi S, Coppe A, Sirota
A, Safran M, Shmoish M, Ferrari S, Lancet D, Danieli GA and
Bicciato S: Novel definition files for human GeneChips based on
GeneAnnot. BMC Bioinformatics. 8:4462007. View Article : Google Scholar : PubMed/NCBI
|
|
14.
|
Gerstein MB, Kundaje A, Hariharan M, Landt
SG, Yan KK, Cheng C, Mu XJ, Khurana E, Rozowsky J, Alexander R, et
al: Architecture of the human regulatory network derived from
ENCODE data. Nature. 489:91–100. 2012. View Article : Google Scholar : PubMed/NCBI
|
|
15.
|
Peri S, Navarro JD, Kristiansen TZ,
Amanchy R, Surendranath V, Muthusamy B, Gandhi TK, Chandrika KN,
Deshpande N, Suresh S, et al: Human protein reference database as a
discovery resource for proteomics. Nucleic Acids Res. 32:D497–D501.
2004. View Article : Google Scholar : PubMed/NCBI
|
|
16.
|
Wernicke S and Rasche F: FANMOD: A tool
for fast network motif detection. Bioinformatics. 22:1152–1153.
2006. View Article : Google Scholar : PubMed/NCBI
|
|
17.
|
Hummel M, Meister R and Mansmann U:
GlobalANCOVA: Exploration and assessment of gene group effects.
Bioinformatics. 24:78–85. 2008. View Article : Google Scholar : PubMed/NCBI
|
|
18.
|
Aoki KF and Kanehisa M: Using the KEGG
database resource. Curr Protoc Bioinformatics Unit.
1:1.12.1–1.12.43. 2005.
|
|
19.
|
Dimmer EC, Huntley RP, Alam-Faruque Y,
Sawford T, O'Donovan C, Martin MJ, Bely B, Browne P, Mun Chan W and
Eberhardt R: The UniProt-GO annotation database in 2011. Nucleic
Acids Res. 40:D565–D570. 2012. View Article : Google Scholar : PubMed/NCBI
|
|
20.
|
Dennis G Jr, Sherman BT, Hosack DA, Yang
J, Gao W, Lane HC and Lempicki RA: DAVID: Database for annotation,
visualization, and integrated discovery. Genome Biol. 4:32003.
View Article : Google Scholar
|
|
21.
|
Larsson O, Wahlestedt C and Timmons JA:
Considerations when using the significance analysis of microarrays
(SAM) algorithm. BMC Bioinformatics. 6:1292005. View Article : Google Scholar : PubMed/NCBI
|
|
22.
|
Bennett MR: Apoptosis of vascular smooth
muscle cells in vascular remodelling and atherosclerotic plaque
rupture. Cardiovasc Res. 41:361–368. 1999. View Article : Google Scholar : PubMed/NCBI
|
|
23.
|
Kockx MM: Apoptosis in the atherosclerotic
plaque quantitative and qualitative aspects. Arterioscler Thromb
Vasc Biol. 18:1519–1522. 1998. View Article : Google Scholar : PubMed/NCBI
|
|
24.
|
Bennett MR, Evan GI and Schwartz SM:
Apoptosis of human vascular smooth muscle cells derived from normal
vessels and coronary atherosclerotic plaques. J Clin Invest.
95:22661995. View Article : Google Scholar : PubMed/NCBI
|
|
25.
|
Chinnaiyan AM, Tepper CG, Seldin MF,
O'Rourke K, Kischkel FC, Hellbardt S, Krammer PH, Peter ME and
Dixit VM: FADD/MORT1 is a common mediator of CD95 (Fas/APO-1) and
tumor necrosis factor receptor-induced apoptosis. J Biol Chem.
271:4961–4965. 1996. View Article : Google Scholar : PubMed/NCBI
|
|
26.
|
Chinnaiyan AM, O'Rourke K, Tewari M and
Dixit VM: FADD, a novel death domain-containing protein, interacts
with the death domain of Fas and initiates apoptosis. Cell.
81:505–512. 1995. View Article : Google Scholar : PubMed/NCBI
|
|
27.
|
Schneider P, Thome M, Burns K, Bodmer J-L,
Hofmann K, Kataoka T, Holler N and Tschopp J: TRAIL receptors 1
(DR4) and 2 (DR5) signal FADD-dependent apoptosis and activate
NF-kappaB. Immunity. 7:831–836. 1997. View Article : Google Scholar : PubMed/NCBI
|
|
28.
|
Imanishi T, McBride J, Ho Q, O'Brien KD,
Schwartz SM and Han DK: Expression of cellular FLICE-inhibitory
protein in human coronary arteries and in a rat vascular injury
model. Am J Pathol. 156:125–137. 2000. View Article : Google Scholar : PubMed/NCBI
|
|
29.
|
Minami R, Shimada M, Yokosawa H and
Kawahara H: Scythe regulates apoptosis through modulating
ubiquitin-mediated proteolysis of the Xenopus elongation factor
XEF1AO. Biochem J. 405:495–501. 2007. View Article : Google Scholar : PubMed/NCBI
|
|
30.
|
Witztum JL and Steinberg D: Role of
oxidized low density lipoprotein in atherogenesis. J Clin Invest.
88:1785–1792. 1991. View Article : Google Scholar : PubMed/NCBI
|
|
31.
|
de Nigris F, Youssef T, Ciafré S, Franconi
F, Anania V, Condorelli G, Palinski W and Napoli C: Evidence for
oxidative activation of c-Myc-dependent nuclear signaling in human
coronary smooth muscle cells and in early lesions of Watanabe
heritable hyperlipidemic rabbits: Protective effects of vitamin E.
Circulation. 102:2111–2117. 2000. View Article : Google Scholar : PubMed/NCBI
|
|
32.
|
Goff DC, Bertoni AG, Kramer H, Bonds D,
Blumenthal RS, Tsai MY and Psaty BM: Dyslipidemia prevalence,
treatment, and control in the Multi-Ethnic Study of Atherosclerosis
(MESA): Gender, ethnicity, and coronary artery calcium.
Circulation. 113:647–656. 2006. View Article : Google Scholar : PubMed/NCBI
|
|
33.
|
Sellak H, Choi C, Browner N and Lincoln
TM: Upstream stimulatory factors (USF-1/USF-2) regulate human
cGMP-dependent protein kinase I gene expression in vascular smooth
muscle cells. J Biol Chem. 280:18425–18433. 2005. View Article : Google Scholar : PubMed/NCBI
|
|
34.
|
Naukkarinen J, Gentile M, Soro-Paavonen A,
Saarela J, Koistinen HA, Pajukanta P, Taskinen M-R and Peltonen L:
USF1 and dyslipidemias: Converging evidence for a functional
intronic variant. Hum Mol Genet. 14:2595–2605. 2005. View Article : Google Scholar : PubMed/NCBI
|
|
35.
|
Laurila P-P, Naukkarinen J, Kristiansson
K, Ripatti S, Kauttu T, Silander K, Salomaa V, Perola M, Karhunen
PJ, Barter PJ, et al: Genetic association and interaction analysis
of USF1 and APOA5 on lipid levels and atherosclerosis. Arterioscler
Thromb Vasc Biol. 30:346–352. 2010. View Article : Google Scholar : PubMed/NCBI
|
|
36.
|
Rosenquist TH, Bennett GD, Brauer PR,
Stewart ML, Chaudoin TR and Finnell RH: Microarray analysis of
homocysteine-responsive genes in cardiac neural crest cells in
vitro. Dev Dyn. 236:1044–1054. 2007. View Article : Google Scholar : PubMed/NCBI
|
|
37.
|
McCully KS: The biomedical significance of
homocysteine. J Sci Explor. 15:5–20. 2001.
|