Introduction
Parkinson's disease (PD) is an insidious
neurodegenerative condition that is difficult to diagnose as its
early symptoms are easily confused with those of Parkinson's
syndrome, Parkinson-plus syndrome and idiopathic tremor (1). Over time, the pathogenic mechanisms of
PD cause severe damage to dopaminergic neurons in the midbrain, and
clinical symptoms are difficult to control (2).
Single-photon emission computed tomography (SPECT)
and positron emission tomography scans (PET) are the most sensitive
and specific methods for diagnosing PD and evaluating treatment
efficacy (3). However, they are
difficult to implement in clinical practice as they are expensive
and use high doses of radiation. In recent years, more powerful
magnetic resonance imaging (MRI) technology, particularly
functional MRI, has offered more sensitive signals, sharper images
of brain structures, and information concerning microscopic
features and physiological metabolism. These new MRI methods have
the ability to provide new insights into PD (4). The present study aimed to explore new
methods of early PD diagnosis and treatment evaluation using
susceptibility-weighted imaging (SWI) and diffusion tensor imaging
(DTI).
Iron deposition increases in the brain of patients
with PD, predominantly in the form of ferritin and particularly in
oligodendrocytes, in addition to in neurons and microglia (5). Typical sites of iron deposition include
the globus pallidum, substantia nigra, and the red and dentate
nuclei. Ferritin is paramagnetic; therefore, SWI filtered-phase
images are particularly suitable for showing increased iron content
in the brain (6). Abnormally
elevated iron levels are evident in many neurodegenerative
disorders, including PD (7).
Materials and methods
Patients
The present study included 30 right-handed patients
with PD (12 males and 18 females) who were examined at the
Affiliated Hospital of Inner Mongolia Medical University (Hohhot,
China) between April 2013 and March 2015. The ages of the patients
ranged from 58 to 74 years with a mean of 67.17 years. The range of
disease duration was from 4.6 to 11 years with a mean of 6.89
years. Unilateral symptomatic patients graded 1.0–1.5 with the
Hoehn and Yahr rating scale (8) were
included in the PD group. The PD group was compared with 30 healthy
age- and gender-matched individuals in the normal control (NC)
group. The present study was approved by the Ethics Committee of
Inner Mongolia Medical University and informed consent was obtained
from each participant.
Imaging
MRI data were collected using a 3.0-Tesla scanner
(GE Signa HDx; GE Healthcare, Milwaukee, WI, USA). Conventional
scanning included axial T2-weighted imaging (T2WI)-periodically
rotated overlapping parallel lines with enhanced reconstruction
(PROPELLER), diffusion-weighted imaging (DWI), T1-weighted imaging
(T1WI) and sagittal T1WI to exclude cerebral hemorrhage or
infarction.
SWI scanning was performed using gradient echo type
echo planar imaging (GRE-EPI) sequences [field of view (FOV), 24×24
cm; matrix, 448×438; flip angle, 20°; repetition time (TR) 32 msec;
echo time (TE), 20 msec] with whole-brain coverage using 64 axial
2-mm slices with 0-mm spaces between the slices.
DTI images were also taken (FOV, 24×24 cm; matrix,
128×128; whole brain coverage; flip angle, 138°; TR, 10,000 msec;
TE, 9,518 msec] using 25 directions, and 4-mm slices with 0-mm
spaces between the slices.
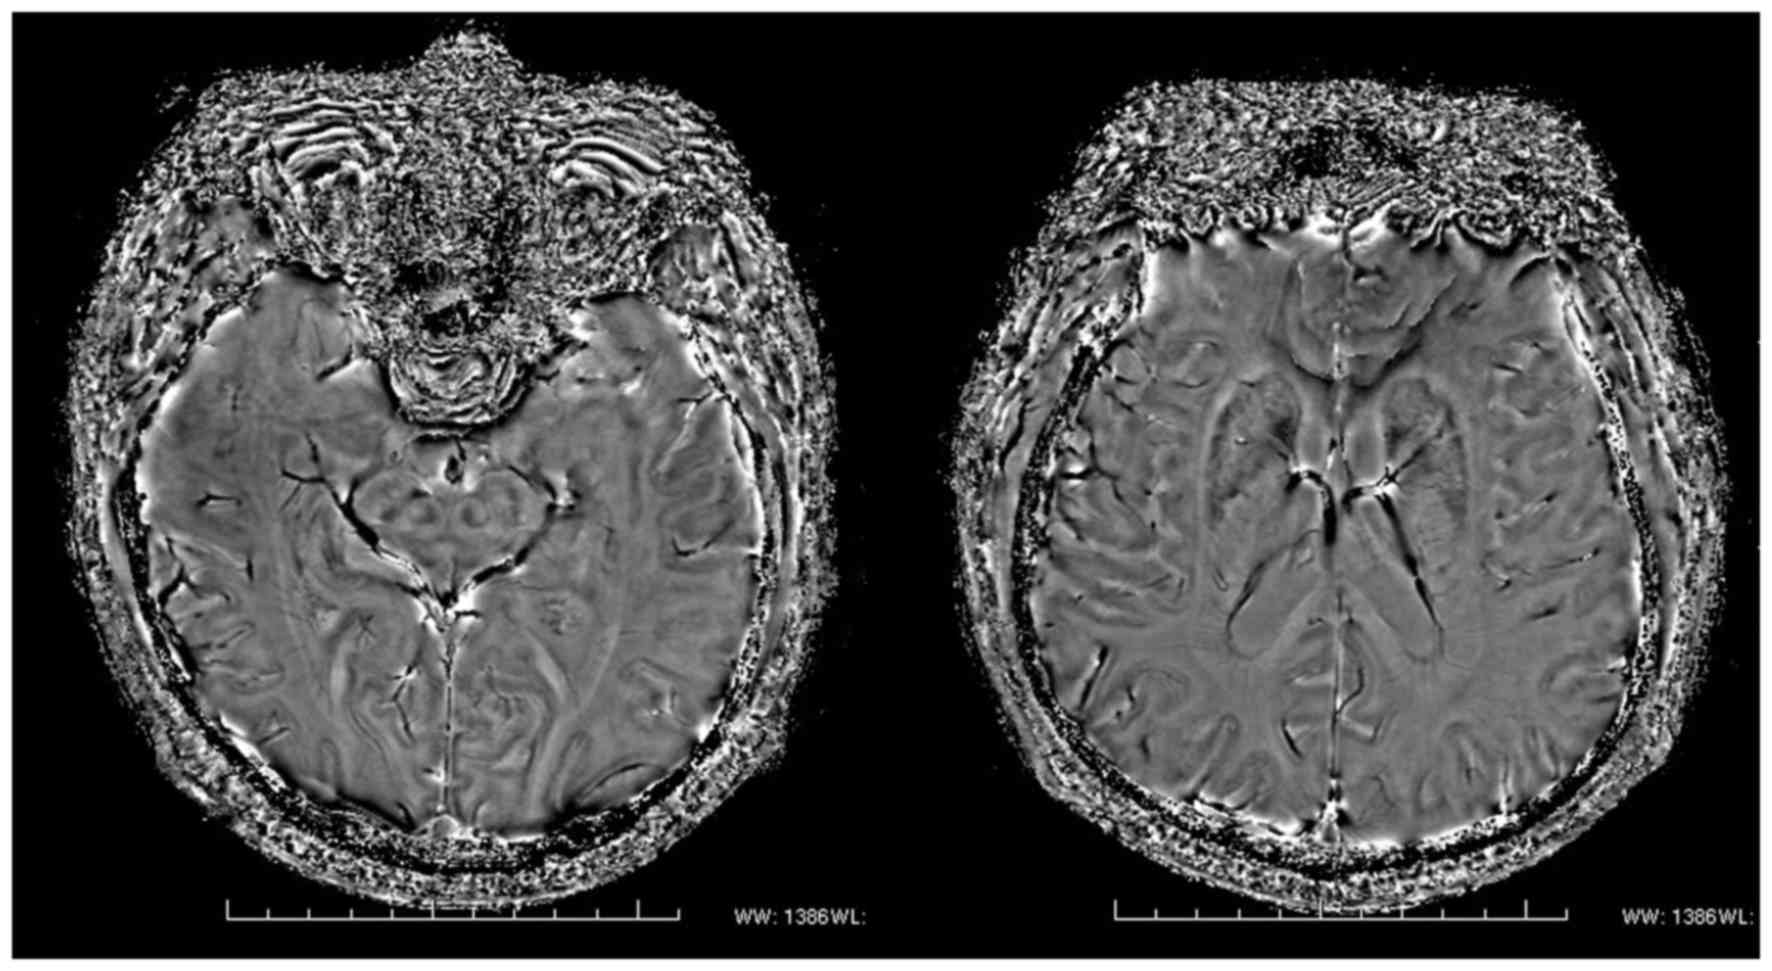
Image processing
For SWI, the region of interest (ROI) was manually
delineated, and the phase values were measured on the corrected
phase diagram (Fig. 1). The layer
showing the areas of interest most clearly and the adjacent upper
and lower layers were selected, and then the ROI was manually
delineated based on the outlines of different brain regions to
obtain the corrected phase (CP) values. Finally, the mean value was
calculated.
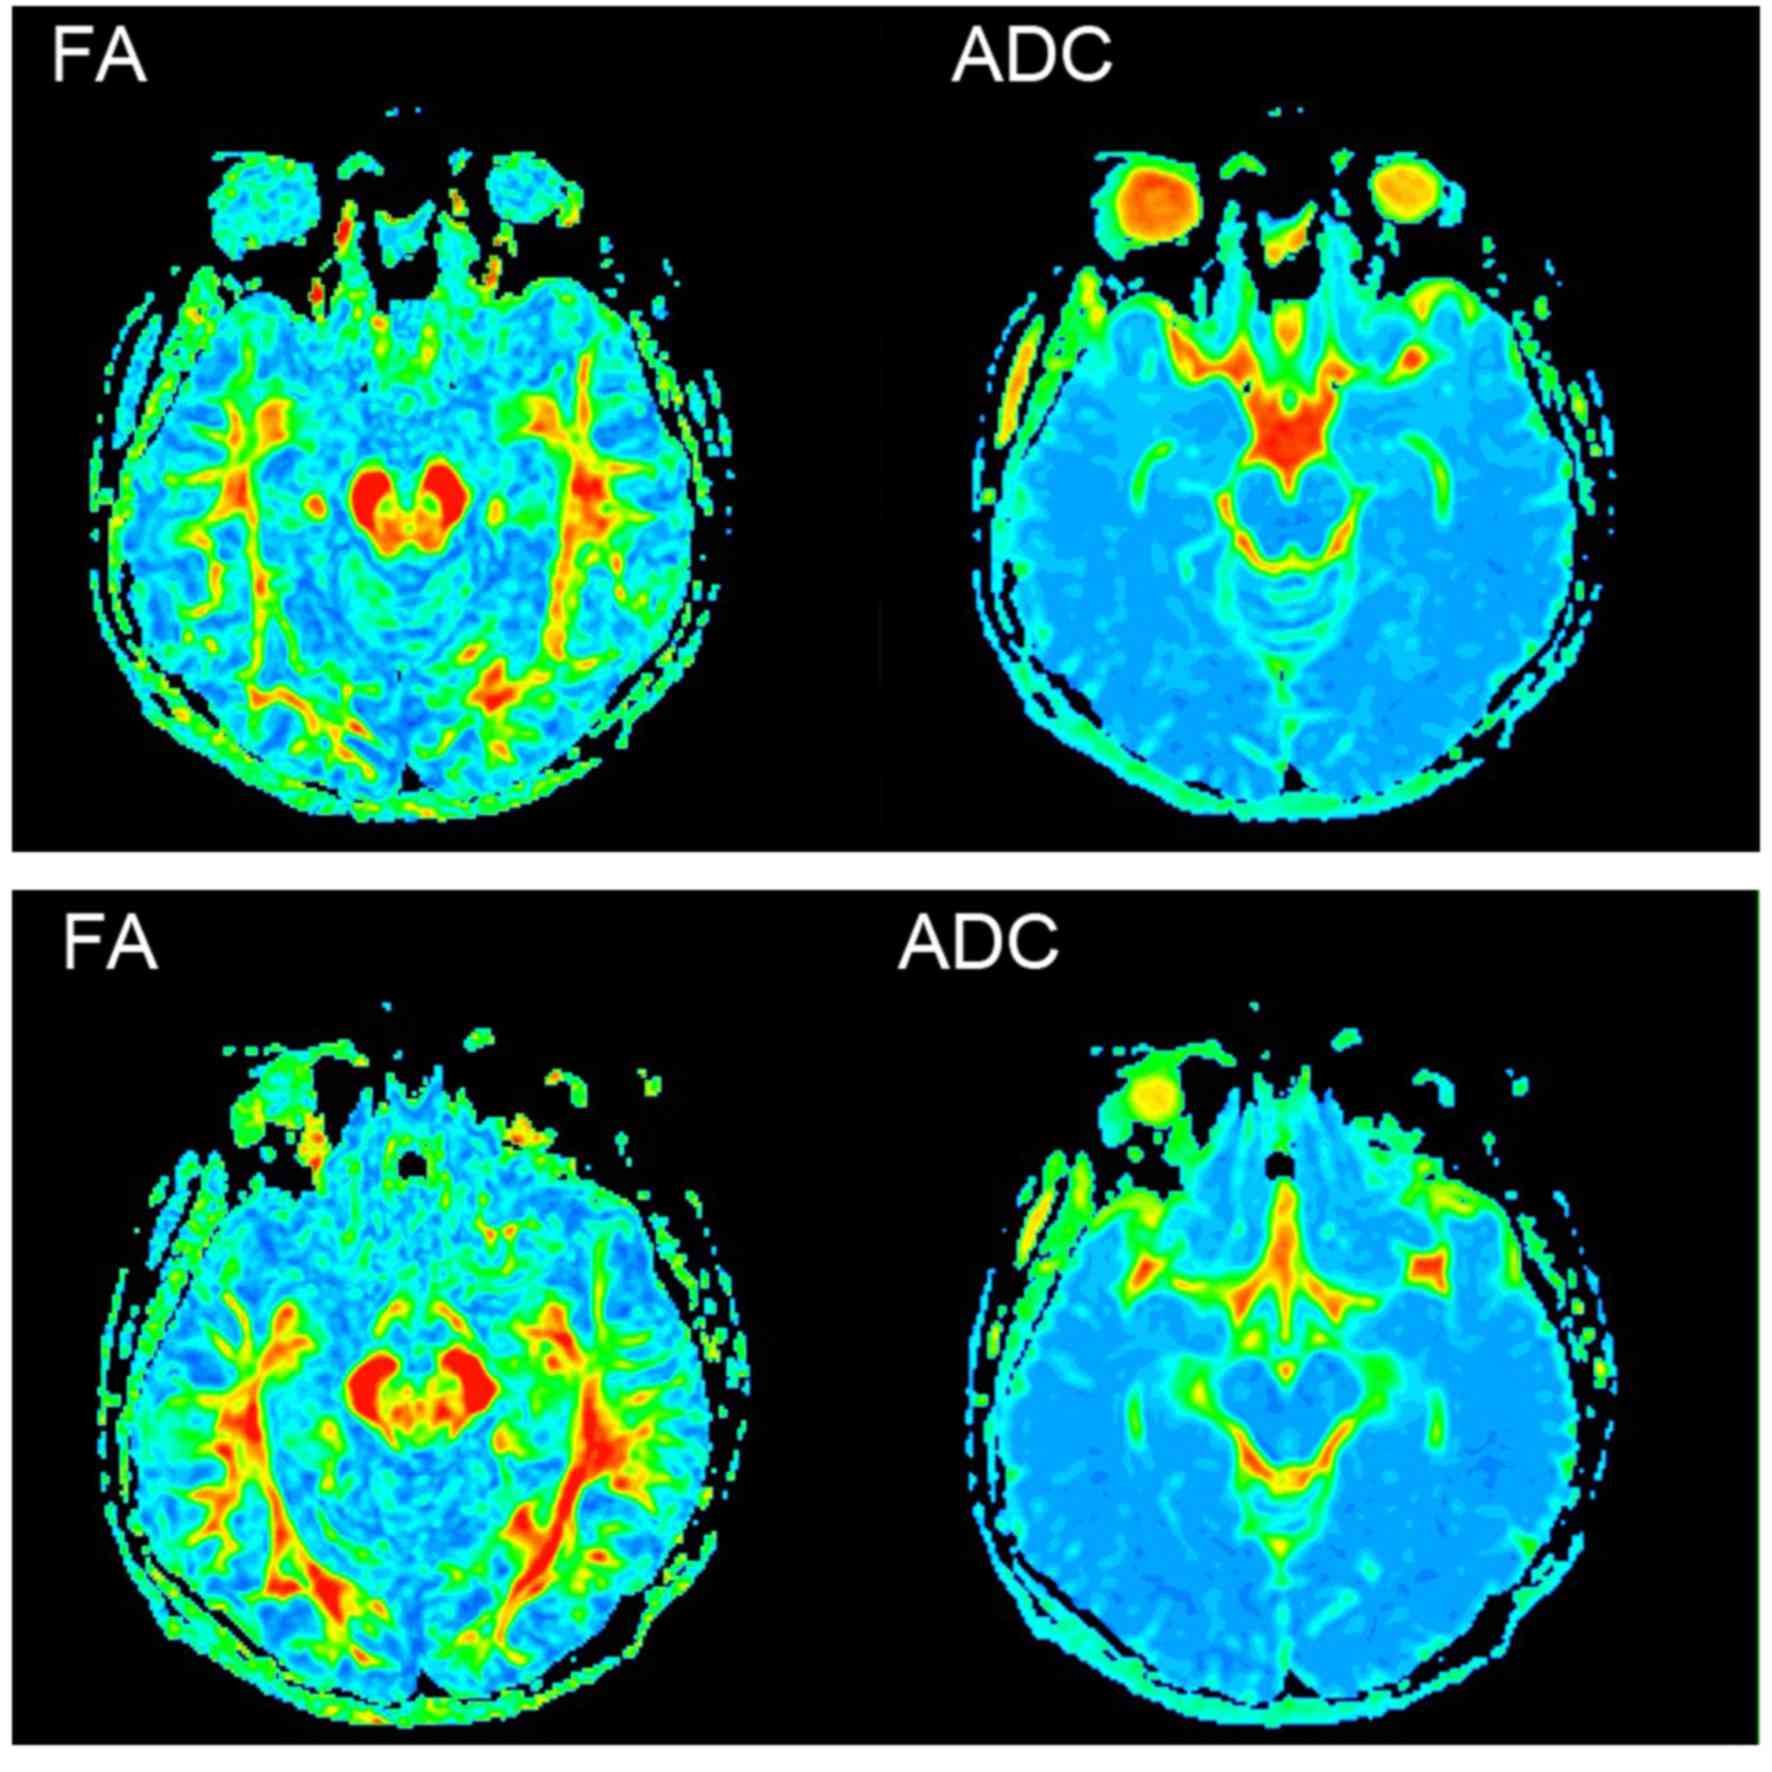
DTI was conducted according to anatomy; the ROIs
were drawn in the layer that showed the biggest, clearest ROI, and
the fractional anisotropy (FA) and apparent diffusion coefficient
(ADC) values were measured concurrently (Fig. 2).
Image quality assessment
Two experienced radiologists independently observed
the SWI sequence magnitude diagrams; evaluated the signal contrast
between the midbrain, basal ganglia nuclei, and the surrounding
tissues, as well as the boundary clarity; and then compared them
with conventional T2WIs and T1WIs to evaluate image quality.
Statistical analysis
Gaussian distribution tests and homogeneity tests
for variance were used to compare the PD and NC groups. The CP, FA
and ADC values of the ROIs in the bilateral substantia nigra (SN),
red nucleus (RN), globus pallidus (GP) and putamen (PUT) were
calculated using independent sample t-tests. The mean values for
each hemisphere were calculated separately. Finally, the CP, FA and
ADC values of different brain regions were compared between the two
groups. SPSS version 14.0 software (SPSS, Inc., Chicago, IL, USA)
was used for all analyses, and P<0.05 was considered to indicate
a statistically significant difference.
Results
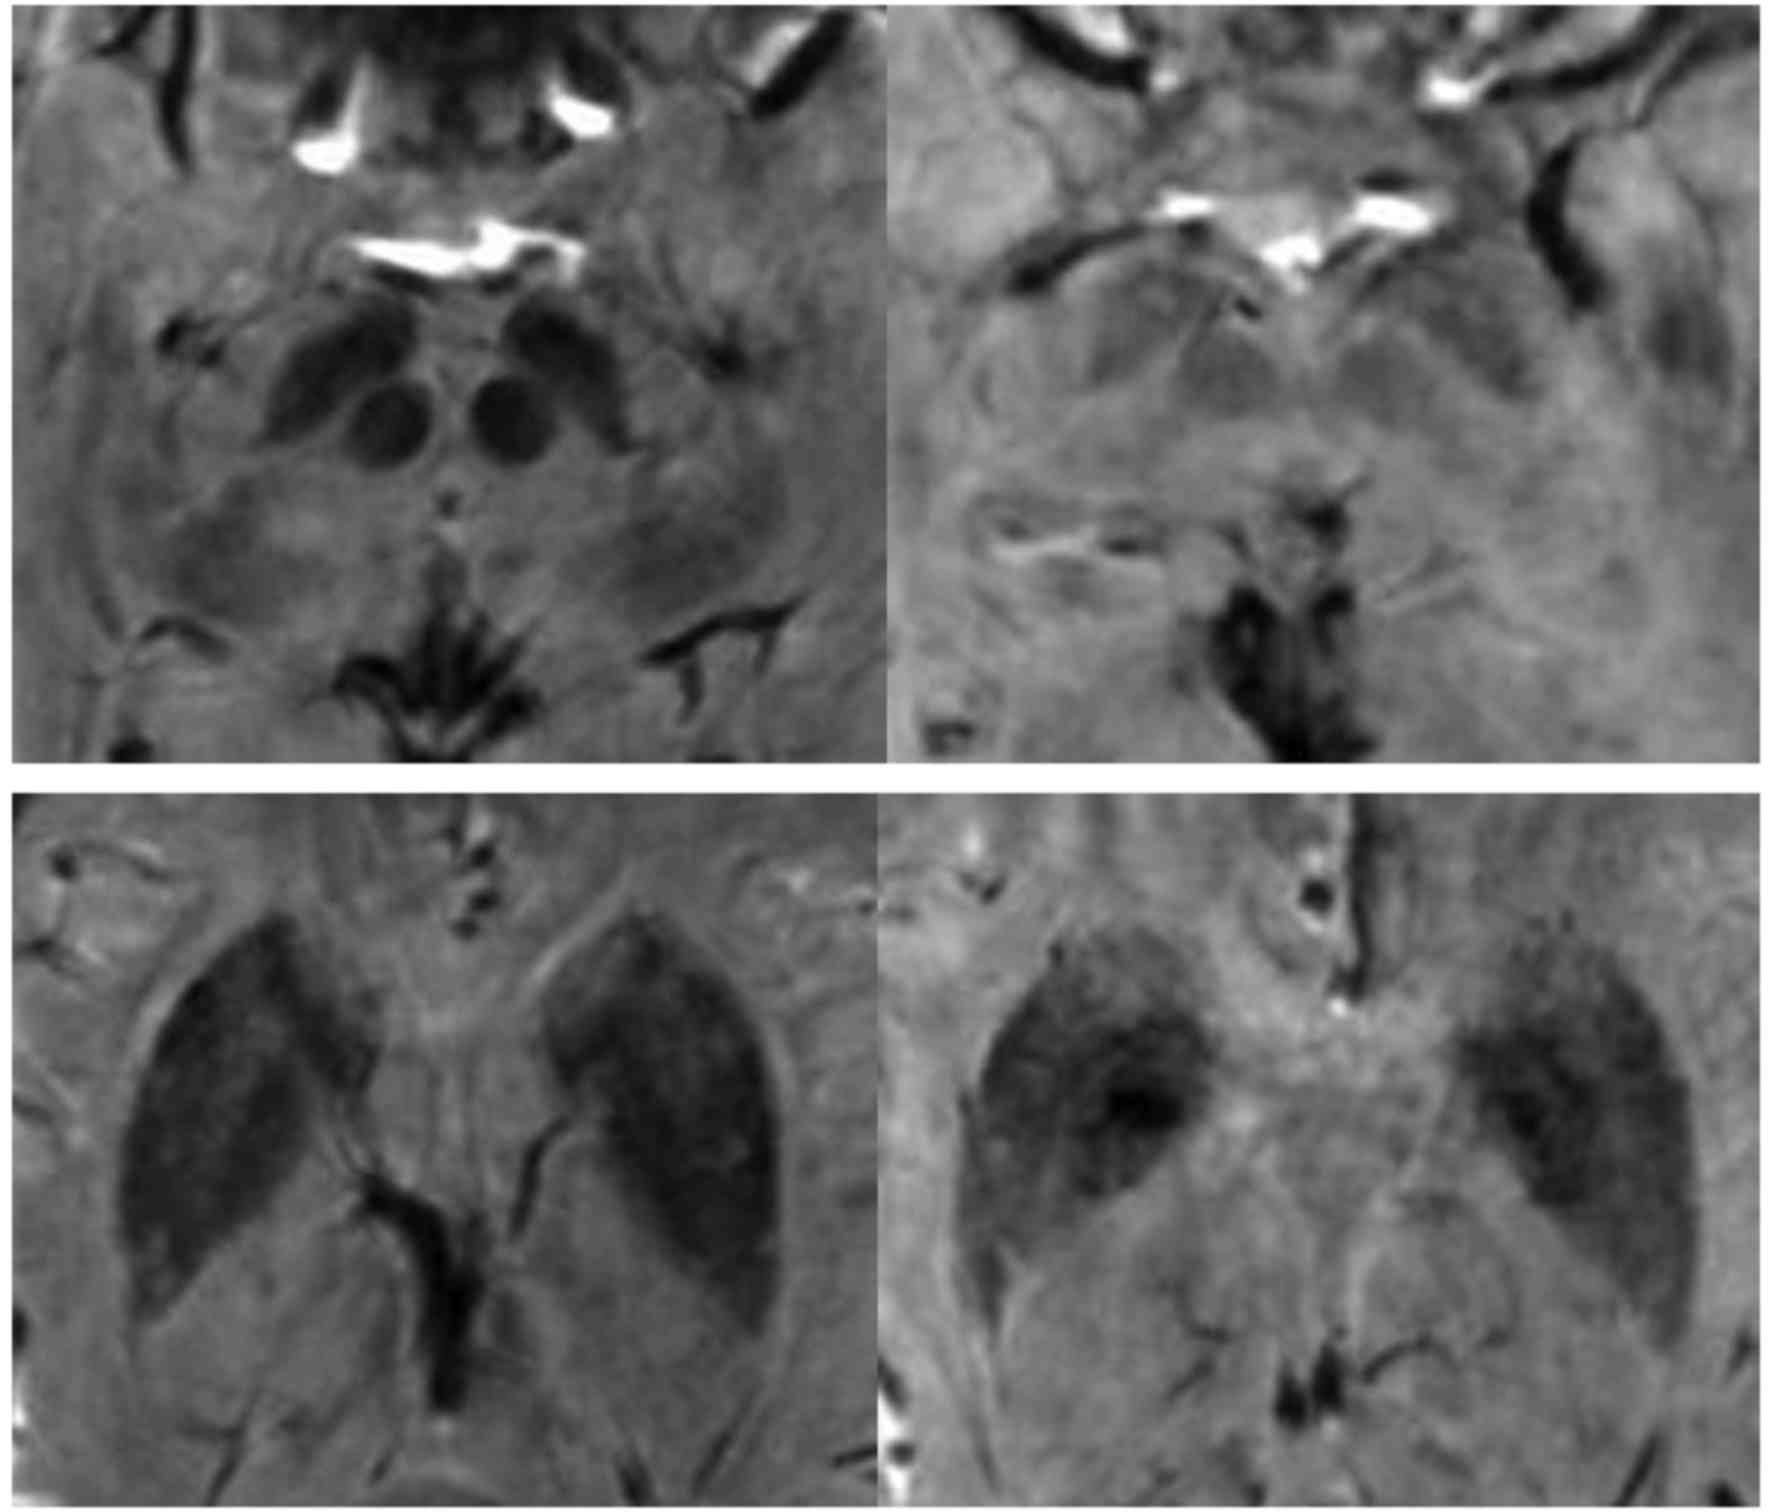
Image quality assessment
The results of image quality assessment showed that
the small gray matter nuclei were displayed more clearly in the
magnitude diagrams than in the corrected phase diagram and DTI, and
the midbrain and basal ganglia nuclei were detectable in the
magnitude diagrams. Furthermore, the reduced signal intensities in
the PD group indicated that there was significant iron deposition
in the nuclei of the PD group in comparison with the NC group
(Fig. 3).
CP value comparisons
The CP values of the SN, RN and PUT in the PD group
were significantly different from the corresponding values of the
control group (all P<0.05). Specifically, the CP values in all
three locations were significantly decreased, and the iron
deposition increased, compared with those in the control group.
There was no significant difference between the PD and control
groups in the CP values of the GP (P>0.05; Table I).
 | Table I.Comparison of CP values between
healthy controls and patients with PD (mean ± standard
deviation). |
Table I.
Comparison of CP values between
healthy controls and patients with PD (mean ± standard
deviation).
| Brain region | NC group | PD group | t | P-value |
|---|
| SN | 1,940.735±18.021 | 1,871.619±61.924 | −3.410 | 0.002 |
| RN | 1,969.810±36.901 | 1,854.905±73.138 | −4.502 | <0.001 |
| GP | 1,948.959±17.092 | 1,903.532±84.312 | −1.913 | 0.075 |
| PUT | 2,014.891±35.997 | 1,954.218±37.235 | −3.786 | 0.001 |
FA and ADC value comparisons
The FA values of the SN and PUT in the PD group were
observed to be significantly decreased compared with those in the
control group (P<0.05). However, there was no significant
difference in the FA value of the GP (P>0.05; Table II), and there were no significant
inter-group differences for any of the ADC values (P>0.05;
Table III).
| Table II.Comparison of FA values between
healthy controls and patients with PD (mean ± standard
deviation). |
Table II.
Comparison of FA values between
healthy controls and patients with PD (mean ± standard
deviation).
| Brain region | NC group | PD group | t | P-value |
|---|
| SN | 0.650±0.071 | 0.374±0.095 | −5.013 | <0.001 |
| RN | 0.434±0.060 | 0.494±0.215 | 2.089 | 0.052 |
| GP | 0.412±0.054 | 0.367±0.088 | −0.958 | 0.319 |
| PUT | 0.271±0.045 | 0.291±0.029 | −3.069 | 0.004 |
| Table III.Comparison of the ADC values between
healthy controls and patients with PD (mean ± standard
deviation). |
Table III.
Comparison of the ADC values between
healthy controls and patients with PD (mean ± standard
deviation).
| Brain region | NC group | PD group | t | P-value |
|---|
| SN | 8.426±0.241 | 8.503±0.649 | 0.204 | 0.814 |
| RN | 6.842±0.462 | 7.066±0.797 | 0.962 | 0.346 |
| GP | 8.123±0.353 | 8.314±0.396 | 1.475 | 0.191 |
| PUT | 7.465±0.290 | 7.589±0.372 | 1.582 | 0.143 |
Discussion
PD is primarily characterized by striatonigral
pathway degeneration; dopamine (DA) and acetylcholine (Ach)
signaling are compromised during the subclinical stage, but the
patient might not exhibit symptoms due to striatal compensations,
including increased DA receptor sensitivity and enhanced neuronal
excitability (9). It has been
reported that patients with PD manifest clinical symptoms when 50%
of dopaminergic neurons in the SN are lost (10), which indicates that pathological
changes in the SN occur prior to overt disease. This underscores
the need to develop effective methods to monitor pathological
changes in the SN and design early interventions for PD.
A growing body of research indicates that abnormal
brain iron deposition occurs in several neurodegenerative
conditions including PD, multiple system atrophy, multiple
sclerosis, and Alzheimer's disease (11). In vivo measurement of brain
iron concentrations might therefore be helpful for the diagnosis of
these diseases and for predicting the prognoses of patients.
In the present study, SWI magnitude diagrams and
phase diagrams showed significantly weaker signals in the SN, RN,
GP and posterolateral PUT for the PD group compared with the
control group, suggesting increased iron deposition in these
regions. Conventional MRI confirmed uneven brain iron
distributions.
The CP values of the SN, RN and PUT were
significantly decreased in the PD group compared with the NC group,
but there was not a significant difference in CP values of the GP
between the two groups. This indicates that pathological iron
deposition was more severe in SN, RN, and PUT. This result is also
consistent with a previous study (12), and confirms the inhomogeneity and
region selectivity of PD-related brain iron deposition. Excessive
iron ions catalyze reactions that induce oxidative stress,
ultimately generating free radicals that selectively damage
dopaminergic neurons in the SN (13). However, it is unclear whether iron
deposition in these sites directly induces PD mechanisms. Further
investigation of abnormal iron deposition in these areas might
clarify the pathogenesis and clinical symptom progression of
PD.
SWI is able to detect abnormal iron deposition in
extrapyramidal gray nuclei (14). As
mentioned above, abnormal iron levels are not unique to PD. A
number of neurodegenerative diseases are characterized by abnormal
increases in brain iron content; however, the deposition sites vary
in different diseases (15). Iron
deposition has also been shown to occur in the cerebrovasculature,
particularly in elderly patients (3). It has been hypothesized that the
increase in brain iron content might be due to age-associated micro
bleeds that lead to the deposition of hemosiderin (16), and it cannot be excluded that
increased iron levels in the PD-affected brain are due to this
phenomenon. In addition, CP values might also be affected by other
materials with high magnetic susceptibility. For the reasons cited
above, it is necessary use other methods in combination with SWI to
provide more accurate and objective data. The use of DTI for PD has
improved in recent years; changes in microscopic tissue structure
and function can be sensitively detected, allowing accurate
monitoring of the SN and other brain regions affected in PD.
The main pathological characteristic of PD is
degeneration of striatonigral pathways. The SN is the brain area
that is most seriously damaged in this disease (17); dopaminergic neuron loss is most
evident in the pars compacta region of the SN. Yoshikawa et
al (18) described significantly
decreased FA values for the striatonigral pathway projection fibers
(connecting the SN and the lower part of the striatum) and SN of
patients with PD. The results of the present study are consistent
with this. FA is a measure of the diffusion anisotropy of water
molecules and can be used quantify the integrity of neuron
membranes and myelinated fibers, as well the arrangement of white
matter tracts (19). The decreased
FA values in the SN of PD patients might be due to: i) Ferritin
deposition affecting dopaminergic neuron function, ii) axonal
dysfunction or loss of dopaminergic neurons in the SN, iii)
microglia proliferation-induced disorder in white matter fiber
arrangement and/or structure, and/or iv) multiple factors
influencing reduced anisotropy of the local tissue (20). The neuropathological changes in the
SN of PD patients are partially due to the aforementioned reasons.
In the present study, significant differences in FA values of the
SN between the PD and NC groups were identified, suggesting that
changes in neuronal structure or function can be detected early in
the disease. Therefore, FA values of the SN could be used as a
diagnostic biomarker of subclinical or early PD. Yoshikawa et
al (18) proposed that more than
half of dopaminergic neurons in the striatonigral projection system
have already died when PD symptoms develop. Therefore, DTI could be
helpful in providing earlier diagnoses and maximizing the treatment
window. Changes in SN microstructure in early PD patients can be
reflected by abnormal FA values since decreased FA is negatively
correlated with disease progression.
It is hypothesized that decreased FA values in the
context of neurodegenerative disease might be associated with
neuronal loss, reactive astrocyte proliferation, and axon
demyelination, and other factors (21). Thus it is necessary to identify
specific factors that lead to changes in FA. According to the
principles of DTI, changes in tissue susceptibility, for example,
increased iron content in SN, could significantly alter diffusion
signals. In the present study, the average CP value was positively
linearly correlated with the FA value of the SN but not that of the
PUT in the PD group. This finding suggests that reduced FA was
associated with increased iron content in the SN. It also suggests
that pathological PD changes can be monitored by a combination of
DTI and SWI. These modalities could also be helpful in the clinical
diagnosis of PD.
ADC values reflect the rate of diffusion of
extracellular water molecules in a gradient field. No statistically
significant differences in the mean ADC values of the ROIs between
the PD and NC groups were identified in the present study (all
P>0.05), which was consistent with the results from another
study (22). These results suggest
that ADC is not sufficiently sensitive to detect microscopic
structural changes in brain tissue. However, Schocke et al
(23) reported that although there
was no statistically significant difference in the ADC values of
basal ganglia and SN between PD patients and controls, the ADC
values tended to be elevated in patients with more advanced PD.
They therefore concluded that ADC could be useful for assessing
microscopic structural changes in extrapyramidal and motor function
areas.
In conclusion, the diagnosis and assessment of PD
primarily relies on clinical symptoms, and objective evidence is
lacking. High-field MRI is a simple, effective, sensitive, and
noninvasive screening method that can assess abnormal iron
deposition based on CP values and quantitatively assess FA values
of basal nuclei. Therefore, it could provide a basis for exploring
PD pathogenesis and examining pathophysiological changes over time.
Such information could serve as an objective reference for the
clinical diagnosis of PD, thus guiding treatment and improving
patient prognosis.
References
|
1
|
Chen S, Tan HY, Wu ZH, Sun CP, He JX, Li
XC and Shao M: Imaging of olfactory bulb and gray matter volumes in
brain areas associated with olfactory function in patients with
Parkinson's disease and multiple system atrophy. Eur J Radiol.
83:564–570. 2014. View Article : Google Scholar : PubMed/NCBI
|
|
2
|
Aquino D, Contarino V, Albanese A, Minati
L, Farina L, Grisoli M, Romita L, Elia AE, Bruzzone MG and
Chiapparini L: Substantia nigra in Parkinson's disease: A
multimodal MRI comparison between early and advanced stages of the
disease. Neurol Sci. 35:753–758. 2014. View Article : Google Scholar : PubMed/NCBI
|
|
3
|
Ekman U, Eriksson J, Forsgren L, Mo SJ,
Riklund K and Nyberg L: Functional brain activity and presynaptic
dopamine uptake in patients with Parkinson's disease and mild
cognitive impairment: A cross-sectional study. Lancet Neurol.
11:679–687. 2012. View Article : Google Scholar : PubMed/NCBI
|
|
4
|
Youn J, Lee JM, Kwon H, Kim JS, Son TO and
Cho JW: Alterations of mean diffusivity of pedunculopontine nucleus
pathway in Parkinson's disease patients with freezing of gait.
Parkinsonism Relat Disord. 21:12–17. 2015. View Article : Google Scholar : PubMed/NCBI
|
|
5
|
Le W: Role of iron in UPS impairment model
of Parkinson's disease. Parkinsonism Relat Disord. 20:158–161.
2014. View Article : Google Scholar
|
|
6
|
Wu SF, Zhu ZF, Kong Y, Zhang HP, Zhou GQ,
Jiang QT and Meng XP: Assessment of cerebral iron content in
patients with Parkinson's disease by the susceptibility weighted
MRI. Eur Rev Med Pharmacol Sci. 18:2605–2608. 2014.PubMed/NCBI
|
|
7
|
Tae-Hyoung Kim and Jae-Hyeok Lee: Serum
uric acid and nigral iron deposition in Parkinson's disease: A
pilot study. PLoS One. 9:112512–112515. 2014. View Article : Google Scholar
|
|
8
|
Zhang ZX, Roman GC, Hong Z, Wu CB, Qu QM,
Huang JB, Zhou B, Geng ZP, Wu JX, Wen HB, et al: Parkinson's
disease in China: Prevalence in Beijing, Xian, and Shanghai.
Lancet. 365:595–597. 2005. View Article : Google Scholar : PubMed/NCBI
|
|
9
|
Prakash BD, Sitoh YY, Tan LC and Au WL:
Asymmetrical diffusion tensor imaging indices of the rostral
substantia nigra in Parkinson's disease. Parkinsonism Relat Disord.
18:1029–1033. 2012. View Article : Google Scholar : PubMed/NCBI
|
|
10
|
Hodaie M, Neimat JS and Lozano AM: The
dopaminergic nigrostriatal system and Parkinson's disease:
Molecular events in development, disease and cell death, and new
therapeutic strategies. Neurosurgery. 60:17–30. 2007. View Article : Google Scholar : PubMed/NCBI
|
|
11
|
Li W, Liu J, Skidmore F, Liu Y, Tian J and
Li K: White matter microstructure changes in the thalamus in
Parkinson disease with depression: A diffusion tensor MR imaging
study. AJNR Am J Neuroradiol. 31:1861–1866. 2010. View Article : Google Scholar : PubMed/NCBI
|
|
12
|
Vaillancourt DE, Spraker MB, Prodoehl J,
Abraham I, Corcos DM, Zhou XJ, Comella CL and Little DM:
High-resolution diffusion tensor imaging in the substantia nigra of
de novo Parkinson disease. Neurology. 72:1378–1384. 2009.
View Article : Google Scholar : PubMed/NCBI
|
|
13
|
Zhang J, Zhang Y, Wang J, Cai P, Luo C,
Qian Z, Dai Y and Feng H: Characterizing iron deposition in
Parkinson's disease using susceptibility-weighted imaging: An in
vivo MR study. Brain Res. 1330:124–130. 2010. View Article : Google Scholar : PubMed/NCBI
|
|
14
|
Berg D and Hochstrasser H: Iron metabolism
in Parkinsonian syndromes. Mov Disord. 21:1299–1310. 2006.
View Article : Google Scholar : PubMed/NCBI
|
|
15
|
Martin WR, Wieler M and Gee M: Midbrain
iron content in early Parkinson disease: A potential biomarker of
disease status. Neurology. 70:1411–1417. 2008. View Article : Google Scholar : PubMed/NCBI
|
|
16
|
Pereira JB, Svenningsson P, Weintraub D,
Brønnick K, Lebedev A, Westman E and Aarsland D: Initial cognitive
decline is associated with cortical thinning in early Parkinson
disease. Neurology. 82:2017–2025. 2014. View Article : Google Scholar : PubMed/NCBI
|
|
17
|
Chan LL, Rumpel H, Yap K, Lee E, Loo HV,
Ho GL, Fook-Chong S, Yuen Y and Tan EK: Case control study of
diffusion tensor imaging in Parkinson's disease. J Neurol Neurosurg
Psychiatry. 78:1383–1386. 2007. View Article : Google Scholar : PubMed/NCBI
|
|
18
|
Yoshikawa K, Nakata Y, Yamada K and
Nakagawa M: Early pathological changes in the parkinsonian brain
demonstrated by diffusion tensor MRI. J Neurol Neurosurg
Psychiatry. 75:481–484. 2004. View Article : Google Scholar : PubMed/NCBI
|
|
19
|
Inoue T, Ogasawara K, Beppu T, Ogawa A and
Kabasawa H: Diffusion tensor imaging for preoperative evaluation of
tumor grade in gliomas. Clin Neurol Neurosurg. 107:174–180. 2005.
View Article : Google Scholar : PubMed/NCBI
|
|
20
|
Galvin JE, Lec VM and Trojanowske JQ:
Synucleinopathies: Clinical and pathological implications. Arch
Neurol. 58:186–190. 2001. View Article : Google Scholar : PubMed/NCBI
|
|
21
|
Lang AE and Mikulis D: A new sensitive
imaging biomarker for Parkinson disease? Neurology. 72:1374–1375.
2009. View Article : Google Scholar : PubMed/NCBI
|
|
22
|
Nicoletti G, Tonon C, Lodi R, Condino F,
Manners D, Malucelli E, Morelli M, Novellino F, Paglionico S, Lanza
P, et al: Apparent diffusion coefficient of the superior cerebellar
peduncle differentiates progressive supranuclear palsy from
Parkinson's disease. Move Disord. 23:2370–2376. 2008. View Article : Google Scholar
|
|
23
|
Schocke MF, Seppi K, Esterhammer R,
Kremser C, Mair KJ, Czermak BV, Jaschke W, Poewe W and Wenning GK:
Trace of diffusion tensor differentiates the Parkinson variant of
multiple system atrophy and Parkinson's disease. Neuroimage.
21:1443–1451. 2004. View Article : Google Scholar : PubMed/NCBI
|