Introduction
The first-generation sequencing technology used in
the Human Genome Project is time-consuming and expensive (1). Thus, the advent of next-generation
sequencing technology, with higher throughput, time and cost
savings, has led to revolutionary changes in the methods used for
genomics research (2). Following
several years of development, researchers are currently able to
combine whole-genome resequencing, exome sequencing, target region
sequencing and transcriptomics in order to detect mutations
(3–5). Thus far, human genome sequences have
been reported for thousands of individuals with ancestry in
distinct geographical regions, including Yoruba African people, two
individuals of northwest European origin, one individual from each
of China and Korea and 44 Caucasians (6–11). In
addition, the 1000 Genomes Project Consortium have reported results
for Phase 1 of the project (12).
However, even next-generation sequencing technology is sufficiently
cost-effective for individuals but not for use in large-scale
analyses (13). Therefore, a proven
effective strategy used to reduce the overall cost is pooling DNA
sequences from different individuals and then sequencing the pooled
DNA with a high coverage (14,15).
Using this strategy mentioned above, the majority of
the whole-genome resequencing performed in human genetics research
has focused on identified types of variants, including
single-nucleotide polymorphisms (SNPs), copy number variants
(CNVs), small insertions/deletions (indels), single nucleotide
variants (SNVs) or structure variants (SVs) (16–18). It
has been revealed that multiple rare variants may account for only
a small proportion of the phenotypic variation in complex diseases
(19), and new variants have been
detected gradually, which indicates different mutations in
different regions (20). This
reveals that a considerable number of human genetic variants,
particularly rare variants, remain to be discovered beyond those
currently published in public databases.
In the present study, ~3 million SNPs were
identified, as well as ~600,000 indels, 5,000 SVs, 5,000 CNVs and
13,000 SNVs. These variants were subsequently analysed using
genomic and bioinformatic methods.
Materials and methods
Samples
The peripheral blood samples examined in the present
study (n=100) were collected during a recruitment effort at the
health management centre of the Guilin 181st Hospital (Guilin,
China). A total of 100 unrelated, healthy ethnic Han Chinese
individuals were recruited in the research project. Their age
ranged between 40 and 60 years old in the cases examined, and all
volunteers were living in Guilin. The present study was approved by
the Medical Ethics Committee of People's Liberation Army 181
Hospital (Guilin, China) and written informed consent was obtained
from all volunteers before their blood was withdrawn.
Preparation of DNA pools
DNA was isolated from peripheral blood samples by
the same standard techniques for all volunteers, as previously
described (21). The integrity of
DNA in every sample was determined by DNA agarose gel
electrophoresis, as previously described (22), and the concentration of DNA in every
sample was detected by a Qubit 2.0 fluorometer (Thermo Fisher
Scientific, Inc., Waltham, MA, USA). Initially DNA was homogenised
for 30 min in a thermoshaker at 50°C, and all DNA samples were
diluted to ~50 ng/µl as a working solution. Next, each sample was
carefully measured using a Qubit fluorometer and diluted further
with Tris-ethylenediaminetetraacetic acid buffer (Takara Bio, Inc.,
Beijing, China) to 20 ng/µl. Finally, 10 µl DNA was extracted from
each of the samples, and mixed together with other samples in pools
representing 100 individuals.
Genomic DNA library construction and
genome resequencing
In order to minimise the likelihood of systematic
bias and potential sequencing errors in sampling, the DNA library
was constructed twice for each sample and every library was
sequenced twice. Thus, each sample would be sequenced four times.
Genomic DNA was extracted from the blood using standard
phenol/chloroform extraction methods (23). The DNA library was prepared using a
paired-end DNA sample prep kit (Illumina, Inc., San Diego, CA, USA)
and following the manufacturer's instructions. In brief, 2 µg
genomic DNA was randomly fragmented by nebulisation, as previously
described (24), which generated
double-stranded DNA fragments comprised of 3′ or 5′ overhangs. The
overhangs that resulted from fragmentation were converted into
blunt ends using T4 DNA and Klenow polymerases (Tiangen Biotech
Co., Ltd., Beijing, China). Furthermore, the 3′ to 5′ exonuclease
activity of these enzymes removed 3′ overhangs and the polymerase
activity filled in the 5′ overhangs. The next step was to add an A
base to the 3′ end of the DNA fragments using the polymerase
activity of the Klenow fragment (3′ to 5′ exo minus). Next, DNA
adaptors were ligated to the DNA fragments, and the DNA fragments
were purified on a 2% agarose gel to remove all unligated adapters,
adapters that may have ligated to one another, and select a 500 bp
template to go on the cluster generation platform. The
adapter-modified DNA fragments were enriched by 12 cycles of the
polymerase chain reaction (PCR), as previously described (25). For quality control, the concentration
of the libraries was measured by the absorbance at 260 nm, and the
260/280 ratio was 1.8. Furthermore, an Agilent 2100 bioanalyser
(Agilent Technologies, Santa Clara, CA, USA) was used to detect the
fragment size and yield, and the results of the library revealed
that it contained the expected size and yield. Following quality
control, the library generated was used in the cBot System for
cluster generation and the samples were then analysed using the
Solexa sequencing system (HiSeq 2000 platform; Illumina, Inc.),
which is based on sequencing-by-synthesis technology (7,8,26).
Public data
The human reference genome was downloaded from the
University of California Santa Cruz Genome Browser (http://hgdownload.cse.ucsc.edu/goldenPath/hg19/database/refGene.txt.gz)
and the human SNP database (dbSNP; ftp://ftp.ncbi.nih.gov/snp/organisms/human_9606) was
used for comparison of the putative SNPs identified.
Bioinformatics analysis
The bioinformatics analysis began with the
sequencing data (raw data) generated from the Illumina pipeline.
Initially, the adapter sequence in the raw data was removed, and
low quality reads with too many Ns or low quality bases were
discarded. This step produced clean data. Secondly, the
Burrows-Wheeler Aligner (BWA) was used to align reads to the
reference sequence (27). The
alignment information was stored in BAM format files to be further
processed during the following steps: Fixing mate-pairing
information, adding read group information and marking duplicate
reads caused by PCR. Following these procedures, the final BAM
files were ready for variant calling. SNPs were detected using
SOAPsnp (28); small
insertion/deletions (indels) were detected using SAMtools (29) GATK; CNVs were detected using CNVnator
and SNVs were detected using Varscan (30). Additionally, SVs were identified
using BreakDancer and a self-method based on the Segseq algorithm
(31,32). The pipeline also included purity
estimation. Filters were then applied to obtain higher confidence
results for the identified variants. Next, ANNOVAR (www.openbioinformatics.org/annovar/) was
used to annotate the variants, based on which advanced analysis can
subsequently be conducted (33).
Quality control (QC) was required at each stage of the analysis
pipeline to ensure clean data and to verify the alignment and the
called variants.
Data quality control
For cases of low-quality sequencing, resequencing
was required. The QC steps were conducted as follows: i) Removal of
the adapter reads (an adapter read was defined as a read that
included the adapter bases, and those adapter reads were removed
from the raw FASTQ data); ii) removal of low-quality reads, (if
more than half of the bases in a read were low-quality bases that
were defined as base quality ≤5, they were treated as low-quality
reads and were removed from the raw FASTQ data); and iii) removal
of reads in which unknown bases were >10%.
Following filtering, the remaining reads were
referred to as clean reads and were used for downstream
bioinformatics analysis. Finally, a statistical analysis was
performed in order to get the data production for the raw FASTQ
data and the clean data.
Results
Data production and quality
control
The genomic DNA pool was sequenced using a HiSeq
2000 platform (Illumina, Inc.). A total of 127.3 Gb of raw sequence
data were generated, resulting in a sequencing depth of ~30-fold
(Table I). Sequence data has been
submitted to the NCBI Sequence Read Archive under accession number
SRA185897 (http://www.ncbi.nlm.nih.gov/sra).
 | Table I.Quality statistics of clean data. |
Table I.
Quality statistics of clean data.
| Type | Raw data | Clean data |
|---|
| Number of reads | 1,273,028,056 | 1,210,244,348 |
| Data size |
114,572,525,040 |
108,921,991,320 |
| N of fq1 | 23,591,083 | 1,889,209 |
| N of fq2 | 61,780,180 | 1,483,604 |
| GC (%) of fq1 | 39.61–40.1 | 39.43–40.01 |
| GC (%) of fq2 | 39.8–40.17 | 39.55–40.05 |
| Q20 (%) of fq1 | 94.58–97.09 | 95.79–97.85 |
| Q20 (%) of fq2 | 88.51–93.66 | 92.07–96.12 |
| Q30 (%) of fq1 | 86.69–92.40 | 88.20–93.46 |
| Q30 (%) of fq2 | 78.99–88.05 | 82.37–90.50 |
| Discard reads
related to N | 2,264,798 |
|
| Discard reads
related to low qual | 59,735,130 |
|
| Discard reads
related to adapter | 783,780 |
|
| Clean data/raw
data | 95.07% |
|
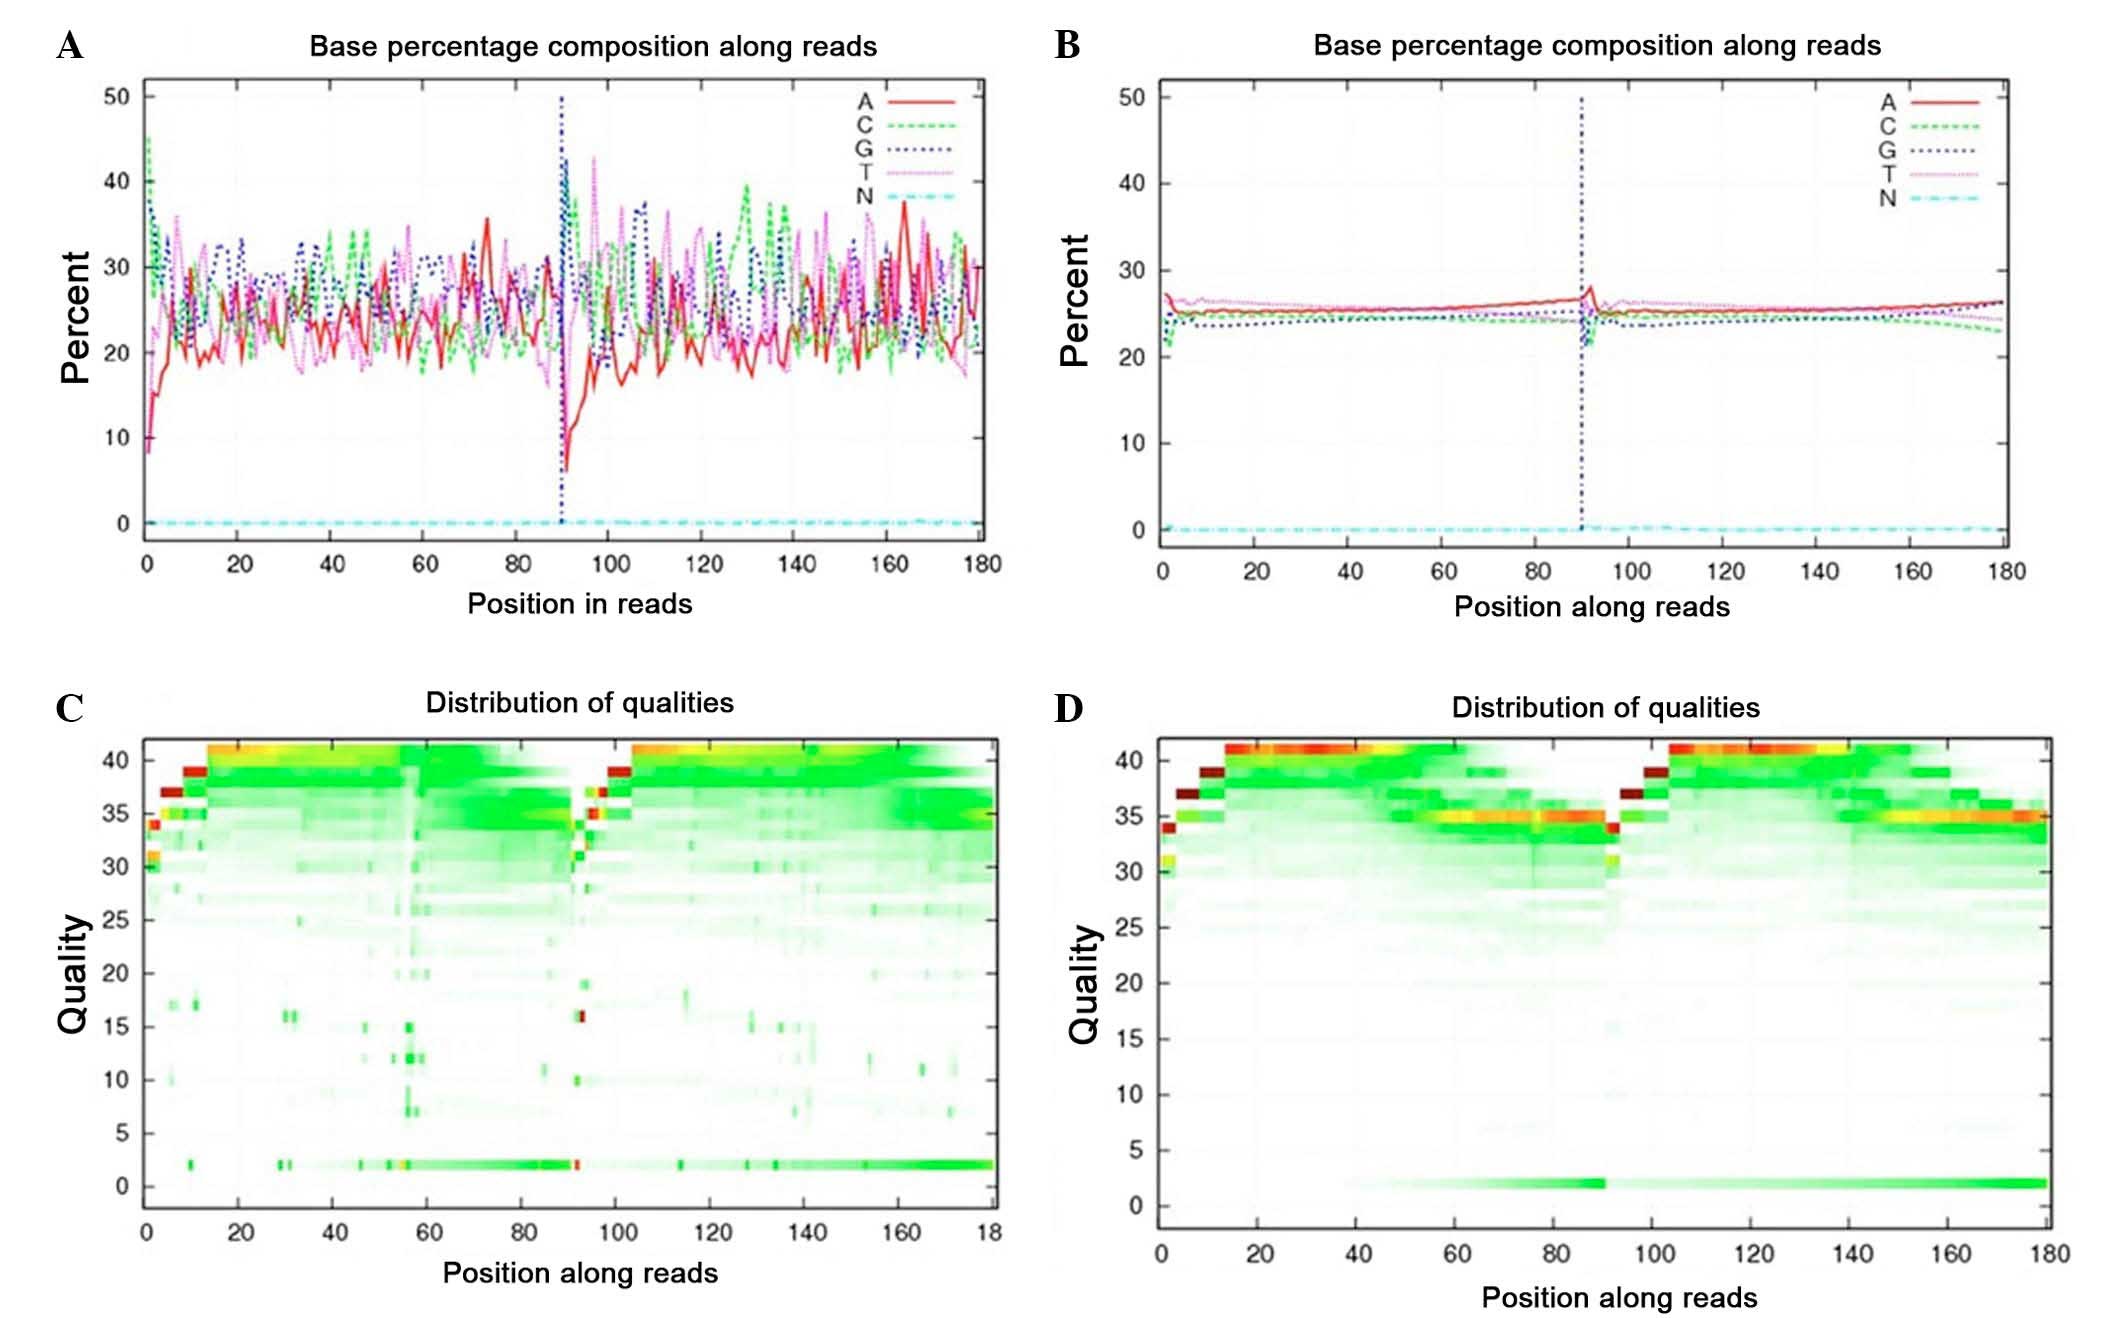
Before performing any further analysis, QC was
required in order to detect whether the data was qualified. Raw
reads were defined as reads containing the adapter sequence, a high
content of unknown bases and low-quality reads, which were removed
prior to the data analysis. For instance, Fig. 1A demonstrates an example of an
unbalanced base composition percentage, which is unqualified
because the T curve is not in accordance with the A curve, whereas
Fig. 1B presents a satisfactory base
composition. Regarding the base quality, the sequencing quality
depicted in Fig. 1C is poor. By
contrast, Fig. 1D presents good
quality sequences whose base ratios are mostly >20. The quality
of the clean data is presented in Table
I.
Alignment/mapping of reads to a
reference sequence
Sequencing reads were aligned to the reference
genome sequence using the BWA software. The human genome build37
(Hg19) was used as the reference for this project. The whole-genome
size of hg19 was 3,137,161,264 bp, while the effective size is
2,861,327,131 (excluding N bases, random and hap regions and
chromosomes Un and M in the reference). Next, Picard was used to
mark duplicate reads (redundant information produced by PCR). The
alignment results are shown in Table
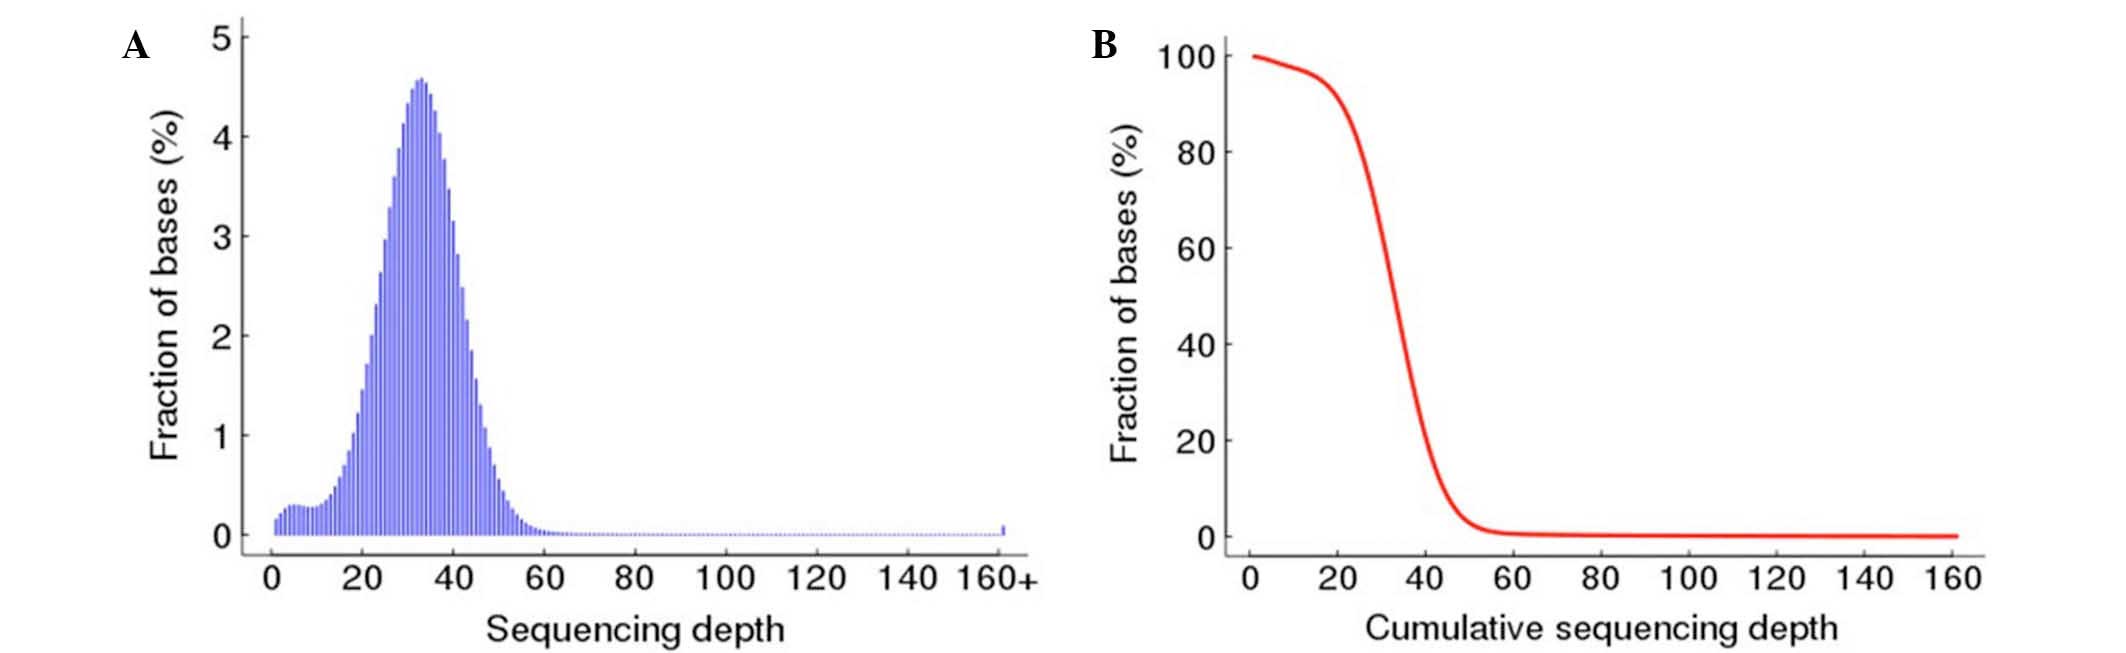
II. The distribution of the per-base sequencing depth and the
cumulative depth distribution in the non-N region of the whole
genome were also plotted in Fig. 2.
The distribution of the per-base sequencing depth approximately
followed a Poisson distribution, demonstrating that the non-N
region of the whole genome was evenly sampled (Fig. 2).
| Table II.Alignment results. |
Table II.
Alignment results.
| Item | Value | Item | Value |
|---|
| Clean reads | 1,210,244,348 | Duplicate rate | 8.51% |
| Clean bases
(bp) |
108,921,991,320 | Mismatch bases | 425,479,678 |
| Mapped reads | 1,173,317,876 | Mismatch rate | 0.41% |
| Mapped bases
(bp) |
103,953,154,126 | Average sequencing
depth | 32.76 |
| Mapping rate | 96.95% | Coverage | 99.84% |
| Uniq reads | 1,125,241,695 | Coverage at least
4X | 99.21% |
| Uniq bases
(bp) | 99,700,359,408 | Coverage at least
10X | 97.48% |
| Unique rate | 95.90% | Coverage at least
20X | 91.30% |
| Duplicate
reads | 99,867,211 |
|
|
SNP identification and annotation
An SNP is a DNA sequence variation occurring when a
single nucleotide A, T, C or G differs between samples or
individuals. SOAPsnp was employed to detect SNPs. Using the
consensus sequence, the polymorphic loci between the identified
genotype and the reference could be filtered and highlighted, which
would then constitute the high confidence SNP dataset. After the
SNPs were identified, ANNOVAR was used to perform annotation and
classification.
In total, 3,830,314 SNPs were identified. Among the
SNPs in the DNA pool, 479,258 were homozygous, while 3,351,056 were
heterozygous. Furthermore, 20,616 sites were located in exonic
regions whereas 1,330,526 were within intronic regions. In
addition, in the dataset of the present study, 93,679 and 2,316,322
SNPs were detected using NcSNPs and Intergenic, respectively. The
SNPs located in gene regions in the DNA pool were annotated using
ANNOVAR. In total 24,880 SNPs in the untranslated regions, 143 SNPs
at splicing sites, and 11,267 SNPs corresponding to synonymous
mutations were identified. Detailed statistics are provided to
demonstrate the distribution of SNPs in different gene regions
(Table III).
| Table III.SNPs summary of annotation. |
Table III.
SNPs summary of annotation.
| Categories | Value | Categories | Value |
|---|
| Total | 3,830,314 | Splicing | 143 |
| 1000 genome and
dbsnp135 | 3,768,967 | NcRNA | 93,679 |
| 1000 genome
specific | 1572 | UTR5 | 3,747 |
| dbSNP135
specific | 56,946 | UTR5 and UTR3 | 12 |
| dbSNP rate | 99.89% | UTR3 | 24,880 |
| Novel | 2,829 | Intronic | 1,330,526 |
| Hom | 479,258 | Upstream | 18,144 |
| Het | 3,351,056 | Upstream and
downstream | 580 |
| Synonymous | 11,267 | Downstream | 21,376 |
| Missense | 9,534 | Intergenic | 2,316,322 |
| Stopgain | 71 | SIFT | 1,138 |
| Stoploss | 33 | Ti/Tv | 2.1055 |
| Exonic | 20,616 | dbSNP Ti/Tv | 2.1068 |
| Exonic and
splicing | 289 | Novel Ti/Tv | 1.1191 |
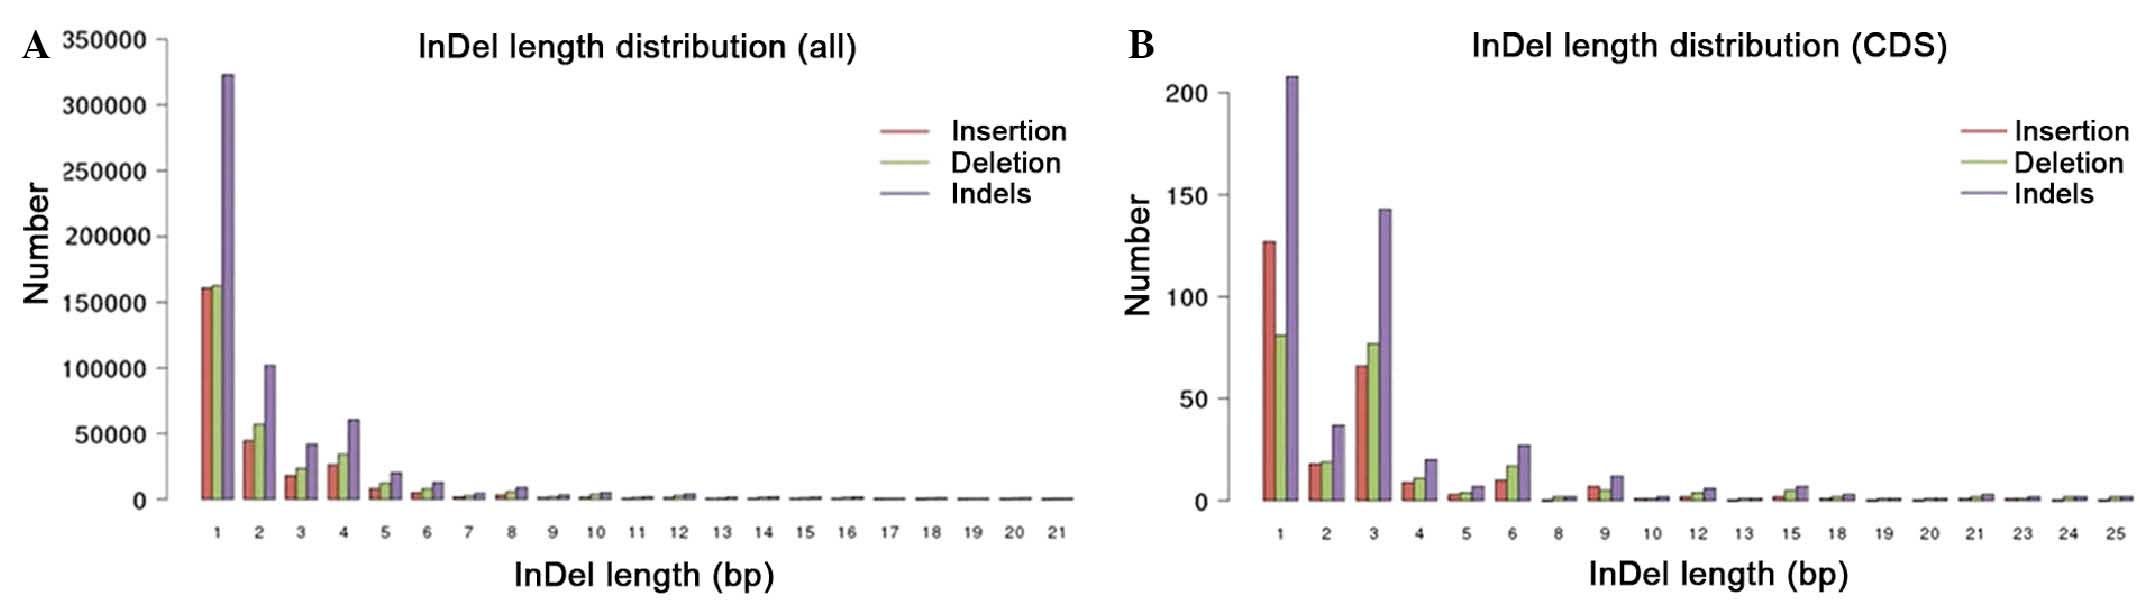
Identification and annotation of
indels
Pair-end reads for gap alignment were used in order
to detect indels using the program mpileup in SAMtools. After the
indels were identified, ANNOVAR was employed in order to perform
annotation and classification (Table
IV). Among the indels in the DNA pool, 361,730 (60%) were
located in intergenic regions, 403 in exonic regions and 211,208
(35%) in intronic regions. There were 101,236 homozygous and
499,888 heterozygous indels identified in the DNA pool. The length
distributions of the indels within the whole genome and the coding
region were plotted in Fig. 3.
| Table IV.Insertion/deletion summary of
annotation. |
Table IV.
Insertion/deletion summary of
annotation.
| Categories | Value | Categories | Value |
|---|
| Total | 601,124 | Stopgain | 1 |
| 1000 genome and
dbsnp135 | 301,621 | Stoploss | 1 |
| 1000 genome
specific | 73,292 | Exonic | 403 |
| dbSNP135
specific | 119,018 | Exonic and
splicing | 6 |
| dbSNP rate | 69.98% | Splicing | 77 |
| Novel | 107,193 | NcRNA | 15,081 |
| Hom | 101,236 | UTR5 | 438 |
| Het | 499,888 | UTR5 and UTR3 | 3 |
| Frameshift
insertion | 123 | UTR3 | 4,954 |
| Non-frameshift
insertion | 85 | Intronic | 211,208 |
| Frameshift
deletion | 100 | Upstream | 3,074 |
| Non-frameshift
deletion | 99 | Upstream and
downstream | 99 |
| Frameshift block
substitution | 0 | Downstream | 4,051 |
| Non-frameshift
block substitution | 0 | Intergenic | 361,730 |
Identification and annotation of
SVs
Paired-end sequencing provides a powerful tool for
detecting genome-wide structural variation. BreakDancer/CREST was
used to detect SVs. When aligning the paired-end reads, if an SV
existed between the sequencing results and the reference it would
not have met the requirements for pair-end alignment, and therefore
these anomalous read pairs and soft-clipped reads would have been
used to detect SVs. Using this method a catalogue of 5,412 SVs was
generated, including 4,834 deletions and 352 insertions, and 1,823
SVs weer found in intronic regions, 6 SVs in exonic regions and
3,409 SVs in intergenic regions. The result is a list of SVs
detected at the whole-genome level (Table V).
| Table V.Structure variants summary of
annotation. |
Table V.
Structure variants summary of
annotation.
| Categories | Value | Categories | Value |
|---|
| Total | 5,412 | NcRNA | 114 |
| Insertion | 352 | UTR5 | 3 |
| Deletion | 4,834 | UTR5 and UTR3 | 0 |
| Inversion | 14 | UTR3 | 8 |
| ITX | 120 | Intronic | 1,823 |
| CTX | 92 | Upstream | 11 |
| Exonic | 6 | Upstream and
downstream | 2 |
| Exonic and
splicing | 1 | Downstream | 29 |
| Splicing | 6 | Intergenic | 3,409 |
CNV identification and annotation
CNVs, a form of structural variations, are
alterations of the DNA of a genome that result in the cell having
an abnormal number of copies of one or more sections of a DNA
sequence (34). CNVs correspond to
relatively large regions of the genome that have been deleted
(fewer copies than the normal number) or duplicated (more copies
than the normal number) on certain chromosomes. The CNVs in each
sample were detected with a CNVnator. After the CNVs were
identified, ANNOVAR was also used to perform the annotation and
classification (Table VI).
| Table VI.Copy number variations summary of
annotation. |
Table VI.
Copy number variations summary of
annotation.
| Categories | Value | Categories | Value |
|---|
| Total | 5,201 | UTR3 | 7 |
| Exonic | 954 | Intronic | 1,174 |
| Exonic and
splicing | 0 | Upstream | 59 |
| Splicing | 274 | Upstream and
downstream | 3 |
| NcRNA | 196 | Downstream | 35 |
| UTR5 | 0 | Intergenic | 2,499 |
| UTR5 and UTR3 | 0 | Amplification
size | 12,106,400 |
|
|
| Deletion size | 85,672,600 |
Discussion
In the present study, a whole-genome resequencing
protocol combined with DNA-pooling technology was used to identify
this type of genetic variation across populations. This is a proven
and effective strategy for sequencing (35). Despite the rapid development of
genetic technology and the routine performance of whole genome
human sequencing, we believe that the data of the present study
will provide basic information for such studies and enrich the
analysis of human genomic variation across different ethnic groups
and regions (36,37).
The present study focused on the assessment of
genome coverage, sequencing depth, detection of variations,
validation, annotation and classification. Bioinformatic techniques
were used to analyse gene sequence data. The preliminary results
were obtained by comparing with a reference genome sequence.
Furthermore, a total of 127.3 Gb of raw sequence data were
generated in a short period of time, and ~3.83 million SNPs were
identified in the sample genome obtained via DNA-pooling, among
which 2,829 SNPs were recognised to be novel. The trends of novel
SNP depth analysis should be the same as what is already known
(Fig. 4) (38). Additionally, the total number of
transition SNPs to the total number of transvertion SNPs ratio was
2.10 (Table III). The number of
transition SNPs that have been published in the dbSNP database to
the number of transvertion SNPs that have been published in the
dbSNP database was 2.10 (Table
III). Furthermore, the number of novel transition SNPs to the
number of novel transvertion SNPs was 1.19 (Table III). All of these results were
consistent with a previous report (10). Regarding indels, 107,193 indels were
found to be novel, and the remaining 69.98% were found in the dbSNP
database, with the result of indel annotation being consistent with
a previous report (10).
For different ethnic groups and regions, the data of
the present study constitutes an important supplement to the
current gene bank. A sizeable number of unreported SNVs, short
indels, SVs and CNVs were revealed in the analysis. Ultimately,
with the decreasing cost of genetic sequencing technology, there
will be increasing numbers of people who will be sequenced.
Therefore, personal genome sequencing may eventually become an
essential tool for the diagnosis, prevention and treatment of human
diseases.
To the best of our knowledge the present study
resequenced the whole genome sequence through a small sample of
southern China. A total of 127.3 Gb of raw sequence data were
generated, new variation sites were revealed by comparing with
reference sequence, and new knowledge of human genome variation was
added to the Human genomic databases. A total of 107,193 novel
variations were identified by comparing with a known database. In
addition, the particular distribution regions of variation were
illustrated by analyzing its sites. In conclusion, in the present
research whole genome sequencing was adopted to detect genome
variation at a populational level, and summarized that the uploaded
sequence data in NCBI is sufficient to provide a research
foundation for future researchers.
Acknowledgements
The authors thank the healthy volunteers who
participated in this study, Dr Guimian Zou (Guangxi Key Laboratory
of Metabolic Diseases Research, Guilin, China) and Dr Qiang Yan
(Department of Nephrology, Guilin 181st Hospital, Guilin, China)
for their helpful comments and Mrs. Haiyan Wang (Assistant
Researcher, Guangxi Key Laboratory of Metabolic Diseases Research,
Guilin, China) and Dr Song Liu (Clinical Medical Research Center,
The Second Clinical Medical College of Jinan University, Shenzhen,
China) for their technical help. The present study work was
supported by the Shenzhen S&T Program (grant no. 201302014) and
Guangxi Key Laboratory of Metabolic Disease Research (grant no.
12-071-32).
References
|
1
|
International Human Genome Sequencing
Consortium, . Finishing the euchromatic sequence of the human
genome. Nature. 431:931–945. 2004. View Article : Google Scholar : PubMed/NCBI
|
|
2
|
Pleasance ED, Cheetham RK, Stephens PJ,
McBride DJ, Humphray SJ, Greenman CD, Varela I, Lin ML, Ordóñez GR,
Bignell GR, et al: A comprehensive catalogue of somatic mutations
from a human cancer genome. Nature. 463:191–196. 2010. View Article : Google Scholar : PubMed/NCBI
|
|
3
|
Ley TJ, Mardis ER, Ding L, Fulton B,
McLellan MD, Chen K, Dooling D, Dunford-Shore BH, McGrath S,
Hickenbotham M, et al: DNA sequencing of a cytogenetically normal
acute myeloid leukaemia genome. Nature. 456:66–72. 2008. View Article : Google Scholar : PubMed/NCBI
|
|
4
|
Ng SB, Turner EH, Robertson PD, Flygare
SD, Bigham AW, Lee C, Shaffer T, Wong M, Bhattacharjee A, Eichler
EE, Bamshad M, Nickerson DA and Shendure J: Targeted capture and
massively parallel sequencing of 12 human exomes. Nature.
461:272–276. 2009. View Article : Google Scholar : PubMed/NCBI
|
|
5
|
Maher CA, Kumar-Sinha C, Cao X,
Kalyana-Sundaram S, Han B, Jing X, Sam L, Barrette T, Palanisamy N
and Chinnaiyan AM: Transcriptome sequencing to detect gene fusions
in cancer. Nature. 458:97–101. 2009. View Article : Google Scholar : PubMed/NCBI
|
|
6
|
Levy S, Sutton G, Ng PC, Feuk L, Halpern
AL, Walenz BP, Axelrod N, Huang J, Kirkness EF, Denisov G, et al:
The diploid genome sequence of an individual human. PLoS Biol.
5:e2542007. View Article : Google Scholar : PubMed/NCBI
|
|
7
|
Wheeler DA, Srinivasan M, Egholm M, Shen
Y, Chen L, McGuire A, He W, Chen YJ, Makhijani V, Roth GT, et al:
The complete genome of an individual by massively parallel DNA
sequencing. Nature. 452:872–876. 2008. View Article : Google Scholar : PubMed/NCBI
|
|
8
|
Wang J, Wang W, Li R, Li Y, Tian G,
Goodman L, Fan W, Zhang J, Li J, Zhang J, et al: The diploid genome
sequence of an Asian individual. Nature. 456:60–65. 2008.
View Article : Google Scholar : PubMed/NCBI
|
|
9
|
Bentley DR, Balasubramanian S, Swerdlow
HP, Smith GP, Milton J, Brown CG, Hall KP, Evers DJ, Barnes CL,
Bignell HR, et al: Accurate whole human genome sequencing using
reversible terminator chemistry. Nature. 456:53–59. 2008.
View Article : Google Scholar : PubMed/NCBI
|
|
10
|
Kim JI, Ju YS, Park H, Kim S, Lee S, Yi
JH, Mudge J, Miller NA, Hong D, Bell CJ, et al: A highly annotated
whole-genome sequence of a Korean individual. Nature.
460:1011–1015. 2009.PubMed/NCBI
|
|
11
|
Shen H, Li J, Zhang J, Xu C, Jiang Y, Wu
Z, Zhao F, Liao L, Chen J, Lin Y, et al: Comprehensive
characterization of human genome variation by high coverage
whole-genome sequencing of forty four Caucasians. PLoS One.
8:e594942013. View Article : Google Scholar : PubMed/NCBI
|
|
12
|
1000 Genomes Project Consortium; Abecasis
GR, Auton A, Brooks LD, DePristo MA, Durbin RM, Handsaker RE, Kang
HM, Marth GT and McVean GA: An integrated map of genetic variation
from 1,092 human genomes. Nature. 491:56–65. 2012. View Article : Google Scholar : PubMed/NCBI
|
|
13
|
Sham P, Bader JS, Craig I, O'Donovan M and
Owen M: DNA Pooling: A tool for large-scale association studies.
Nat Rev Genet. 3:862–871. 2002. View
Article : Google Scholar : PubMed/NCBI
|
|
14
|
Bansal V: A statistical method for the
detection of variants from next-generation resequencing of DNA
pools. Bioinformatics. 26:i318–i324. 2010. View Article : Google Scholar : PubMed/NCBI
|
|
15
|
Bansal V, Tewhey R, Leproust EM and Schork
NJ: Efficient and cost effective population resequencing by pooling
and in-solution hybridization. PLoS One. 30:e183532011. View Article : Google Scholar
|
|
16
|
Carlson CS, Eberle MA, Rieder MJ, Smith
JD, Kruglyak L and Nickerson DA: Additional SNPs and
linkage-disequilibrium analyses are necessary for whole-genome
association studies in humans. Nat Genet. 33:518–521. 2003.
View Article : Google Scholar : PubMed/NCBI
|
|
17
|
Van Tassell CP, Smith TP, Matukumalli LK,
Taylor JF, Schnabel RD, Lawley CT, Haudenschild CD, Moore SS,
Warren WC and Sonstegard TS: SNP discovery and allele frequency
estimation by deep sequencing of reduced representation libraries.
Nat Methods. 5:247–252. 2008. View Article : Google Scholar : PubMed/NCBI
|
|
18
|
Krumbiegel M, Pasutto F,
Schlötzer-Schrehardt U, Uebe S, Zenkel M, Mardin CY, Weisschuh N,
Paoli D, Gramer E, Becker C, et al: Genome-wide association study
with DNA pooling identifies variants at CNTNAP2 associated with
pseudoexfoliation syndrome. Eur J Hum Genet. 19:186–193. 2011.
View Article : Google Scholar : PubMed/NCBI
|
|
19
|
Xiong Q, Ancona N, Hauser ER, Mukherjee S
and Furey TS: Integrating genetic and gene expression evidence into
genome-wide association analysis of gene sets. Genome Res.
22:386–397. 2012. View Article : Google Scholar : PubMed/NCBI
|
|
20
|
Ju YS, Kim JI, Kim S, Hong D, Park H, Shin
JY, Lee S, Lee WC, Kim S, Yu SB, et al: Extensive genomic and
transcriptional diversity identified through massively parallel DNA
and RNA sequencing of eighteen Korean individuals. Nat Genet.
43:745–752. 2011. View
Article : Google Scholar : PubMed/NCBI
|
|
21
|
Hantz S, Goudard M, Marczuk V, Renaudie J,
Dussartre C, Bakeland D, Denis F and Alain S: HPV detection and
typing by INNO-LiPA assay on liquid cytology media Easyfix Labonord
after extraction QIAamp DNA Blood Mini Kit Qiagen and Nuclisens
easyMAG Biomérieux. Pathol Biol (Paris). 58:179–183. 2010.
View Article : Google Scholar : PubMed/NCBI
|
|
22
|
Villagomez R, Hatti-Kaul R, Sterner O,
Almanza G and Linares-Pastén JA: Effect of natural and
semisynthetic pseudoguianolides on the stability of NF-κB: DNA
complex studied by agarose gel electrophoresis. PLoS One.
10:e01158192015. View Article : Google Scholar : PubMed/NCBI
|
|
23
|
Zhu N and Wang Z: An assay for DNA
fragmentation in apoptosis without phenol/chloroform extraction and
ethanol precipitation. Anal Biochem. 246:155–158. 1997. View Article : Google Scholar : PubMed/NCBI
|
|
24
|
Sambrook J and Russell DW: Fragmentation
of DNA by nebulization. CSH Protoc. 4:45392006.
|
|
25
|
Chuchana P: Polymerase chain reaction:
General methodology. Ann Biol Clin (Paris). 50:703–708.
1992.PubMed/NCBI
|
|
26
|
Mardis ER: Next-generation DNA sequencing
platforms. Annu Rev Anal Chem (Palo Alto Calif). 6:287–303. 2013.
View Article : Google Scholar : PubMed/NCBI
|
|
27
|
Li H and Durbin R: Fast and accurate
long-read alignment with Burrows-Wheeler transform. Bioinformatics.
26:589–595. 2010. View Article : Google Scholar : PubMed/NCBI
|
|
28
|
Li R, Li Y, Fang X, Yang H and Wang J,
Kristiansen K and Wang J: SNP detection for massively parallel
whole-genome resequencing. Genome Res. 19:1124–1132. 2009.
View Article : Google Scholar : PubMed/NCBI
|
|
29
|
Li H, Handsaker B, Wysoker A, Fennell T,
Ruan J, Homer N, Marth G, Abecasis G and Durbin R: 1000 Genome
Project Data Processing Subgroup: The sequence alignment/Map format
and SAMtools. Bioinformatics. 25:2078–2079. 2009. View Article : Google Scholar : PubMed/NCBI
|
|
30
|
Koboldt DC, Chen K, Wylie T, Larson DE,
McLellan MD, Mardis ER, Weinstock GM, Wilson RK and Ding L:
VarScan: Variant detection in massively parallel sequencing of
individual and pooled samples. Bioinformatics. 25:2283–2285. 2009.
View Article : Google Scholar : PubMed/NCBI
|
|
31
|
Chen K, Wallis JW, McLellan MD, Larson DE,
Kalicki JM, Pohl CS, McGrath SD, Wendl MC, Zhang Q, Locke DP, et
al: BreakDancer: An algorithm for high-resolution mapping of
genomic structural variation. Nat Methods. 6:677–681. 2009.
View Article : Google Scholar : PubMed/NCBI
|
|
32
|
Chiang DY, Getz G, Jaffe DB, O'Kelly MJ,
Zhao X, Carter SL, Russ C, Nusbaum C, Meyerson M and Lander ES:
High-resolution mapping of copy-number alterations with massively
parallel sequencing. Nat Methods. 6:99–103. 2009. View Article : Google Scholar : PubMed/NCBI
|
|
33
|
Wang K, Li M and Hakonarson H: ANNOVAR:
Functional annotation of genetic variants from high-throughput
sequencing data. Nucleic Acid Res. 38:e1642010. View Article : Google Scholar : PubMed/NCBI
|
|
34
|
Iafrate AJ, Feuk L, Rivera MN, Listewnik
ML, Donahoe PK, Qi Y, Scherer SW and Lee C: Detection of
large-scale variation in the human genome. Nat Genet. 36:949–951.
2004. View
Article : Google Scholar : PubMed/NCBI
|
|
35
|
Out AA, van Minderhout IJ, Goeman JJ,
Ariyurek Y, Ossowski S, Schneeberger K, Weigel D, van Galen M,
Taschner PE, Tops CM, et al: Deep sequencing to reveal new variants
in pooled DNA samples. Hum Mutat. 30:1703–1712. 2009. View Article : Google Scholar : PubMed/NCBI
|
|
36
|
Pleasance ED, Stephens PJ, O'Meara S,
McBride DJ, Meynert A, Jones D, Lin ML, Beare D, Lau KW, Greenman
C, et al: A small-cell lung cancer genome with complex signatures
of tobacco exposure. Nature. 463:184–190. 2010. View Article : Google Scholar : PubMed/NCBI
|
|
37
|
Meuwissen T and Goddard M: Accurate
prediction of genetic values for complex traits by whole-genome
resequencing. Genetics. 185:623–631. 2010. View Article : Google Scholar : PubMed/NCBI
|
|
38
|
Ingman M and Gyllensten U: SNP frequency
estimation using massively parallel sequencing of pooled DNA. Eur J
Hum Genet. 17:383–386. 2009. View Article : Google Scholar : PubMed/NCBI
|