Introduction
Breast cancer is one of the most common malignant
tumors endangering the health of women. Molybdenum-target
mammography is the main screening method for breast cancer;
however, the sensitivity of this method is only reported to be
69–90%, and the sensitivity in dense breast is decreased further to
48% (1,2). As magnetic resonance imaging (MRI) is
widely adopted in clinical use, dynamic contrast enhancement MRI
(DCE-MRI) has been applied for monitoring tumor angiogenesis and
hemodynamic changes in order to provide valuable information for
the diagnosis of lesions and the selection of treatment options.
The meta-analysis conducted by Peters et al (3), to evaluate the diagnostic efficacy of
MRI for breast cancer, showed that the sensitivity and specificity
were 90 and 72%, respectively. Numerous studies have been performed
to evaluate magnetic resonance perfusion imaging in breast lesion
diagnosis in recent years, but few studies have evaluated the
optimized scanning window following contrast agent injection
(4–6).
Although MRI is recognized as a safer diagnostic
modality compared with X-ray-based methods, certain biological
effects such as perfusion and metabolism, and physical effects such
as heating and motion may have compound adverse effects on
diagnostic results (7,8). The determination of the optimum
scanning window following contrast injection is of particular
interest, as it should improve breast perfusion scanning efficiency
and reduce adverse imaging effects, on the premise of utilizing the
best quality images.
Therefore, the present study evaluated the image
quality and diagnostic specificity of magnetic resonance perfusion
images from different scanning windows following contrast injection
and identified the most efficient and effective scanning window for
breast lesions.
Materials and methods
Patients
The study population comprised 52 female patients
undergoing breast MRI dynamic enhanced scanning after they were
found to have breast lumps using ultrasound examination and
molybdenum target X-ray mammography. The ages of the patients
ranged from 23 to 68 years. Patients included in this study had no
MRI contraindications, had not received any chemotherapy and did
not show renal insufficiency problems. Informed consent was
obtained for all patients prior to examination. All patients with
lesions were confirmed by pathology, including 36 cases of
malignant disease (69.2%): 32 cases of infiltrating ductal
carcinoma, 2 cases of intraductal carcinoma, 1 case of inflammatory
breast cancer, 1 case of lipid-rich invasive carcinoma; and 16
cases of benign tumors (30.8%): 7 cases of fibroadenoma, 6 cases of
mammary gland hyperplasia, 1 case of intraductal papilloma, 1 case
of borderline phyllodes tumor and 1 case of lipoma. This research
was approved by the local ethics committee of Qianfoshan Hospital
(Jinan, China), and all patients provided written informed
consent.
Instruments and imaging methods
A Siemens Magnetom Skyra 3.0 T MRI scanner (Siemens
AG, Munich, Germany) with a dedicated bilateral eight-channel
phased array breast coil was used. Patients were scanned in prone
position with bilateral breasts naturally hanging in the coil.
Following regular transverse, sagittal and coronary positioning
with a localizer sequence, a dual flip-angle (3 and 16°)
T1-weighted sequence was applied [repetition time (TR)/echo time
(TE), 7.84 msec/7.84 msec; field of view (FOV), 340 mm; matrix,
224×224; slice thickness, 1.5 mm; slice distance, 0.3 mm; one
excitation). For dynamic contrast-enhanced T1 perfusion imaging, a
series of single flip angle (10°) T1-weighted sequences were
applied (TR/TE 5.61 msec/1.74 msec; FOV, 340 mm; matrix, 224×224;
slice thickness, 1.5 mm; slice distance, 0.3 mm; one excitation for
each phase acquisition; single phase scanning time, 30 sec; total
scanning time, 26 min). Patients were injected with 20 ml
intravenous high contrast agent gadobenate dimeglumine (Bracco
Imaging S.p.A., Milan, Italy) after the second single phase scan,
followed by 20 ml saline water injection at a flow rate of 5
ml/sec. Fifty continuous phase images were collected
thereafter.
Image processing and evaluation
All data were transferred to a SYGNO VE40A
workstation (Siemens AG) for post-processing using TISSUE 4D
software. Arterial input functions (AIFs) at different times were
acquired in obvious mammary gland artery or thoracic artery,
selected manually in the images at phases of 10 (5 min after
injection of contrast agents), 20 (10 min), 30 (15 min), 40 (min)
20 and 50 (25 min). Certain regions of interest (ROI), displayed by
pseudo-color maps, were selected to measure the change of the
following quantitative parameters in different pathology periods:
i) Volume transfer constant (Ktrans), describing the
diffusion rate of the contrast agent from intravascular space to
extravascular space; ii) the rate constant (Kep),
referring to the diffusion rate of the contrast agent from
intracellular space to intravascular space; iii) extravascular
extracellular volume fraction (Ve), indicating the ratio
of the contrast agent permeated from extracellular space outside
the vascular volume to the volume of the ROI. The criteria of ROI
selection were regions without necrotic tissue, hollow space,
calcification and blood vessels. Quantitative parameters for
pathological identification were averaged over three consecutive
slices containing the largest cross section of the selected
abnormal lump zone.
Statistical analysis
SPSS software (version 17.0; SPSS, Inc., Chicago,
IL, USA) was used for the study. Data are presented in the form of
the mean ± standard deviation. Quantitative comparisons between
benign and malignant tumor groups, and between various phases, were
achieved using the t-test. P<0.05 was considered to indicate a
statistically significant difference.
Results
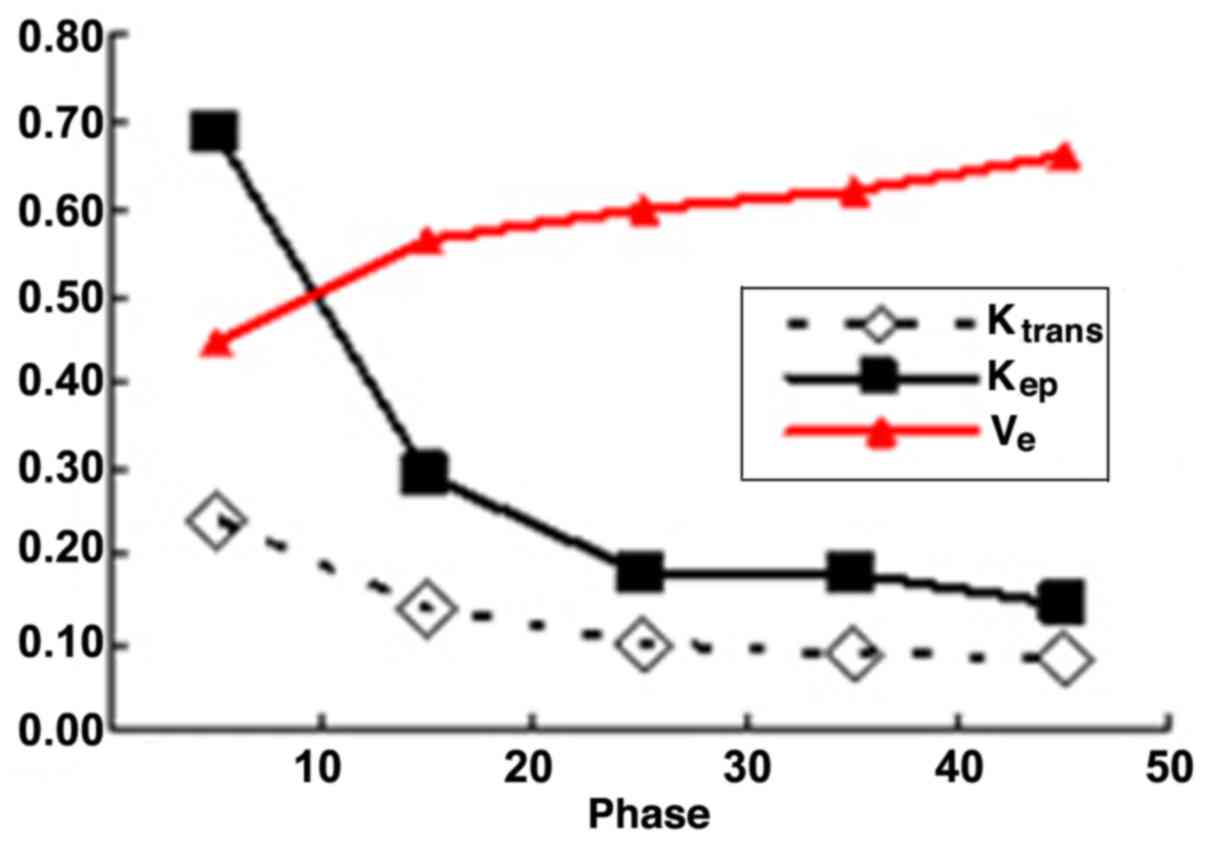
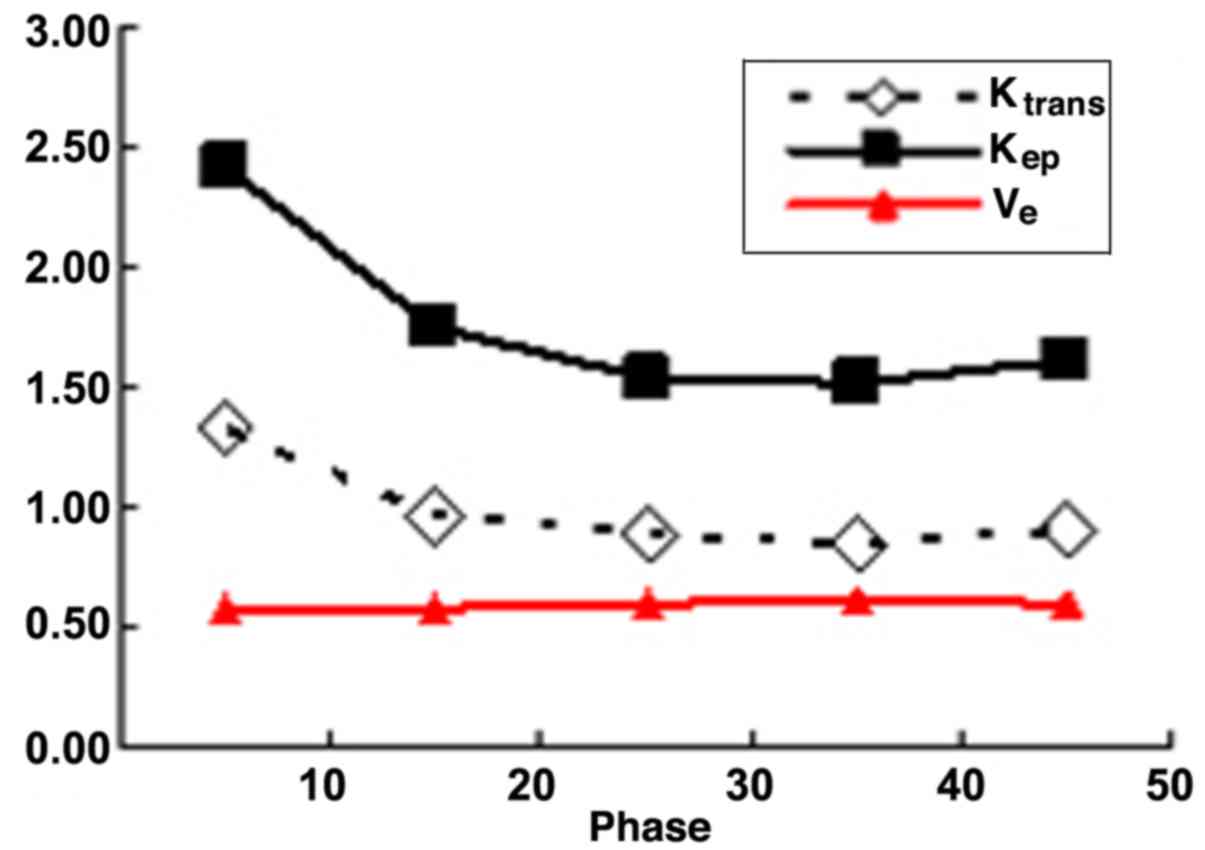
Quantitative comparisons between
benign and malignant tumor
As shown in Tables I
and II, the Ktrans and
Kep values at all phases had statistical significance in
the differentiation of benign and malignant tumors (P<0.05). For
Ve values, no statistical significance was observed in
the differentiation of benign and malignant tumors at all phases,
with the exception of phase 10. However, Ve values
increased as the scanning delay time was prolonged in benign
lesions, while they exhibited no significant changes at different
scanning phases in malignant lesions. Detailed variation tendencies
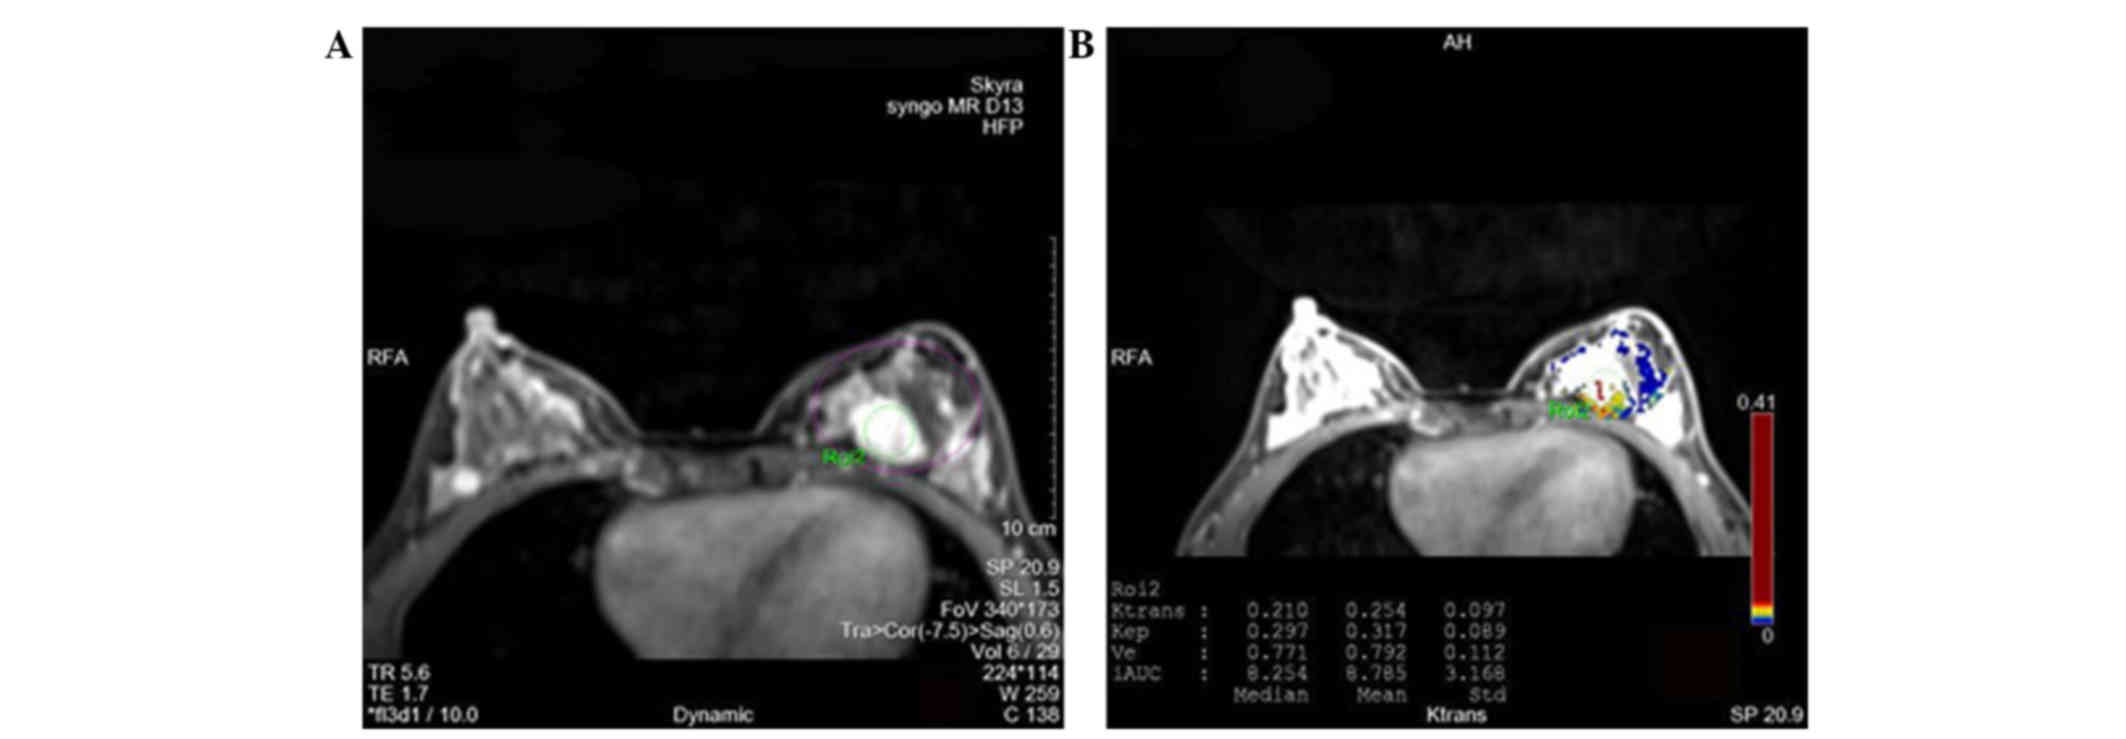
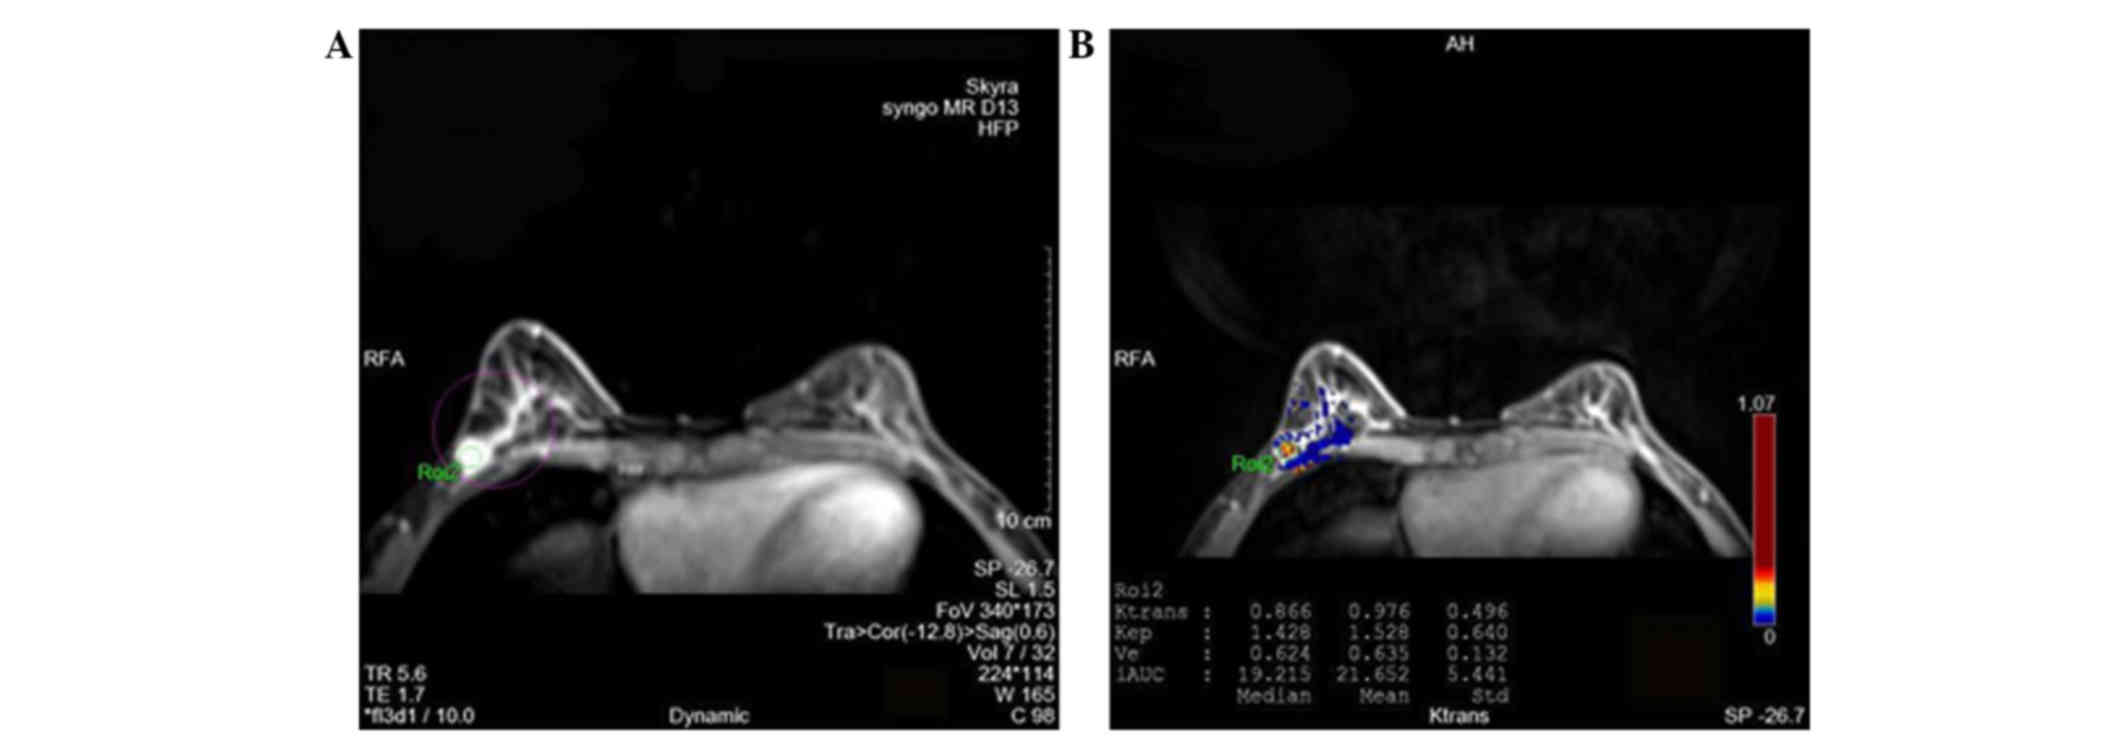
are shown in Figs. 1 and 2. Moreover, typical images differentiating
benign and malignant breast lesions are presented in Figs. 3 and 4, respectively.
 | Table I.Indicator values in benign and
malignant lesions (mean ± standard deviation). |
Table I.
Indicator values in benign and
malignant lesions (mean ± standard deviation).
|
|
| Phase |
|---|
|
|
|
|
|---|
| Lesions | Indicators | 10 | 20 | 30 | 40 | 50 |
|---|
| Benign |
Ktrans | 0.242±0.182 | 0.136±0.088 | 0.100±0.062 | 0.088±0.050 | 0.083±0.048 |
|
| Kep | 0.685±0.548 | 0.291±0.185 | 0.182±0.086 | 0.182±0.141 | 0.142±0.053 |
|
| Ve | 0.445±0.211 | 0.565±0.196 | 0.598±0.172 | 0.621±0.149 | 0.661±0.130 |
| Malignant |
Ktrans | 1.333±0.401 | 0.967±0.361 | 0.885±0.378 | 0.848±0.314 | 0.896±0.366 |
|
| Kep | 2.420±0.723 | 1.742±0.552 | 1.546±0.559 | 1.514±0.662 | 1.625±0.861 |
|
| Ve | 0.584±0.147 | 0.581±0.137 | 0.601±0.150 | 0.606±0.169 | 0.590±0.182 |
| Table II.Statistical significance of the three
indicator values acquired at all phases in the differentiation of
benign and malignant tumors (P-value). |
Table II.
Statistical significance of the three
indicator values acquired at all phases in the differentiation of
benign and malignant tumors (P-value).
|
| Phase |
|---|
|
|
|
|---|
| Indicators | 10 | 20 | 30 | 40 | 50 |
|---|
|
Ktrans | <0.001 | <0.001 | <0.001 | <0.001 | <0.001 |
| Kep | <0.001 | <0.001 | <0.001 | <0.001 | <0.001 |
| Ve | 0.015 | 0.768 | 0.950 | 0.776 | 0.201 |
Analysis of optimal scan window
Table III lists the
statistical significance of differences of the three quantitative
parameter values between different scan phases. For
Ktrans and Kep values, differences between
the values at phases 30 and 50 as well as those between phases 30
and 40 were not statistically significant in the malignant tumor
group (P>0.05). In the benign tumor group, changes in
Ktrans and Kep values between phase 40 and
phase 50 were not statistically significant (P>0.05).
Differences of Ve value between various phases in the
malignant group were not found to be statistically significant
(P>0.05). Differences of Ve value between phases 30
and 40 in the benign tumor group were also not statistically
significant (P>0.05). The Ktrans, Kep and
Ve value analysis confirmed that the optimal scanning
time period was between phase 10 and phase 30 after contrast agent
injection.
| Table III.Statistical significance of
differences between the three indicator values acquired at any two
phases (P-value). |
Table III.
Statistical significance of
differences between the three indicator values acquired at any two
phases (P-value).
|
|
Ktrans | Kep | Ve |
|---|
|
|
|
|
|
|---|
| Phases | Benign | Malignant | Benign | Malignant | Benign | Malignant |
|---|
| 10 vs. 20 | 0.009 | <0.001 | 0.003 | <0.001 | <0.001 | 0.801 |
| 10 vs. 30 | 0.005 | <0.001 | 0.004 | <0.001 | <0.001 | 0.222 |
| 10 vs. 40 | 0.003 | <0.001 | 0.002 | <0.001 | 0.001 | 0.154 |
| 10 vs. 50 | 0.003 | <0.001 | 0.002 | <0.001 | <0.001 | 0.753 |
| 20 vs. 30 | 0.002 | <0.001 | 0.017 | 0.001 | 0.044 | 0.035 |
| 20 vs. 40 | 0.002 | 0.005 | 0.020 | 0.004 | 0.098 | 0.064 |
| 20 vs. 50 | 0.002 | 0.213 | 0.003 | 0.281 | 0.008 | 0.553 |
| 30 vs. 40 | 0.016 | 0.376 | 0.995 | 0.724 | 0.415 | 0.630 |
| 30 vs. 50 | 0.020 | 0.847 | 0.005 | 0.535 | 0.022 | 0.352 |
| 40 vs. 50 | 0.145 | 0.074 | 0.172 | 0.042 | 0.041 | 0.076 |
Discussion
DCE-MRI is capable of detecting changes of the
microvascular structures in tissue, and is particularly useful for
the targeted imaging of tumor angiogenesis. Though the analysis of
this imaging modality is rather simple, the three parameters
Ktrans, Kep and Ve are able to
evaluate the contrast agent diffusion dynamics and hemodynamics in
tissues accurately and improve the diagnostic efficacy for breast
cancer patients (9). They are
effective indicators of the physiological state based on
dual-compartmental pharmacokinetic model analysis, and therefore
are widely adopted in tumor imaging study (10). El Khouli et al (11) and some other studies suggest that
Ktrans and Kep values are statistically
significant in the diagnosis of benign and malignant breast tumors
(12,13). Li et al (14) showed that the Ktrans value
was distinctly higher in malignant breast lesions than in benign
breast lesions. Amarnath et al (15) concluded that Ktrans used
in breast DCE-MRI is a reliable quantitative parameter for
identifying benign and malignant lesions. In another study, Li
et al (16) demonstrated that
Ktrans and Kep values were reduced in benign
breast lesions compared with maliganancies. The present study shows
similar results, indicating that the Ktrans and
Kep values of malignant mammary gland lesions were
significantly higher than those of benign lesions, and that the
difference was statistically significant.
The prostate quantitative parameter analysis
conducted by Ocak et al (17)
showed that the Ktrans and Kep values of
tumor tissue are markedly higher than those in the normal
peripheral zone, while Ve values indicated no
significant difference between the two lesions. The diagnostic
efficacy of changes in Ve values in benign and malignant
tumors remains debatable. The study by Koo et al (10) indicated that the values of
Ve would decrease as malignant breast tumor progresses
to a higher stage. The present study shows that Ve
values have no significant difference between benign and malignant
lesions which is consistent with the study by Ocak et al
(17). The authors of the present
study attempted to observe the trend in changes by analyzing DCE
images at multi-phases, and to explore the significance of the
trend in the identification of lesions. The multiple phase analysis
showed the that Ve value increased in benign lesions as
the scan phase increased, while it exhibited no obvious changes in
malignant tissue. The slope of Ve value change may be a
valuable diagnosis surrogate in the differentiation of benign and
malignant lesions. Our hypothesis for the interpretation of this
phenomenon is that the endothelial structure is more mature in
benign lesions than in malignant lesions; therefore, the filling of
contrast agent into the interstitial structure changes with time in
benign lesions, but remains steady in malignant lesions.
Few studies have been conducted for exploration of
the optimized scanning time window of breast DCE-MRI, due to the
large variety of scanning equipment, contrast agents and injection
speed. In the present study, the scanning time window, was
increased and the indicative parameters at multiple scan phases
were analyzed, and a conclusion regarding the optimized scanning
window following contrast injection was reached. The results
demonstrated that the optimized scanning window is between phase 10
and phase 30, namely between 5 and 15 min after contrast injection,
and the single scan time is 30 sec. In order to reduce scan time
and achieve higher equipment usage efficiency, the best practice is
scanning for 5 min following the contrast injection. In order to
achieve better diagnostic specificity, the semi-quantitative
indicator, time-intensity curve and the Ve value change
trend should be considered by scanning another 15 min after
contrast injection.
In conclusion, this study shows that
Ktrans and Kep values achieved from 3.0 T
DCE-MRI have statistically significant value in the identification
of benign and malignant breast lesions, and that the trend in
Ve value changes can also be used as a supplemental
reference for specifying benign and malignant breast lesions. The
optimized scanning window following contrast agent injection was
determined based on the above analysis. Considering the great
variety of scanning equipment, contrast agents and injection
speeds, and the widely spaced time data points analyzed in this
study, a large cohort of patients, more precise time data point
analysis and more imaging sequence parameter comparison are
required to provide stronger theoretical support for optimized
breast DCE-MRI scanning time in further research.
Acknowledgements
This research was funded by the Project of medical
and health technology development program in Shandong province
(grant no. 2013WS0124).
References
|
1
|
Aberle DR, Chiles C, Gatsonis C, Hillman
BJ, Johnson CD, McClennan BL, Mitchell DG, Pisano ED, Schnall MD
and Sorensen AG: American College of Radiology Imaging Network:
Imaging and cancer: Research strategy of the American College of
Radiology Imaging Network. Radiology. 235:741–751. 2005. View Article : Google Scholar : PubMed/NCBI
|
|
2
|
Leung JW: Screening mammography reduces
morbidity of breast cancer treatment. AJR Am J Roentgenol.
184:1508–1509. 2005. View Article : Google Scholar : PubMed/NCBI
|
|
3
|
Peters NH, Rinkes IH Borel, Zuithoff NP,
Mali WP, Moons KG and Peeters PH: Meta-analysis of MR imaging in
the diagnosis of breast lesions. Radiology. 246:116–124. 2008.
View Article : Google Scholar : PubMed/NCBI
|
|
4
|
Jones EF, Sinha SP, Newitt DC, Klifa C,
Kornak J, Park CC and Hylton NM: MRI enhancement in stromal tissue
surrounding breast tumors: Association with recurrence free
survival following neoadjuvant chemotherapy. PloS One.
8:e619692013. View Article : Google Scholar : PubMed/NCBI
|
|
5
|
Li X, Arlinghaus LR, Ayers GD,
Chakravarthy AB, Abramson RG, Abramson VG, Atuegwu N, Farley J,
Mayer IA, Kelley MC, et al: DCE-MRI analysis methods for predicting
the response of breast cancer to neoadjuvant chemotherapy: Pilot
study findings. Magn Reson Med. 71:1592–1602. 2104. View Article : Google Scholar
|
|
6
|
Baek HM, Chen JH, Nie K, Yu HJ, Bahri S,
Mehta RS, Nalcioglu O and Su MY: Predicting pathologic response to
neoadjuvant chemotherapy in breast cancer by using MR imaging and
quantitative 1H MR spectroscopy. Radiology. 251:653–662.
2009. View Article : Google Scholar : PubMed/NCBI
|
|
7
|
Magometschnigg HF, Helbich T, Brader P,
Abeyakoon O, Baltzer P, Füger B, Wengert G, Polanec S, Bickel H and
Pinker K: Molecular imaging for the characterization of breast
tumors. Expert Rev Anticancer Ther. 14:711–722. 2014. View Article : Google Scholar : PubMed/NCBI
|
|
8
|
Rahbar H and Partridge SC: Multiparametric
MR Imaging of Breast Cancer. Magn Reson Imaging Clin N Am.
24:223–238. 2016. View Article : Google Scholar : PubMed/NCBI
|
|
9
|
Petralia G, Bonello L, Priolo F, Summers P
and Bellomi M: Breast MR with special focus on DW-MRI and DCE-MRI.
Cancer Imaging. 11:76–90. 2011. View Article : Google Scholar : PubMed/NCBI
|
|
10
|
Koo HR, Cho N, Song IC, Kim H, Chang JM,
Yi A, Yun BL and Moon WK: Correlation of perfusion parameters on
dynamic contrast-enhanced MRI with prognostic factors and subtypes
of breast cancers. J Magn Reson Imaging. 36:145–151. 2012.
View Article : Google Scholar : PubMed/NCBI
|
|
11
|
El Khouli RH, Macura KJ, Kamel IR, Jacobs
MA and Bluemke DA: 3-T dynamic contrast-enhanced MRI of the breast:
Pharmacokinetic parameters versus conventional kinetic curve
analysis. AJR Am J Roentgenol. 197:1498–1505. 2011. View Article : Google Scholar : PubMed/NCBI
|
|
12
|
Ma ZS, Wang DW, Sun XB, Shi H, Pang T,
Dong GQ and Zhang CQ: Quantitative analysis of 3-Tesla magnetic
resonance imaging in the differential diagnosis of breast lesions.
Exp Ther Med. 9:913–918. 2015.PubMed/NCBI
|
|
13
|
Yim H, Kang DK, Jung YS, Jeon GS and Kim
TH: Analysis of kinetic curve and model-based perfusion parameters
on dynamic contrast enhanced MRI in breast cancer patients:
Correlations with dominant stroma type. Magn Reson Imaging.
34:60–65. 2016. View Article : Google Scholar : PubMed/NCBI
|
|
14
|
Li J, Yu Y, Zhang Y, Bao S, Wu C, Wang X,
Li J, Zhang X and Hu J: A clinically feasible method to estimate
pharmacokinetic parameters in breast cancer. Med Phys.
36:3786–3794. 2009. View Article : Google Scholar : PubMed/NCBI
|
|
15
|
Amarnath J, Sangeeta T and Mehta SB: Role
of quantitative pharmacokinetic parameter (transfer constant:
K(trans)) in the characterization of breast lesions on MRI. Indian
J Radiol Imaging. 23:19–25. 2013. View Article : Google Scholar : PubMed/NCBI
|
|
16
|
Li L, Wang K, Sun X, Wang K, Sun Y, Zhang
G and Shen B: Parameters of dynamic contrast-enhanced MRI as
imaging markers for angiogenesis and proliferation in human breast
cancer. Med Sci Monit. 21:376–382. 2015. View Article : Google Scholar : PubMed/NCBI
|
|
17
|
Ocak I, Bernardo M, Metzger G, Barrett T,
Pinto P, Albert PS and Choyke PL: Dynamic contrast-enhanced MRI of
prostate cancer at 3 T: A study of pharmacokinetic parameters. AJR
Am J Roentgenol. 189:8492007. View Article : Google Scholar : PubMed/NCBI
|