Introduction
Affinity propagation (AP) is a relatively new
clustering algorithm that was introduced by Frey and Dueck
(1) to determine a so-called
exemplar for clustered data, which is a sample that is most
representative for the respective cluster. It works for any
meaningful measure of similarity between data samples, but does not
require a vector space structure and the exemplars are selected
amongst the data samples observed and not computed as hypothetical
averages of cluster samples (2).
These advantages make AP clustering particularly suitable for
applications in bioinformatics, which has been verified by
previously published studies (3–5). For
instance, Kiddle et al (3)
successfully revealed transcriptional modules in Arabidopsis
thaliana based on temporal clustering of gene expression data
by AP.
Prior to controlling the quality of the partition of
a known number of clusters with AP, Sakellariou et al
(6) supplemented the Krzanowski and
Lai (KL) index (7) to evaluate the
optimum number of clusters, by retaining maxT function in order to
rank the genes in microarray data. This combination offers a more
meaningful way of investigating exemplars or informative genes for
disease and the relative target treatment. However, genes typically
work together with other genes in complex processes associated with
tumors. A network-based approach is capable of extracting
informative and notable genes dependent on biomolecular networks.
For instance, a protein-protein interaction network, co-expression
network and mutual information network (MIN) rather than individual
genes (8,9).
Therefore, the present study combined multiple (m)
AP-KL and MIN to investigate key genes in fibroids, which made the
results, more reliable. mAP-KL was initially implemented to
investigate clusters and exemplars in fibroid, and the support
vector machines (SVMs) model was selected to evaluate the
classification performance of mAP-KL. MIN for cluster genes was
constructed based on the context likelihood of relatedness (CLR)
algorithm, and topological analysis (degree, closeness, betweenness
and transitivity) of exemplars was performed to investigate key
genes in fibroid. Key genes may be potential biomarkers for further
prognostic and therapeutic insights for fibroid.
Materials and methods
Microarray data
In the present study, the gene expression data for
the fibroid (access number E-GEOD-64763) originated from the
A-AFFY-37-Affymetrix GeneChip Human Genome U133A 2.0 [HG-U133A_2]
Platform of the ArrayExpress database (ebi.ac.uk/arrayexpress/), and shared a set of 25
fibroid samples that had been compared to 29 normal controls. The
total samples were divided into two sets according to a ratio of
3:2, and 32 were kept to build a balanced training set (16 fibroid
and 16 normal samples). In total, 22 were used to construct a test
set for the purpose of validating the classification models (9
fibroid and 13 normal samples). In E-GEOD-64763, a total of 22,277
probes were detected.
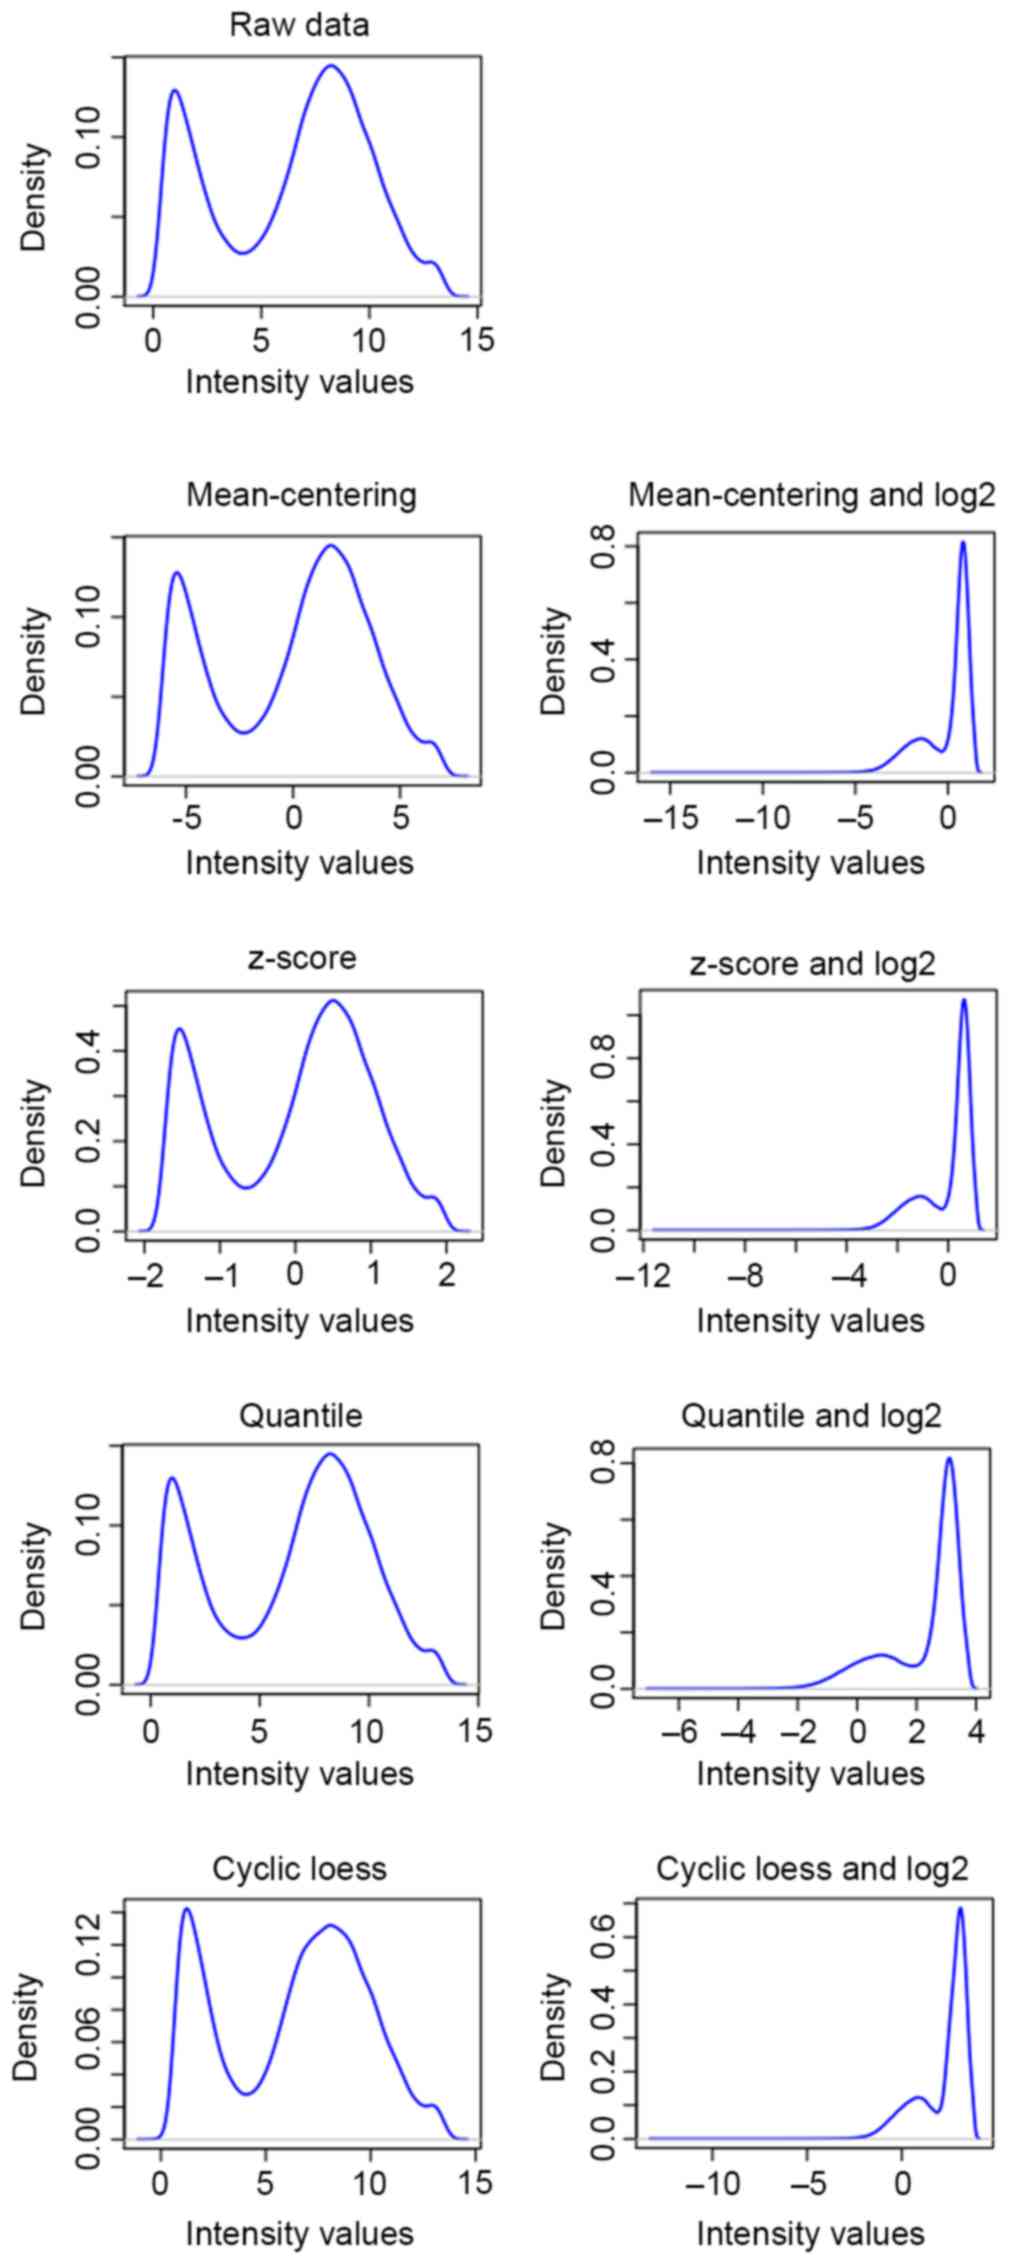
To further control the quality of data and eliminate
batch effects caused by experimental parameters and other factors,
all data underwent mean-centering (10), z-score (11), quantile (12) and cyclic loess (13) normalization across samples, and log2
transformation was subsequently performed on the normalized data.
The preprocessed results are illustrated in Fig. 1 and a better association was
identified between the density and intensity of genes following
cyclic loess preprocessing compared with that of raw data and other
methods. Therefore, the preprocessed training set and test set data
underwent further analysis for fibroid.
mAP-KL
A data-driven and classifier-independent hybrid
feature selection method was implemented, mAP-KL, which included
maxT multiple hypothesis testing (14), KL cluster quality index (7) and the AP clustering algorithm (1), in order to select a small subset of
informative genes of fibroid. The hypothesis was that among the
statistically significant genes there should be clusters of genes
that share similar biological functions correlated with the disease
investigated, thus, instead of keeping a number of the top ranked
genes, it would be more appropriate to define and keep a number of
gene cluster exemplars (6).
Subsequently, the index of KL was applied to determine the number
of clusters solely on the fibroid samples of the training test set.
Finally, the AP clustering method was engaged to detect clusters
and provide a list of the most informative genes of each cluster,
the so-called exemplars.
MaxT hypothesis testing
In the present study, the maxT function, which
computes permutation adjusted P-values for step-down multiple
testing procedures (15), was
employed to rank the genes of the training set and the top N
genes were then reserved for further exploitation (16). The family-wise error rate was
evaluated in order to correct P-values using the Wilcoxon rank sum
statistic with permuted class labels. Furthermore, the maximum
Wilcoxon statistic was recorded for 1,000 random permutations and
the P-value for each gene was estimated as the proportion of the
maximum permutation-based t-statistics that were greater
than the observed value (17).
KL cluster quality index
Prior to clustering analysis with AP, KL as induced
in the ClusterSim package version 0.45–1 (University of Economics,
Wroclaw, Poland) was utilized to define the number of clusters,
which in essence would be the number of representative genes. The
KL was calculated by the following formula:
KL(k)=|∅(k)∅(k+1)
Of which ∅(k)=(k–1)2/PWk–1–k2/PWk
Where k was the number of clusters and
Wk represented the within-cluster sum of squared
errors. The clusters that met a threshold of gene numbers <50
were regarded as KL clusters.
AP clustering algorithm
An AP clustering method included in the APCluster
package version 1.3.2 (Johannes Kepler University, Linz, Austria)
identifies an exemplar for each cluster, which was most
representative for this cluster. It regards each data point as a
node in a network and recursively transmits real-valued messages
along edges of the network until a good set of exemplars and
corresponding clusters emerge (2).
In this final step, n (n=k, the KL index)
clusters were explored among the top N genes according to
the pre-defined number, and a list of n exemplars was
obtained (18). These were expected
to form a classifier to discriminate between the normal and fibroid
classes in a test set that was formulated through retaining only
those n genes required to proceed with the
classification.
Classification and evaluation
In the present study, SVM (19) with linear kernel (20) was applied to evaluate the performance
of mAP-KL. Initially, a five-fold cross-validation was conducted on
the training set to evaluate the potential classification strength
of the models, and then its prediction was computed on a separate
test set.
For the purpose of accessing the classification
results, several measures were selected, which included the area
under the receiver operating characteristics curve (AUC), the true
negative rate (TNR), true positive rate (TPR) and the Matthews
coefficient correlation classification (MCC). In detail, accuracy
(ACC) was one of the most popular performance measures in machine
learning classification; however, it did not take into account the
nature of the incorrect predictions. Therefore, the AUC was used,
as it had been introduced as a better measure for evaluating the
predictive ability of machine learners compared with ACC (21). Additionally, TNR or specificity
represented the ratio of correctly classified negatives to the
actual number of negatives, as well as TPR or sensitivity, which
was defined to be the ratio of positives correctly classified to
the actual number of positives (22). Furthermore, MCC was a measure of the
quality of binary classification and considered the true and false
positive and negatives (23). The
combination of those measures provided an adequate overview of the
classification's performance.
MIN construction and topological
analysis
MIN construction
MIN typically relied on the estimation of mutual
information (MI) between all pairs of variables, and has previously
attracted the attention of the bioinformatics community for the
inference of very large networks (24,25). MIN
construction for cluster related top N genes was comprised
of three steps. The first step was the computation of the MI matrix
(MIM), a square matrix whose i, j-th element was the
mutual information between the random genes Xi
and Xj, and q was a probability
measure.
MIMij=I(Xi;Xj)=∑i,jq(xi,yj)logq(xi,yj)q(xi)q(yj)
The second step was the computation of an edge score
for each pair of nodes by the algorithm. The CLR algorithm was an
extension of the relevance network approach (25) and the MI for each pair of genes was
computed and a score related to the empirical distribution of the
MI values was derived (26). In
particular, instead of considering the information I
(Xi; Xj) between genes
Xi and Xj, it took into account
the edge score:
zij=zi2+zj2
Where zi=max(0,I(Xi;Xj–μi)σi)
Of which µi and
σi represented the sample mean and standard
deviation of the empirical distribution of the values I
(Xi; Xj), respectively.
The final step was to input the genes and edge
scores into the igraph software package (27) and to visualize the MIN.
Topological analysis of MIN
In order to investigate the biological functions and
significance of nodes in the MIN, the importance was characterized
using indices of topological analysis [degree (28), closeness (29), betweenness (30) and transitivity (31)]. The degree quantifies the local
topology of each gene by summing up the number of its adjacent
genes. Closeness centrality was a measure of the average length of
the shortest paths to access all other genes in the network.
Betweenness centrality was a shortest paths enumeration-based
metric in graphs for determining how the neighbors of a node were
interconnected, and was considered the ratio of the node in the
shortest path between two other nodes. Furthermore, transitivity, a
measure for clustering coefficient, gave an indication of the
clustering in the whole network.
Results
In the present study, the top 200 genes in the gene
expression profile were reserved based on maxT multiple hypothesis
testing for further exploitation, and the top 100 genes are listed
in Table I. Following the AP-KL, an
elaborate set of analytical clusters with SVM on the training set
was executed, and validation was conducted on a separate test set
in order to evaluate its performance across the gene expression
data. Meanwhile, MIN for the top 200 genes was constructed and its
topological properties were identified in order to investigate the
roles and significance of cluster genes and exemplars obtained from
mAP-KL in fibroid.
 | Table I.Top 100 genes based on maxT multiple
hypothesis testing. |
Table I.
Top 100 genes based on maxT multiple
hypothesis testing.
| Number | Gene |
|---|
| 1 | IGSF3 |
| 2 | NAV2 |
| 3 | KIF5C |
| 4 | CAPN6 |
| 5 | FMO4 |
| 6 | BAX |
| 7 | EPB41L2 |
| 8 | KCNS3 |
| 9 | COL4A1 |
| 10 | SYBU |
| 11 | GPSM2 |
| 12 | ABLIM3 |
| 13 | CAMKMT |
| 14 | POPDC2 |
| 15 | MAP4K4 |
| 16 |
CALCOCO2 |
| 17 | TIMM44 |
| 18 | NPDC1 |
| 19 | HEPH |
| 20 | ANXA1 |
| 21 | COL4A2 |
| 22 | KCNN1 |
| 23 | PIK3R1 |
| 24 | COPS8 |
| 25 | BCAN |
| 26 | ITM2C |
| 27 | C9orf3 |
| 28 | DCHS1 |
| 29 | ADGRL1 |
| 30 | ALDH2 |
| 31 | PHYHIP |
| 32 | FAM63B |
| 33 | CYR61 |
| 34 | LGALS3 |
| 35 | BCAN |
| 36 | SNCG |
| 37 | PLAT |
| 38 | UST |
| 39 | VAMP2 |
| 40 | SAV1 |
| 41 | COL9A2 |
| 42 | RPL38 |
| 43 | GATA2 |
| 44 | TEX10 |
| 45 | IRF2 |
| 46 | CBX8 |
| 47 | MST1 |
| 48 | PRR5L |
| 49 | PXDN |
| 50 | PRKD1 |
| 51 | PEX7 |
| 52 | TMEM246 |
| 53 | EGFR |
| 54 | HTATIP2 |
| 55 | PDGFC |
| 56 | PCBP2 |
| 57 | SULT1A1 |
| 58 | GCN1L1 |
| 59 | COL5A2 |
| 60 | COPS8 |
| 61 | FBXL7 |
| 62 | LMBRD1 |
| 63 | DPT |
| 64 | PCNA |
| 65 | ADGRE5 |
| 66 | PARVB |
| 67 | SULT1A2 |
| 68 | ACAN |
| 69 | KLF4 |
| 70 | PHLDA3 |
| 71 | BMP7 |
| 72 |
SERPINF1 |
| 73 | ADD3 |
| 74 | VPS13D |
| 75 | MST1 |
| 76 | USP3 |
| 77 | SERINC5 |
| 78 | LRP5 |
| 79 | FAM46A |
| 80 | PA2G4 |
| 81 | AIM1 |
| 82 | TIA1 |
| 83 | SYT11 |
| 84 | MAPK10 |
| 85 | IGFBP6 |
| 86 | KLF4 |
| 87 | FAM131B |
| 88 | C1R |
| 89 | FSD1 |
| 90 | CADM1 |
| 91 | SYT11 |
| 92 | ADIRF |
| 93 | R3HCC1 |
| 94 | SMC6 |
| 95 | PIK3R1 |
| 96 | ARRB1 |
| 97 | SLC48A1 |
| 98 |
TNFRSF10B |
| 99 | DYRK2 |
| 100 | MYO7A |
Clusters and exemplars
By performing the AP clustering algorithm in
conjunction with KL cluster quality for the top 200 genes, the
quantity of clusters with <50 genes was 9, whose gene
compositions are displayed in Table
II. In addition, the gene compositions of different clusters
were varied, and amongst them cluster 5 contained the highest
number of genes (33 genes), whereas, only 12 genes were present in
cluster 2. Furthermore, for each cluster, an exemplar was detected
on the basis of the AP clustering method, which may be important in
the progress of fibroid. From cluster 1 to 9, their exemplars were
CALCOCO2, COL4A2, COPS8, SNCG,
PA2G4, C17orf70, MARK3, BTNL3 and
TBC1D13, respectively.
| Table II.Clusters identified by the mAP-KL
method for fibroids. |
Table II.
Clusters identified by the mAP-KL
method for fibroids.
| Cluster | No. of genes | Genes |
|---|
| 1 | 31 | NAV2, CALCOCO2,
NPDC1, PLAT, RPL38, COPS8, LMBRD1, PCNA, SERPINF1, SERINC5, KLF4,
C1R, ADIRF, R3HCC1, FNBP1L, RTN3, YARS, ABLIM1, IVNS1ABP, TRPS1,
ADD3, C1S, IFT20, UBE2L6, SMARCA2, LOXL2, SUCLG2, RPL38, BCAM,
H1FX, MAFB |
| 2 | 12 | COL4A1, COL4A2,
PDGFC, COL5A2, FN1, COL3A1, PALLD, SOX4, CST3, CD74, SPARC,
FN1 |
| 3 | 21 | HEPH, ANXA1,
PIK3R1, COPS8, ITM2C, C9orf3, DCHS1, ALDH2, CYR61, LGALS3, PXDN,
FBXL7, ADGRE5, PIK3R1, FYN, SMS, ENAH, SPCS3, SLC24A3, GNG11,
CYR61 |
| 4 | 18 | SNCG, HTATIP2,
DPT, SULT1A2, KLF4, AIM1, ARRB1, SLC48A1, NPR1, TPSAB1, HFE, RAC2,
RPS11, TOE1, SLC7A6, TESC, VRK3, SERPINB1 |
| 5 | 33 | KIF5C, CAPN6,
EPB41L2, MAP4K4, ADGRL1, VAMP2, SAV1, TEX10, IRF2, PRKD1, GCN1,
PHLDA3, ADD3, USP3, FAM46A, PA2G4, TIA1, SYT11, MAPK10, IGFBP6,
SMC6, TNFRSF10B, DYRK2, LRP12, NUDT3, TFAP2C, INPP1, ABCC1, ECI2,
FLOT2, PPARD, GPSM2, TFPI |
| 6 | 13 | BAX, GPSM2,
TIMM44, UST, COL9A2, LRP5, CADM1, FAAP100, AEN, TTC27, GSTM5,
KNOP1, C1QL1 |
| 7 | 20 | IGSF3, KCNS3,
POPDC2, GATA2, PCBP2, SULT1A1, FAM131B, SYT11, NRN1, ENOX2, NUDT11,
TDRD7, MTCL1, ALDH1A1, RARRES3, MARK3, ST3GAL2, ST3GAL1,
SLC46A3 |
| 8 | 22 | FMO4, ABLIM3,
CAMKMT, KCNN1, FAM63B, BCAN, CBX8, PRR5L, PARVB, ACAN, BMP7,
VPS13D, FSD1, MYO7A, CDK18, TMEM59L, FLT3LG, NPR1, PLCE1, BTNL3,
POLG, CSPP1 |
| 9 | 18 | SYBU, BCAN,
RTP4, PHYHIP, MST1, PEX7, TMEM246, EGFR, MST1, PTK2B, TBC1D13,
RALGDS, SP140L, ZMYND8, CCDC22, CLCN7, PIDD1, NKX3-1, |
Evaluation by the SVM model
The test set consisted of the 9 exemplars. SVM with
linear kernel was used to possess the performance of mAP-KL. This
method achieved the highest classification scores (AUC=1.00,
TNR=1.00, TPR=1.00 and MCC=1.00); therefore, it was concluded that
the classification results were almost ideal during the SVM
evaluation, and inferred that the mAP-KL methodology that combined
ranking-filtering and cluster analysis was feasible and suitable
for identifying exemplars of fibroid.
Topological analysis of MIN
The ideal evaluation of the classification for the
mAP-KL method gave more confidence to the significance of 9
exemplars in fibroid, whereas those were also expected to form a
classifier or module that is distinct between the normal controls
and fibroid patients. Therefore, an MIN was constructed for the top
200 genes associated with cluster genes. A total of 178 genes were
mapped to the MIN and 820 interactions were observed (Fig. 2). The topological properties of the 9
exemplars in the MIN are shown in Table III. The results for exemplars were
inconsistent due to different methods, except for SNCG and
COL4A2. Notably, the degree, closeness, betweenness and
transitivity of SNCG were the highest among exemplars with
127, 263.29, 3.89 and 1122, separately. The second highest results
were observed in COL4A2 with a degree, closeness,
betweenness and transitivity of 110, 237.21, 3.71 and 1,075,
respectively. Therefore, the two exemplars were more important for
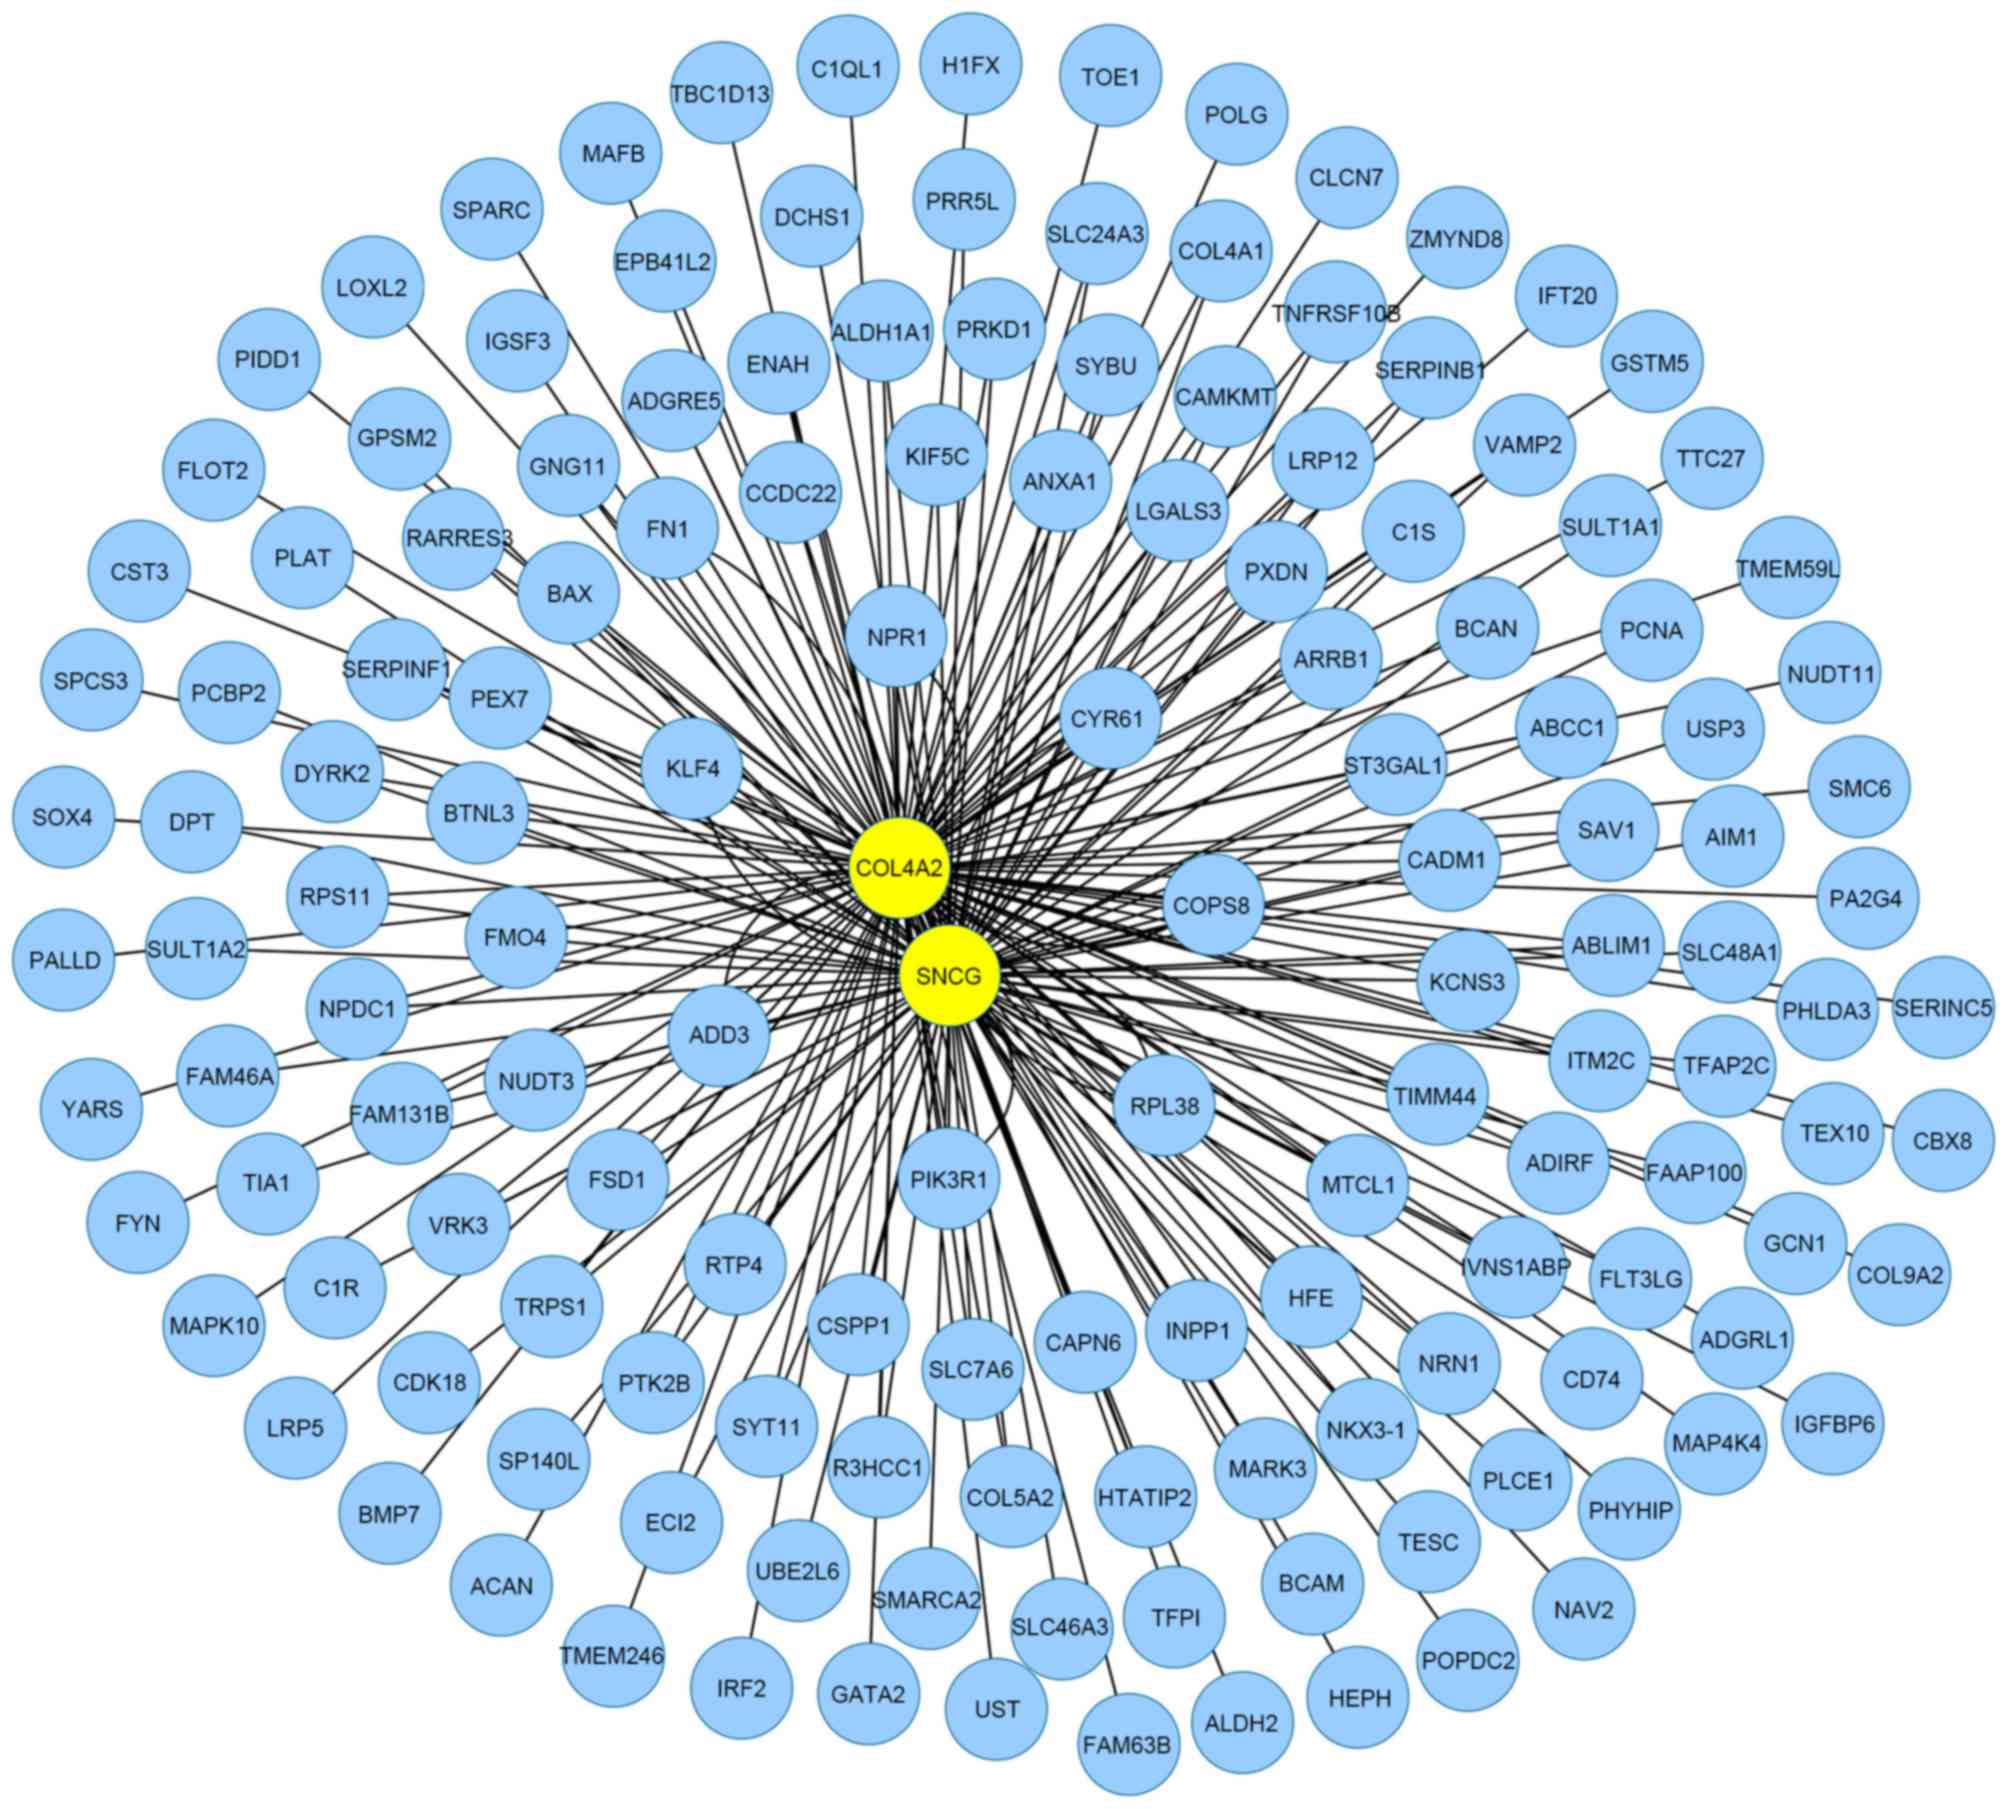
fibroid, thus we mined their connections from the MIN. The two
genes were able to interact with each other and build a small
module (Fig. 3) with 149 genes and
222 interactions. Furthermore, a MIN with 174 nodes and 1,002
interactions for the top 200 ranked genes in the microarray data
was demonstrated in Fig. 4.
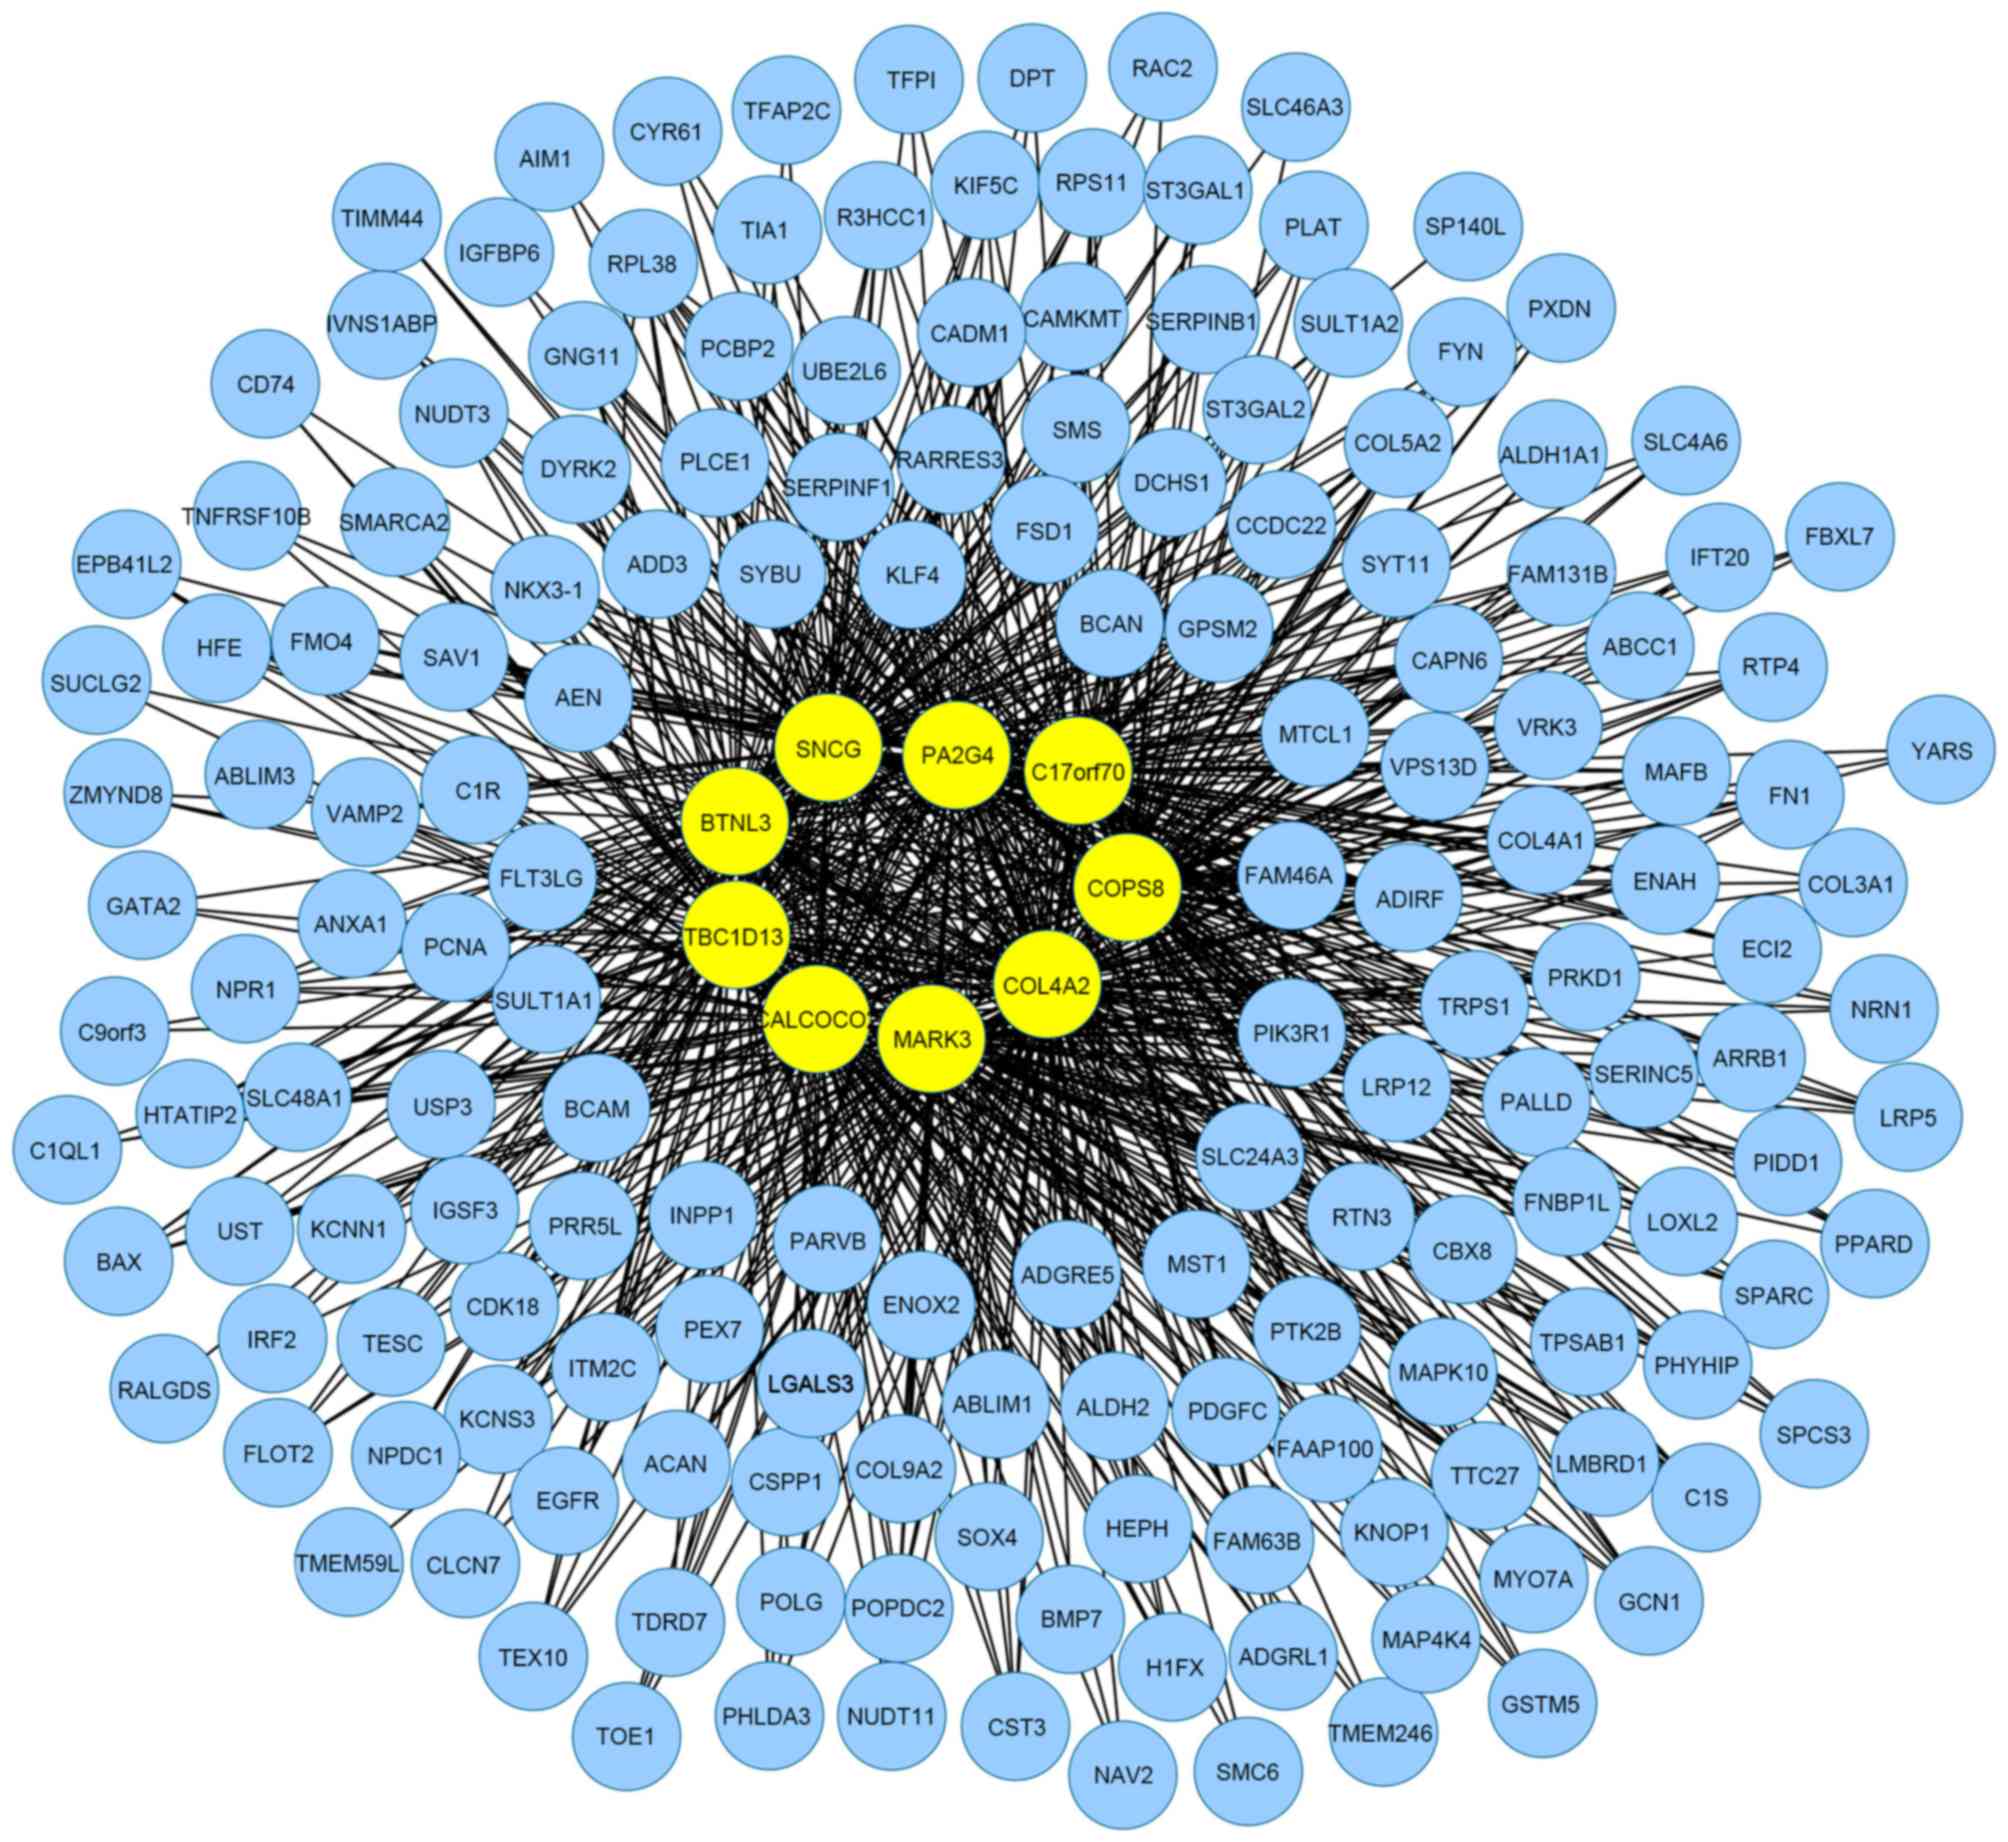 | Figure 2.Mutual information network for
clusters related the top 200 genes of fibroid. There were 174 nodes
and 820 edges, where nodes represented genes, and edges were the
interactions between two genes. The yellow nodes, CALCOCO2,
COL4A2, COPS8, SNCG, PA2G4,
C17orf70, MARK3, BTNL3 and TBC1D13,
stood for exemplars of nine clusters identified via the multiple
affinity propogation-Krzanowski and Lai method. |
| Table III.Topological properties of exemplars
in mutual information network. |
Table III.
Topological properties of exemplars
in mutual information network.
| Exemplar | Degree | Closeness | Betweenness | Transitivity |
|---|
|
CALCOCO2 | 104 | 174.81 | 3.54 | 1022 |
| COL4A2 | 110 | 237.21 | 3.71 | 1075 |
| COPS8 | 88 | 147.27 | 3.29 |
657 |
| SNCG | 127 | 263.29 | 3.89 | 1122 |
| PA2G4 | 91 | 152.57 | 1.83 |
35 |
|
C17orf70 | 85 | 155.03 | 0.50 |
0 |
| MARK3 | 93 | 149.75 | 3.05 |
44 |
| BTNL3 | 87 | 131.67 | 3.01 |
0 |
| TBC1D13 | 90 | 158.98 | 3.55 |
897 |
Discussion
Fibroid, also known as uterine leiomyoma or uterine
fibroid, is begin smooth muscle neoplasm of the uterus and the most
widespread gynecological problem amongst women (32). Important symptoms of fibroid include
abnormal uterine bleeding, heavy or painful menstrual periods,
abdominal discomfort or bloating, painful defecation, back ache,
urinary frequency or retention, and in some cases, infertility
(33). Although surgical staging and
nomograms may help predict the clinical outcome, the five-year
survival rate for uterus-confined disease remains <50% (34). Therefore, understanding the molecular
biology and investigating potential biomarkers of fibroid may
provide further prognostic and therapeutic insights.
In the present study, nine exemplars were
investigated for clusters, which were obtained from the top 200
genes via the mAP-KL method, including CALCOCO2,
COL4A2, COPS8, SNCG and PA2G4.
Subsequently, the SVM model was used to assess the performance of
the mAP-KL method to classify normal controls and fibroid patients,
and the results demonstrated that there was a good classification,
which indicated the feasibility of the mAP-KL method to identify
exemplars in fibroid. In order to further explore the biological
significance of exemplars, the topological analysis (degree,
closeness, betweenness and transitivity) for MIN constructed by the
CLR algorithm were conducted and two key genes, SNCG and
COL4A2, were obtained resulting from their better
topological properties compared with the other seven genes.
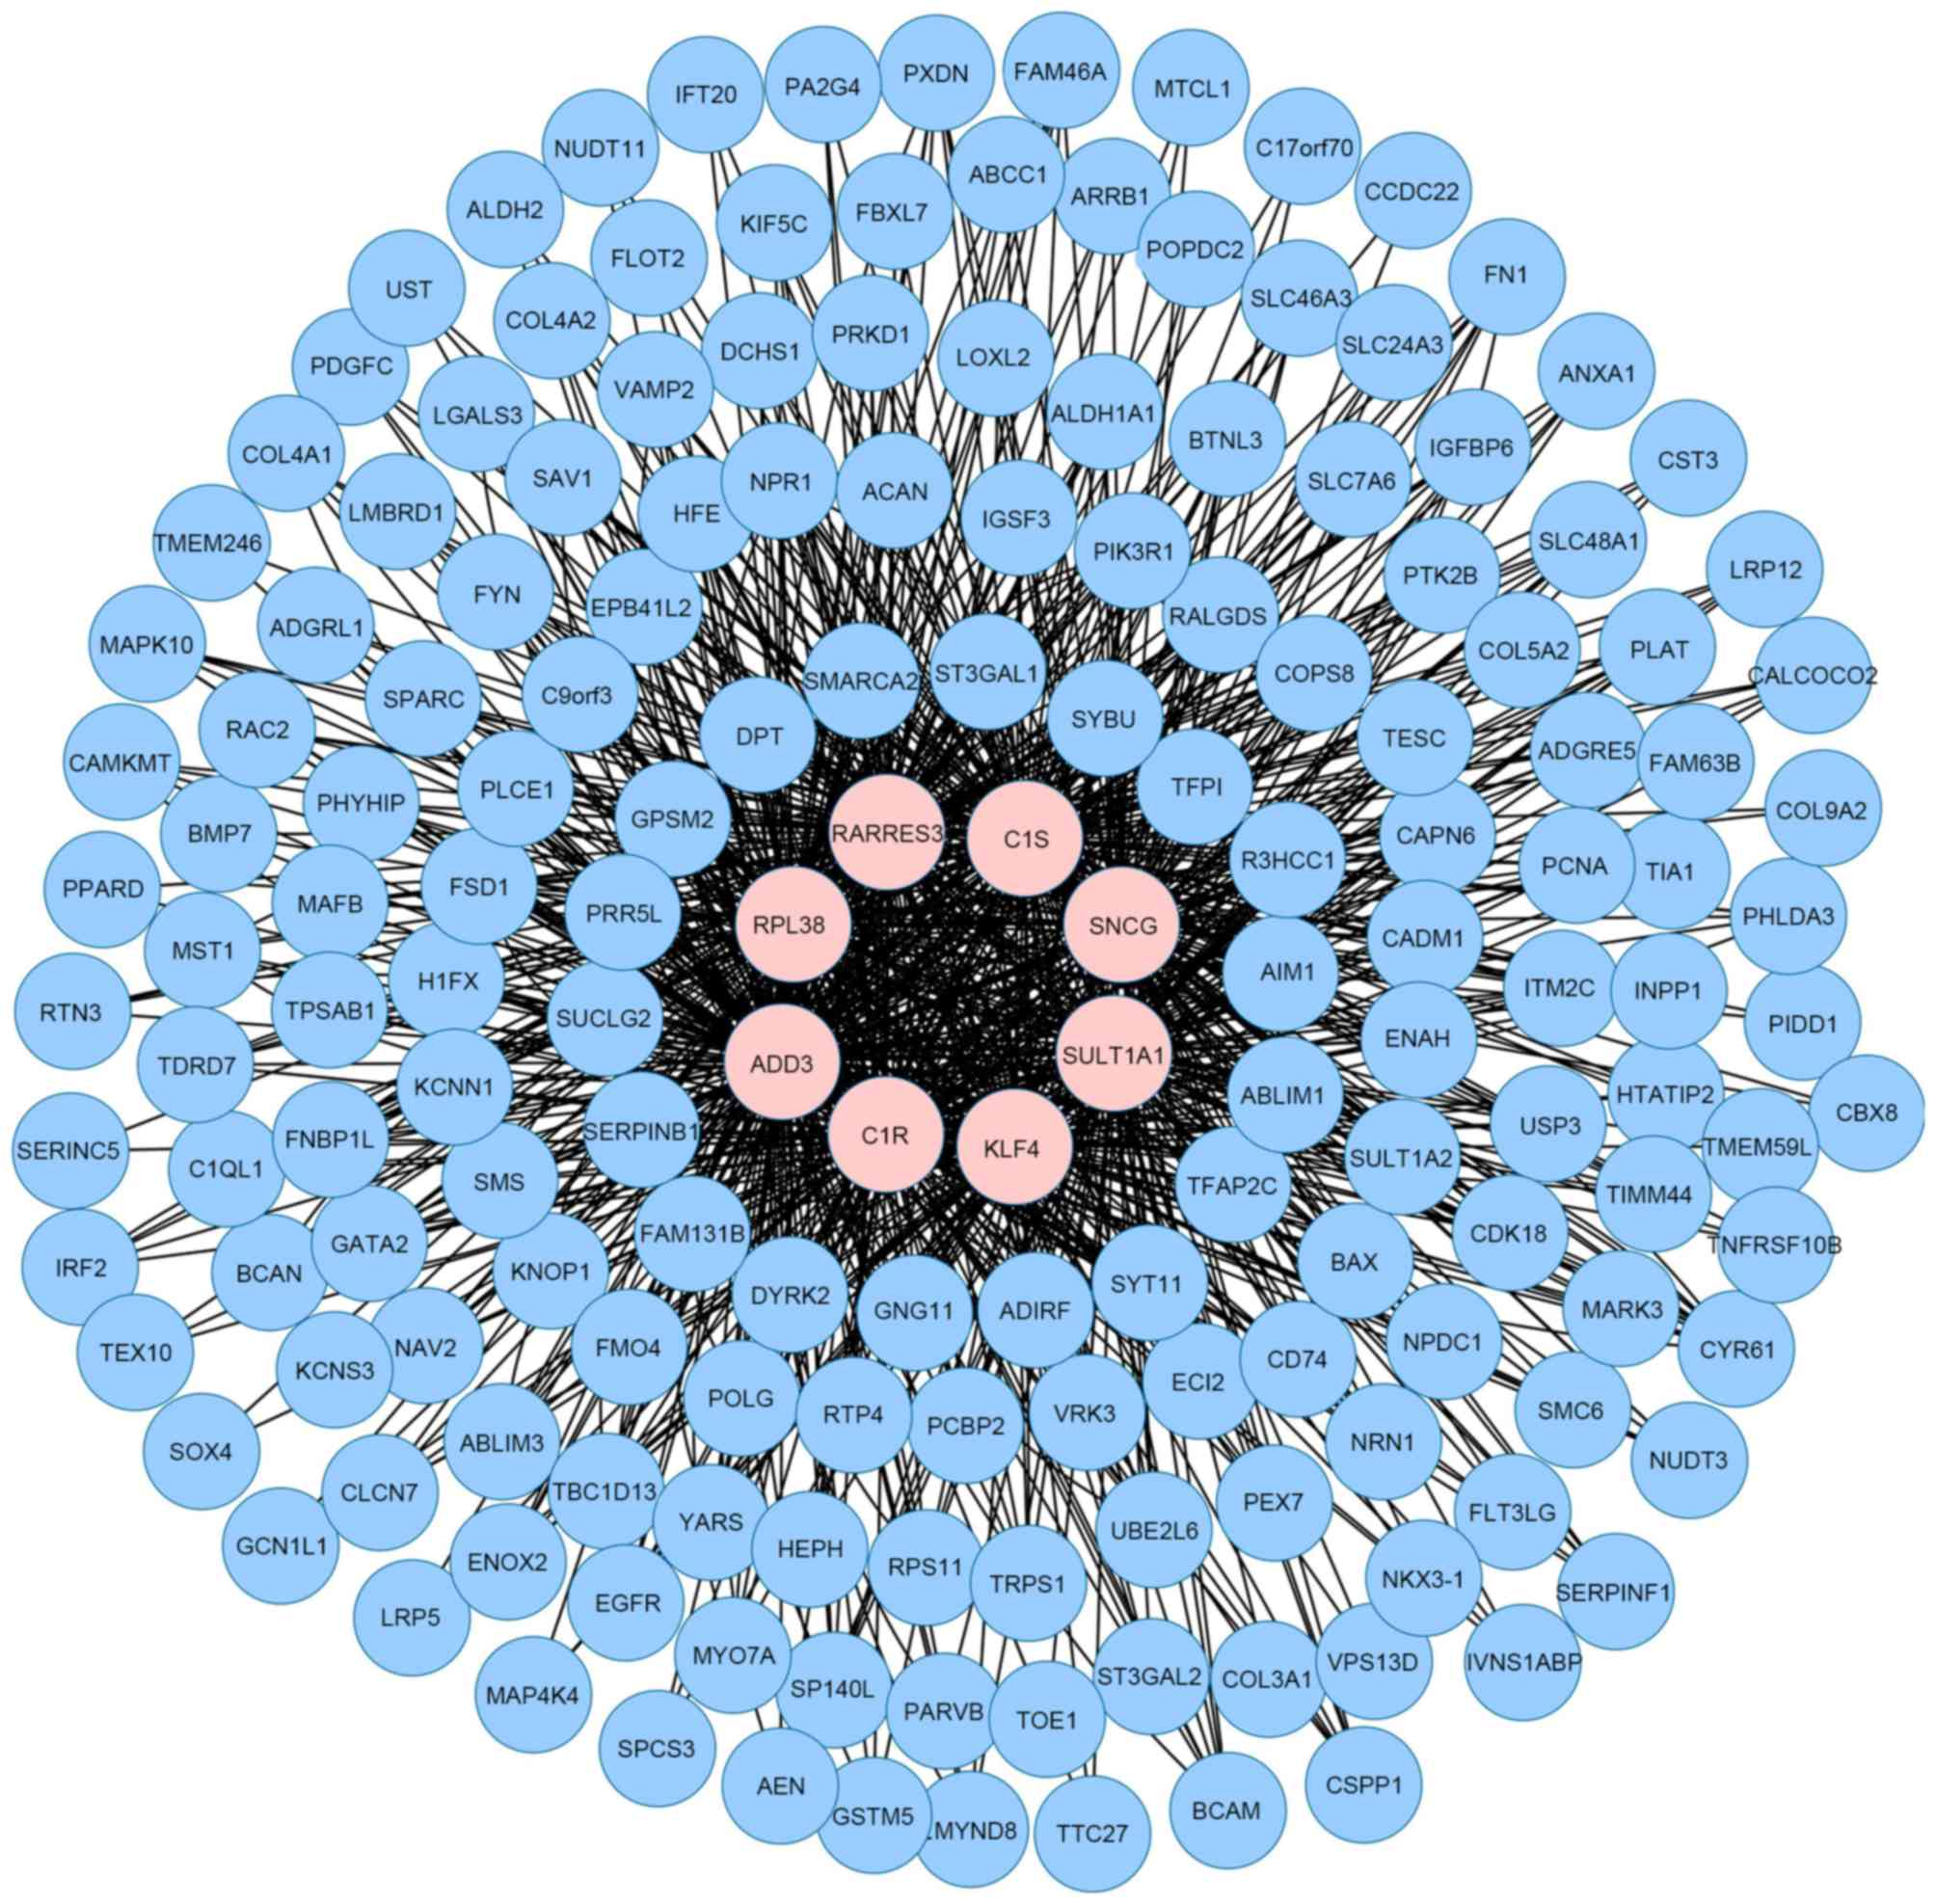
Constructing the MIN for the cluster related top 200
genes and building a network for them allowed for the determination
of the activities of the genes in the network. Fig. 4 shows the MIN for the 200 top ranked
genes in the microarray data, but four types of topological
properties had no intersections and it may be inferred that this
network was not as strict as the cluster MIN. In general, the
degree was a familiar index, thus genes with a quantile of the top
5% degree distributions were defined as hub genes. Therefore, 8 hub
genes were obtained in total, which included RARRES3,
RPL38, ADD3, C1R, KLF4, SULT1A1,
SNCG and C1S. In addition, there were great
differences between exemplars and hub genes, except for one common
gene, SNCG.
SNCG is a member of the synuclein neuronal
protein family along with SNCA and SNCB, and is
highly tissue-specific. In addition, it is expressed at presynaptic
terminals in the brain and the peripheral nervous system (35). It promotes migration, invasion and
metastasis of tumor cells (36),
which have proven that expression of SNCG protein is
elevated in the advanced stages of various types of cancers,
including ovarian (37), lung, liver
(38), esophagus (39), colon (38) and in particular, breast (40,41). For
example, Singh and Jia (41)
revealed that SNCG protein expression was correlated with
pathological factors, including lymph node metastasis, tumor size
and stage, and follow-up revealed that the survival rate of
patients with SNCG-positive protein expression were
significantly lower than the patients with negative expression for
438 cases with breast cancer. Furthermore, it had been demonstrated
that overexpression of SNCG was a predictor for aggressive
tumor behavior and adverse outcome in patients with endometrial
cancer (42), and was a prognostic
tool and therapeutic target in uterine serous carcinoma (43). However, there is currently no
published research reporting the association between SNCG
and fibroids, although it correlated with other uterine-associated
cancers as described above. To the best of our knowledge the
present study proposed for the first time that SNCG acts as
a key role in fibroid.
COL4A2 was the other key gene for fibroids,
which was implicated in extracellular matrix formation and encoded
for collagen α, which is one of the main components of the
endothelial basement membrane (44).
Previous research reported that COL4A2 was overexpressed in
fibroid, and that it displayed an anti-angiogenic gene expression
profile in fibroids when compared with adjacent normal myometrium.
These observations may explain the reduced microvascular density
observed in fibroids relative to the myometrium (45) and was in accordance with the reduced
microvessel density based on anti-von Willebrand factor
immunostaining that was observed in fibroid with respect to normal
myometrium (46). Additionally,
Gilden et al (47) suggested
that protein expression of COL4A2, versican and fibromodulin
was increased in untreated leiomyoma cells compared with untreated
patient-matched myometrial cells. Therefore, COL4A2 was
differentially expressed between normal controls and fibroids.
In conclusion, nine exemplars were identified based
on the mAP-KL method, and two key genes (SNCG and
COL4A2) were investigated according to a topological
analysis of MIN. These genes may be potential biomarkers for the
detection and therapy of fibroids. Furthermore, the present study
may give an insight for future studies associated with fibroid.
References
|
1
|
Frey BJ and Dueck D: Clustering by passing
messages between data points. Science. 315:972–976. 2007.
View Article : Google Scholar : PubMed/NCBI
|
|
2
|
Bodenhofer U, Kothmeier A and Hochreiter
S: APCluster: An R package for affinity propagation clustering.
Bioinformatics. 27:2463–2464. 2011. View Article : Google Scholar : PubMed/NCBI
|
|
3
|
Kiddle SJ, Windram OP, McHattie S, Mead A,
Beynon J, Buchanan-Wollaston V, Denby KJ and Mukherjee S: Temporal
clustering by affinity propagation reveals transcriptional modules
in Arabidopsis thaliana. Bioinformatics. 26:355–362. 2010.
View Article : Google Scholar : PubMed/NCBI
|
|
4
|
Woźniak M, Tiuryn J and Dutkowski J:
MODEVO: Exploring modularity and evolution of protein interaction
networks. Bioinformatics. 26:1790–1791. 2010. View Article : Google Scholar : PubMed/NCBI
|
|
5
|
Wang CW, Chen KT and Lu CL: iPARTS: An
improved tool of pairwise alignment of RNA tertiary structures.
Nucleic Acids Res. 38:(Web Server issue). W340–W347. 2010.
View Article : Google Scholar : PubMed/NCBI
|
|
6
|
Sakellariou A, Sanoudou D and Spyrou G:
Combining multiple hypothesis testing and affinity propagation
clustering leads to accurate, robust and sample size independent
classification on gene expression data. BMC bioinformatics.
13:2702012. View Article : Google Scholar : PubMed/NCBI
|
|
7
|
Krzanowski WJ and Lai Y: A criterion for
determining the number of groups in a data set using sum-of-squares
clustering. Biometrics. 44:23–34. 1988. View Article : Google Scholar
|
|
8
|
Liu ZP, Wang Y, Zhang XS and Chen L:
Network-based analysis of complex diseases. IET Syst Biol. 6:22–33.
2012. View Article : Google Scholar : PubMed/NCBI
|
|
9
|
Chen L, Wang RS and Zhang XS:
Reconstruction of Gene Regulatory NetworksBiomolecular Networks.
John Wiley & Sons, Inc.; pp. 47–87. 2009, View Article : Google Scholar
|
|
10
|
Wylie D, Shelton J, Choudhary A and Adai
AT: A novel mean-centering method for normalizing microRNA
expression from high-throughput RT-qPCR data. BMC Res Notes.
4:5552011. View Article : Google Scholar : PubMed/NCBI
|
|
11
|
Cheadle C, Vawter MP, Freed WJ and Becker
KG: Analysis of microarray data using Z score transformation. J Mol
Diagn. 5:73–81. 2003. View Article : Google Scholar : PubMed/NCBI
|
|
12
|
Bolstad BM, Irizarry RA, Astrand M and
Speed TP: A comparison of normalization methods for high density
oligonucleotide array data based on variance and bias.
Bioinformatics. 19:185–193. 2003. View Article : Google Scholar : PubMed/NCBI
|
|
13
|
Ballman KV, Grill DE, Oberg AL and
Therneau TM: Faster cyclic loess: Normalizing RNA arrays via linear
models. Bioinformatics. 20:2778–2786. 2004. View Article : Google Scholar : PubMed/NCBI
|
|
14
|
Pollard K, Dudoit S and van der Laan M:
Multiple testing procedures: R multtest package and applications to
genomics. UC Berkeley Division of Biostatistics Working Paper
Series. Working Paper 164. http://www.bepress.com/ucbbiostat/paper1642004.
|
|
15
|
Westfall PH and Young SS: Resampling-Based
Multiple Testing: Examples and Methods for P-Value Adjustment. John
Wiley & Sons; New York: 1993
|
|
16
|
Sakellariou A, Sanoudou D and Spyrou G:
Investigating the minimum required number of genes for the
classification of neuromuscular disease microarray data. IEEE Trans
Inf Technol Biomed. 15:349–355. 2011. View Article : Google Scholar : PubMed/NCBI
|
|
17
|
Jeffery IB, Higgins DG and Culhane AC:
Comparison and evaluation of methods for generating differentially
expressed gene lists from microarray data. BMC Bioinformatics.
7:3592006. View Article : Google Scholar : PubMed/NCBI
|
|
18
|
R Development Core Team, . R: A Language
and Environment for Statistical Computing. R Foundation for
Statistical Computing; Vienna: 2012
|
|
19
|
Chang CC and Lin CJ: LIBSVM: A library for
support vector machines. ACM Transactions on Intelligent Systems
and Technology (TIST). 2:272011.
|
|
20
|
Aha DW, Kibler D and Albert MK:
Instance-based learning algorithms. Machine Learning. 6:37–66.
1991. View Article : Google Scholar
|
|
21
|
Huang J and Ling CX: Using AUC and
accuracy in evaluating learning algorithms. IEEE Transactions on
Knowledge and Data Engineering. 17:299–310. 2005. View Article : Google Scholar
|
|
22
|
Baldi P, Brunak S, Chauvin Y, Andersen CA
and Nielsen H: Assessing the accuracy of prediction algorithms for
classification: An overview. Bioinformatics. 16:412–424. 2000.
View Article : Google Scholar : PubMed/NCBI
|
|
23
|
Kantardjieff KA and Rupp B: Matthews
coefficient probabilities: Improved estimates for unit cell
contents of proteins, DNA and protein-nucleic acid complex
crystals. Protein Sci. 12:1865–1871. 2003. View Article : Google Scholar : PubMed/NCBI
|
|
24
|
Butte AJ and Kohane IS: Mutual information
relevance networks: Functional genomic clustering using pairwise
entropy measurements. Pac Symp Biocomput. 418–429. 2000.PubMed/NCBI
|
|
25
|
Faith JJ, Hayete B, Thaden JT, Mogno I,
Wierzbowski J, Cottarel G, Kasif S, Collins JJ and Gardner TS:
Large-scale mapping and validation of Escherichia coli
transcriptional regulation from a compendium of expression
profiles. PLoS Biol. 5:e82007. View Article : Google Scholar : PubMed/NCBI
|
|
26
|
Meyer PE, Lafitte F and Bontempi G: Minet:
AR/Bioconductor package for inferring large transcriptional
networks using mutual information. BMC Bioinformatics. 9:4612008.
View Article : Google Scholar : PubMed/NCBI
|
|
27
|
Csardi G and Nepusz T: Igraph-package.
2008, http://cneurocvs.rmki.kfki.hu/igraph/doc/R/aaa-igraph-package.html
|
|
28
|
Haythornthwaite C: Social network
analysis: An approach and technique for the study of information
exchange. Library & Information Science Research. 18:323–342.
1996. View Article : Google Scholar
|
|
29
|
Wasserman S: Social network analysis:
Methods and applications. Cambridge Univ Press. 25:111994.
|
|
30
|
Barthelemy M: Betweenness centrality in
large complex networks. Eur Physical J B. 38:163–168. 2004.
View Article : Google Scholar
|
|
31
|
Schank T and Wagner D: Approximating
clustering-coefficient and transitivity. J Graph Algorithms
Applications. 9:265–275. 2005. View Article : Google Scholar
|
|
32
|
Islam MS, Protic O, Giannubilo SR, Toti P,
Tranquilli AL, Petraglia F, Castellucci M and Ciarmela P: Uterine
leiomyoma: Available medical treatments and new possible
therapeutic options. J Clin Endocrinol Metab. 98:921–934. 2013.
View Article : Google Scholar : PubMed/NCBI
|
|
33
|
Bulun SE: Uterine fibroids. N Engl J Med.
369:1344–1355. 2013. View Article : Google Scholar : PubMed/NCBI
|
|
34
|
Zivanovic O, Jacks LM, Iasonos A, Leitao
MM Jr, Soslow RA, Veras E, Chi DS, Abu-Rustum NR, Barakat RR,
Brennan MF and Hensley ML: A nomogram to predict postresection
5-year overall survival for patients with uterine leiomyosarcoma.
Cancer. 118:660–669. 2012. View Article : Google Scholar : PubMed/NCBI
|
|
35
|
Lavedan C, Leroy E, Dehejia A, Buchholtz
S, Dutra A, Nussbaum RL and Polymeropoulos MH: Identification,
localization and characterization of the human gamma-synuclein
gene. Hum Genet. 103:106–112. 1998. View Article : Google Scholar : PubMed/NCBI
|
|
36
|
Zhuang Q, Liu C, Qu L and Shou C:
Synuclein-γ promotes migration of MCF7 breast cancer cells by
activating extracellular-signal regulated kinase pathway and
breaking cell-cell junctions. Mol Med Rep. 12:3795–3800.
2015.PubMed/NCBI
|
|
37
|
Mori K, Akers S, Bshara W, et al: Gamma
synuclein expression in ovarian cancer. Gynecol Oncol. 131:2722013.
View Article : Google Scholar
|
|
38
|
Guo C, Sun L, Liu Q, Xie YB and Wang X:
SNCG expression and clinical significance in colorectal cancer
liver metastasis. Zhonghua Wei Chang Wai Ke Za Zhi. 15:625–628.
2012.(In Chinese). PubMed/NCBI
|
|
39
|
Shi L, Zheng S, Zhao Y, Wang JW and Zhan
XH: Expressions of SNCG in gastric adenocarcinoma and its clinical
significances. Pro Mod Bio. 11:1532–1535. 2011.
|
|
40
|
Min L, Ma R, Yuan H, Liu CY, Dong B, Zhang
C, Zeng Y, Wang L, Guo JP, Qu LK, et al: Combined expression of
metastasis related markers Naa10p, SNCG and PRL-3 and its
prognostic value in breast cancer patients. Asian Pac J Cancer
Prev. 16:2819–2826. 2015. View Article : Google Scholar : PubMed/NCBI
|
|
41
|
Singh VK and Jia Z: Targeting
synuclein-gamma to counteract drug resistance in cancer. Expert
Opin Ther Targets. 12:59–68. 2008. View Article : Google Scholar : PubMed/NCBI
|
|
42
|
Mhawech-Fauceglia P, Wang D, Syriac S,
Godoy H, Dupont N, Liu S and Odunsi K: Synuclein-γ (SNCG) protein
expression is associated with poor outcome in endometrial
adenocarcinoma. Gynecol Oncol. 124:148–152. 2012. View Article : Google Scholar : PubMed/NCBI
|
|
43
|
Morgan J, Hoekstra AV, Chapman-Davis E,
Hardt JL, Kim JJ and Buttin BM: Synuclein-gamma (SNCG) may be a
novel prognostic biomarker in uterine papillary serous carcinoma.
Gynecol Oncol. 114:293–298. 2009. View Article : Google Scholar : PubMed/NCBI
|
|
44
|
Kuo DS, Labelle-Dumais C and Gould DB:
COL4A1 and COL4A2 mutations and disease: Insights into pathogenic
mechanisms and potential therapeutic targets. Hum Mol Genet.
21:R97–R110. 2012. View Article : Google Scholar : PubMed/NCBI
|
|
45
|
Weston G, Trajstman AC, Gargett CE,
Manuelpillai U, Vollenhoven BJ and Rogers PA: Fibroids display an
anti-angiogenic gene expression profile when compared with adjacent
myometrium. Mol Hum Reprod. 9:541–549. 2003. View Article : Google Scholar : PubMed/NCBI
|
|
46
|
Poncelet C, Fauvet R, Feldmann G, Walker
F, Madelenat P and Darai E: Prognostic value of von Willebrand
factor, CD34, CD31, and vascular endothelial growth factor
expression in women with uterine leiomyosarcomas. J Surg Oncol.
86:84–90. 2004. View Article : Google Scholar : PubMed/NCBI
|
|
47
|
Gilden M, Malik M, Britten J, Delgado T,
Levy G and Catherino WH: Leiomyoma fibrosis inhibited by liarozole,
a retinoic acid metabolic blocking agent. Fertil Steril.
98:1557–1562. 2012. View Article : Google Scholar : PubMed/NCBI
|