Introduction
Gliomas are the most common type of primary brain
tumor seen in the clinic and account for around 80% of all
malignant intracranial tumors (1).
Although rare (the overall age-adjusted incidence rate is 4.67–5.73
per 100,000 persons), gliomas can cause substantial morbidity and
mortality (1). Gliomas can be
subcategorized into four grades (I–IV) based on histopathological
evaluation and clinical criteria (2), and those that proliferate aggressively
(i.e., high grade) are associated with poor prognosis (3). Glioblastoma is a high-grade astrocytoma
that shows invasive proliferation and has a poorly defined tumor
edge (4). Microsurgical resection
with adjuvant radiotherapy and chemotherapy is currently the
treatment of choice for glioblastoma (5). However, glioblastoma is associated with
a high relapse rate after surgery, and the median survival is only
around 15 months (4,6). To optimize surgery, it is important
that the extent of the tumor invasion within the brain is
accurately evaluated before the operation is undertaken. In
addition, the ability to determine tumor extent allows the response
to treatment to be monitored accurately.
A variety of clinical imaging techniques are
available for evaluating glioblastoma (5). Although computed tomography (CT) with
contrast can identify certain features of a glioblastoma (which
typically presents as a heterogeneous hyperdense ring with
hypodense core), contrast-enhanced magnetic resonance imaging (MRI)
remains the investigation of choice. In contrast-enhanced MR
images, a glioblastoma typically appears as a contrast-enhanced
mass with a ring of enhancement and a hypointense core of central
necrosis. However, the tumor margins are often poorly defined in
MRI sequences, and it can be difficult to distinguish tumor tissue
from radiotherapy-induced non-specific changes in surrounding
tissues. In addition, traditional or contrast CT and MRI provide
little information on tumor grade. Magnetic resonance spectroscopy
(which evaluates tissue metabolites) and dynamic susceptibility
contrast MRI (which evaluates vascularity) can provide information
regarding the aggressiveness or grade of a tumor, but these
techniques have yet to gain widespread acceptance as standard
imaging approaches for glioblastoma. Positron emission tomography
(PET) with 2-fluoro-2-deoxy-D-glucose (FDG) is capable of assessing
tumor cell metabolism, and its findings have been shown to
correlate with histopathology results and disease course.
Nonetheless, FDG-PET is an expensive imaging modality that has also
failed to gain widespread acceptance. Thus, accurately evaluating a
glioblastoma in the clinic, with a view to planning surgery or
assessing treatment efficacy, remains challenging (7).
Single-source spectral CT is a relatively new
technique that obtains dual-energy images by rapidly alternating
between two peak voltage settings. Spectral CT enables the
reconstruction of monochromatic spectral images with energies
ranging from 40 to 140 keV. Based on the values at any
monochromatic energy of two known materials (water and iodine), the
CT values can be calculated to obtain the density distribution, CT
value distribution, Hounsfield unit (HU) curves and
material-specific images; these data can be used for qualitative
and quantitative analysis of material decomposition (8,9). An
important advantage of spectral CT is that the selection of an
appropriate monochromatic energy can reduce beam-hardening
artifacts and optimize density resolution (8). Therefore, quantitative spectral CT is
well suited to analyzing the biological features of the necrotic,
solid and peripheral regions of a tumor and of adjacent normal
tissues. Numerous studies (8–11) have
demonstrated that spectral CT-based material decomposition can
accurately distinguish and quantify a specific component from a
mixture and reflect the blood supply of a tissue lesion.
Furthermore, several investigations have reported that spectral CT
shows promise as an imaging modality for pancreatic carcinoma
(12), brain aneurysms (13) and liver tumors (14). However, to the best of our knowledge,
no previous preclinical or clinical studies have assessed the
utility of spectral CT for the evaluation of glioblastoma.
We hypothesized that spectral CT would provide
useful information regarding glioblastoma margins, composition
differences between various tumor regions, and tumor grade. Thus,
the aim of the present preclinical study was to compare the results
of spectral CT imaging with histopathological analyses in a rat
model of glioblastoma in order to explore the potential of spectral
CT for evaluating glioblastoma extent and grade. The rat C6
malignant glioma was used because it is similar to human
glioblastoma in terms of tumor proliferation and biological
behavior (WHO grade IV) and is considered a useful animal model for
the study of imaging techniques (14). Another advantage of the rat C6 glioma
is that it has a rich blood supply and thus shows strong
enhancement and high tissue contrast resolution.
Materials and methods
Ethics statement
The study protocol was approved by the Ethics
Committees of the Lanzhou University Second Hospital, Lanzhou,
China (2015B-005).
Culture of C6 glioma cells
C6 glioma cells were purchased from the Cell Bank of
the Shanghai Institute of Life Sciences, Chinese Academy of
Sciences (Shanghai, China), and cultured in Dulbecco's modified
eagle medium (DMEM; Gibco BRL, Grand Island, NY, USA) supplemented
with 10% fetal bovine serum (FBS; Hyclone, Logan, UT, USA), 100
U/ml penicillin and 100 µg/ml streptomycin (Hyclone) at 37°C with
5% CO2.
Rat model of glioblastoma
All animal experiments were approved by the ethics
committee of the No. 2 Hospital Affiliated to Lanzhou University
(Lanzhou, China). Ten-week-old male Wistar rats (n=15)
weighing 280–300 g were purchased from the Animal Experiment Center
of Gansu College of Traditional Chinese Medicine (Lanzhou, China)
and maintained in a standardized specific pathogen-free animal
facility. Each rat was anesthetized by intraperitoneal injection of
10% chloral hydrate (4 ml/kg) and fixed in a prone position on a
murine stereotactic device. A 1-cm vertical incision was made at
the lower right position along the sagittal direction, from the
middle of the horizontal line between the eyes. A 0.6-mm-diameter
drill was used to open the skull 1-mm above and 4-mm to the right
of the bregma. A suspension of C6 cells (10 µl, 1.0×10⁵
cells/µl) at the logarithmic growth phase was injected slowly (over
a 5-min period) into the brain. The needle was slowly removed 5 min
after the injection had finished. The incision was then sutured and
sterilized. Subsequently, the rat was maintained as normal
(15). C6 gliomas were observed to
grow rapidly and reach a size of 2–4 mm at 12 days. Without
intervention, rats bearing C6 gliomas usually die after 3–4 weeks;
therefore, we chose to perform CT scanning on day 12 after tumor
cell injection.
CT scanning
Twelve days after seeding of C6 cells, each rat was
anesthetized with an intraperitoneal injection of 10% chloral
hydrate (4 ml/kg) and fixed in a prone position. A disposable
intravenous infusion needle (0.45×13.5 RWLB; Weigao Medical Polymer
Co., Ltd., Weihai, China) was placed in the tail vein. Local CT
scanning (HD750 CT scanner; GE Healthcare, Little Chalfont, UK) was
performed first, followed by spectral CT scanning with a bolus
injection of iohexol contrast agent (2.5 ml/kg, injected at 0.2
ml/s; Yangtze River Pharmaceutical Group, Taizhou, China). Scanning
was performed in the axial mode, using the following parameters:
gantry rotation time, 0.5 sec; tube voltage, 80/140 kVp, fast
switching; tube current, 630 mAs; pitch, 1.375:1; detector
coverage, 20 mm; scan field of view (SFOV), small head; display
field of view (DFOV), 9 cm; reconstruction type, standard; matrix
size, 512; adaptive statistical iterative reconstruction (ASIR),
30%; thickness, 0.625 mm; time delay, 30 sec.
Analysis of spectral CT data
Three-dimensional (3D) multiplanar reconstruction
(MPR) images were generated using GSI general post-processing
software running on an AW4.6 workstation (GE Healthcare). The
maximal tumor length (including both the tumor and surrounding
regions of suspected invasion) was measured perpendicular to the
middle sagittal line, and the distance from the layer containing
the maximal tumor length to the front of the brain was also
determined. In the image layer (0.625 mm thick) containing the
maximal tumor length, circular regions of interest (ROIs; diameter,
0.5 mm) were positioned at the following regions: the center of the
solid tumor; a region of liquefactive necrosis; a peripheral tumor
region; and adjacent normal brain tissue. Every region positioned 3
ROIs, and the average monoenergetic CT values and iodine
concentrations were calculated for these regions. Two specialists
experienced in the analysis of spectral CT data recorded the tumor
diameter, distances from the ROIs in the peritumoral and adjacent
brain tissue regions to the tumor center, CT values and iodine
concentrations in a blinded fashion.
Histopathological analysis of tumor
samples
After the completion of CT scanning, each rat was
deeply anesthetized, fixed on a home-made surgical board and placed
on a dissection plate. The chest was opened, the abdominal aorta
was clamped, and the heart was exposed and isolated. A perfusion
needle was inserted into the left ventricular chamber and fixed in
place using small-animal-specific forceps, and an incision was made
in the right atrial appendage. The rat was first perfused with
sterile saline (100 ml, 4°C) until the blood had been cleared
(i.e., both lungs had turned white in color and the perfusate
emerging from the right atrial appendage had become clear). Then,
perfusion was continued with 4% paraformaldehyde (PFA; 100 ml,
4°C). The brain was collected by decapitation and fixed in PFA for
24 h.
Following fixation, the tumor section corresponding
to the spectral CT layer was collected. The sample was dehydrated,
embedded in paraffin, sectioned at 3–4 µm, and either stained with
hematoxylin and eosin (HE) or immunostained for Ki67 (a marker of
cell proliferation) using an anti-Ki67 primary antibody (1:180;
Biorbyt, Wuhan, China) and an EnVision system in accordance with
the manufacturer's instructions (Dako, Agilent Technologies, Santa
Clara, CA, USA). The samples were developed using
3,3-diaminobenzidine (DAB) and re-stained with hematoxylin.
Two pathologists independently analyzed the
pathological sections in a blinded manner. The tumor length was
measured, and the percentage of Ki67-positive cells in each
high-magnification field was calculated for regions corresponding
to the ROIs selected in the CT scan. The tumor length included the
tumor and surrounding area of infiltration (defined as the presence
of a few tumor cells within normal brain tissue).
Statistical analysis
SPSS17.0 (SPSS Inc., Chicago, IL, USA) was used for
the statistical analyses. The data are presented as the mean ±
standard deviation (SD). The monoenergetic CT values, iodine
concentration, effective atomic number and Ki67 expression
intensity in the various regions (tumor center, peritumoral region,
tumor-brain junction and adjacent brain tissue) were analyzed using
one-way analysis of variance (ANOVA) with a least significant
difference (LSD) post-hoc test. The correlation between each
spectral CT parameter and Ki67 expression was analyzed using
Pearson correlation analysis. P<0.05 was considered
statistically significant.
Results
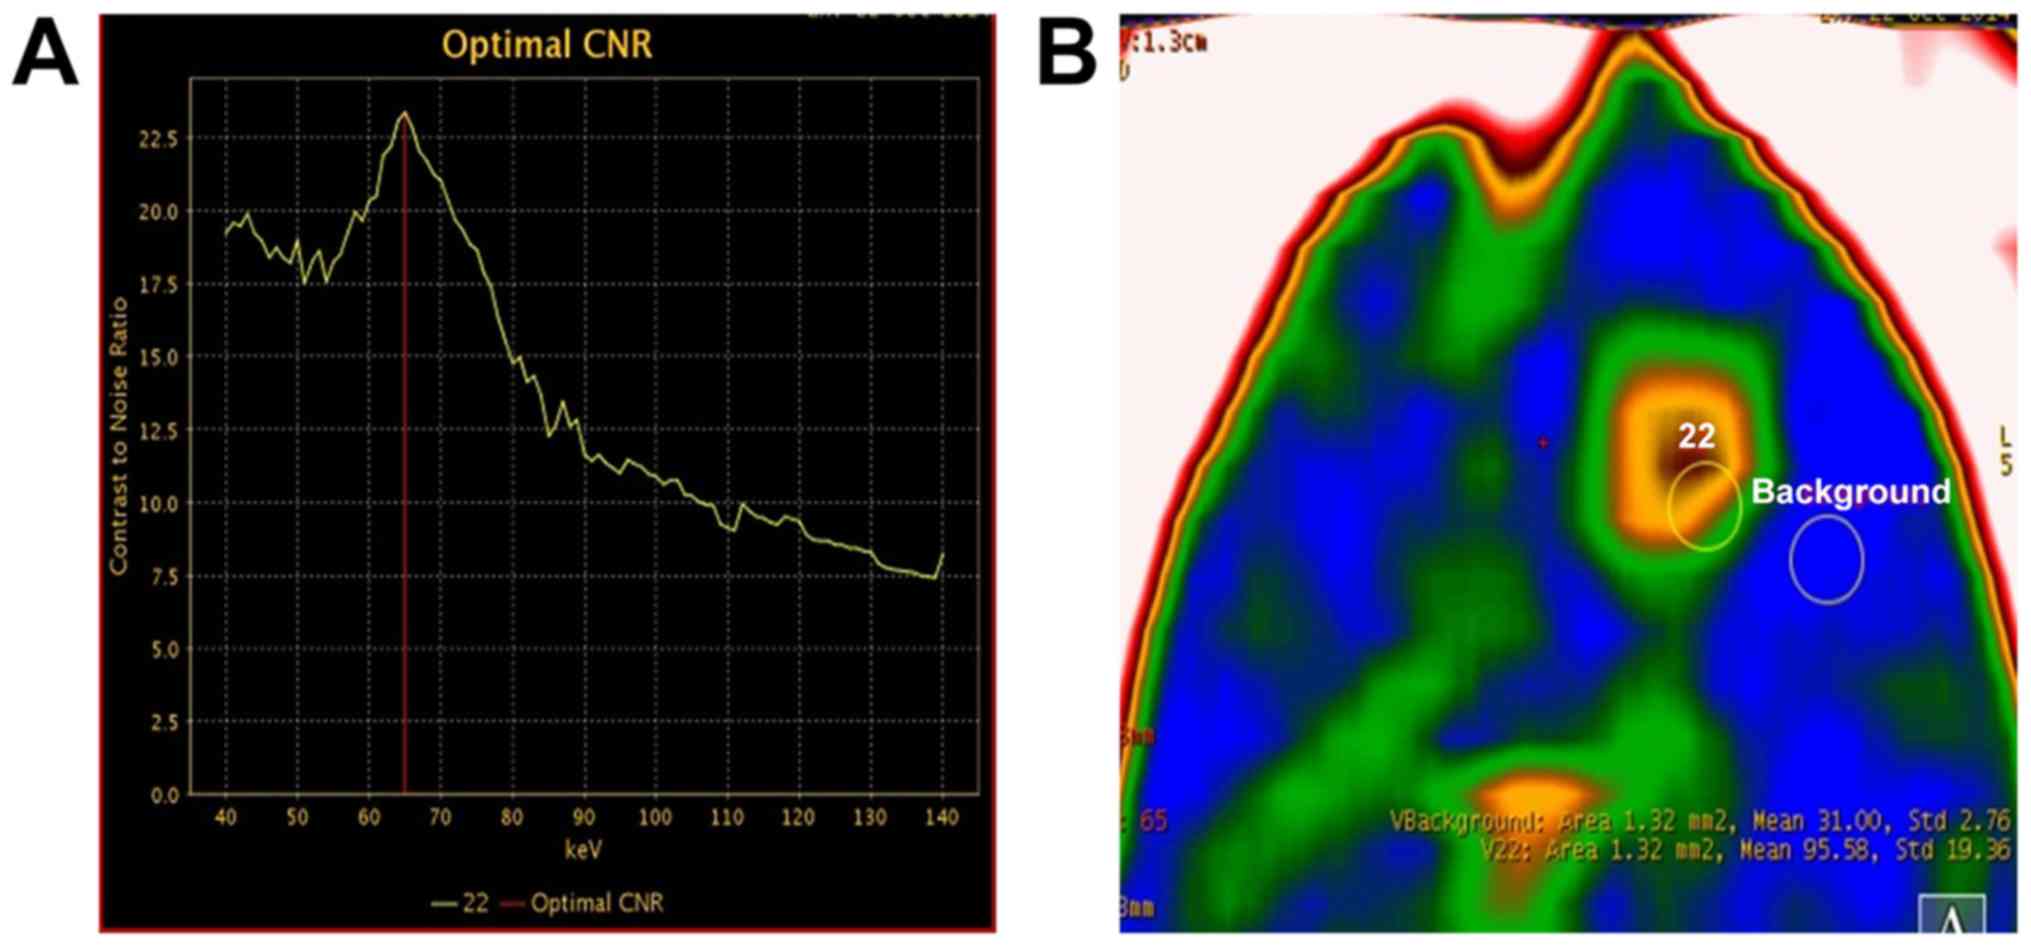
Optimizing the contrast-to-noise (CNR)
ratio for spectral CT imaging
In order to identify the monochromatic energy that
provided the optimal CNR, the CNR curve between tumor and adjacent
brain tissue was plotted for monochromatic energies ranging from 40
to 140 keV. The optimal CNR was achieved at 65 keV in 11 of the 13
tumor-bearing rats (Fig. 1). In the
remaining 2 rats, the optimal CNR was achieved at 60 keV and 70
keV, although good tissue contrast was also obtained at 65 keV in
both these animals. Therefore, 65 keV was selected for
monoenergetic imaging, 3D reconstruction and measurement of CT
values.
Analysis of spectral CT imaging
data
Of the 15 rats implanted with C6 glioma cells, 1
died 5 days after tumor seeding and 1 failed to develop a tumor
(based on contrast-enhanced spectral CT imaging); these 2 animals
were excluded from further analysis. A total of 13 rats showed
successful development of a tumor mass in the right basal ganglion
and were used for further study. The tumor diameter ranged from 1.4
to 3.8 mm.
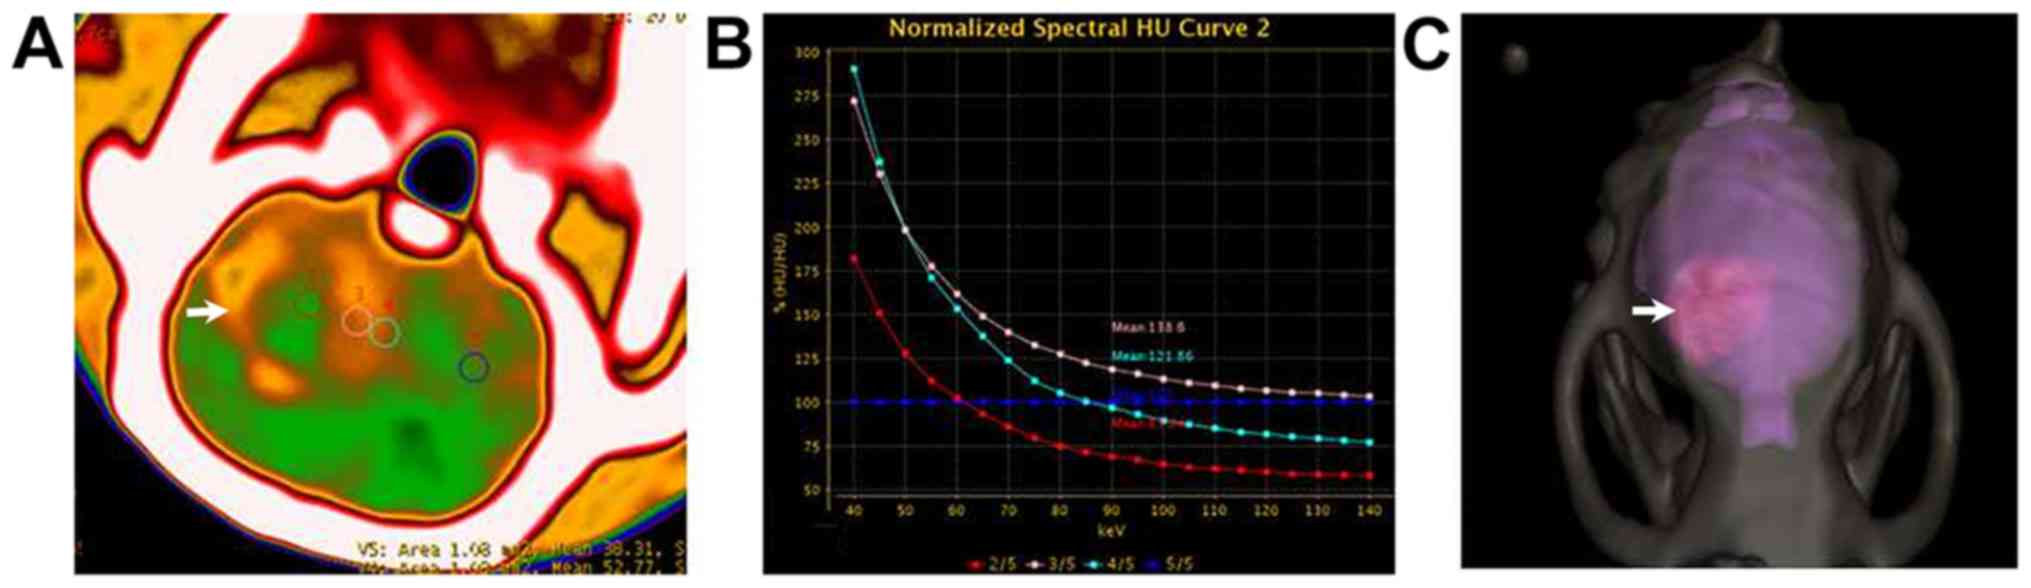
Five of the 13 tumor-bearing rats had tumors with a
diameter >2.5 mm. Enhanced spectral CT scanning of these 5 cases
showed that a large tumor body and a substantial central area of
liquefactive necrosis were evident in axial monoenergetic
pseudo-color images at 65 keV. The solid tumor showed strong
enhancement, and circular regions of uneven abnormal enhancement
were visible around the tumor (Fig.
2A). The normalized spectral curves for the necrotic region,
solid tumor, surrounding area of infiltration and normal brain
tissue differed notably (Fig. 2B).
The margins between the tumor, adjacent normal brain and skull were
clearly evident in 3D reconstructed images (Fig. 2C).
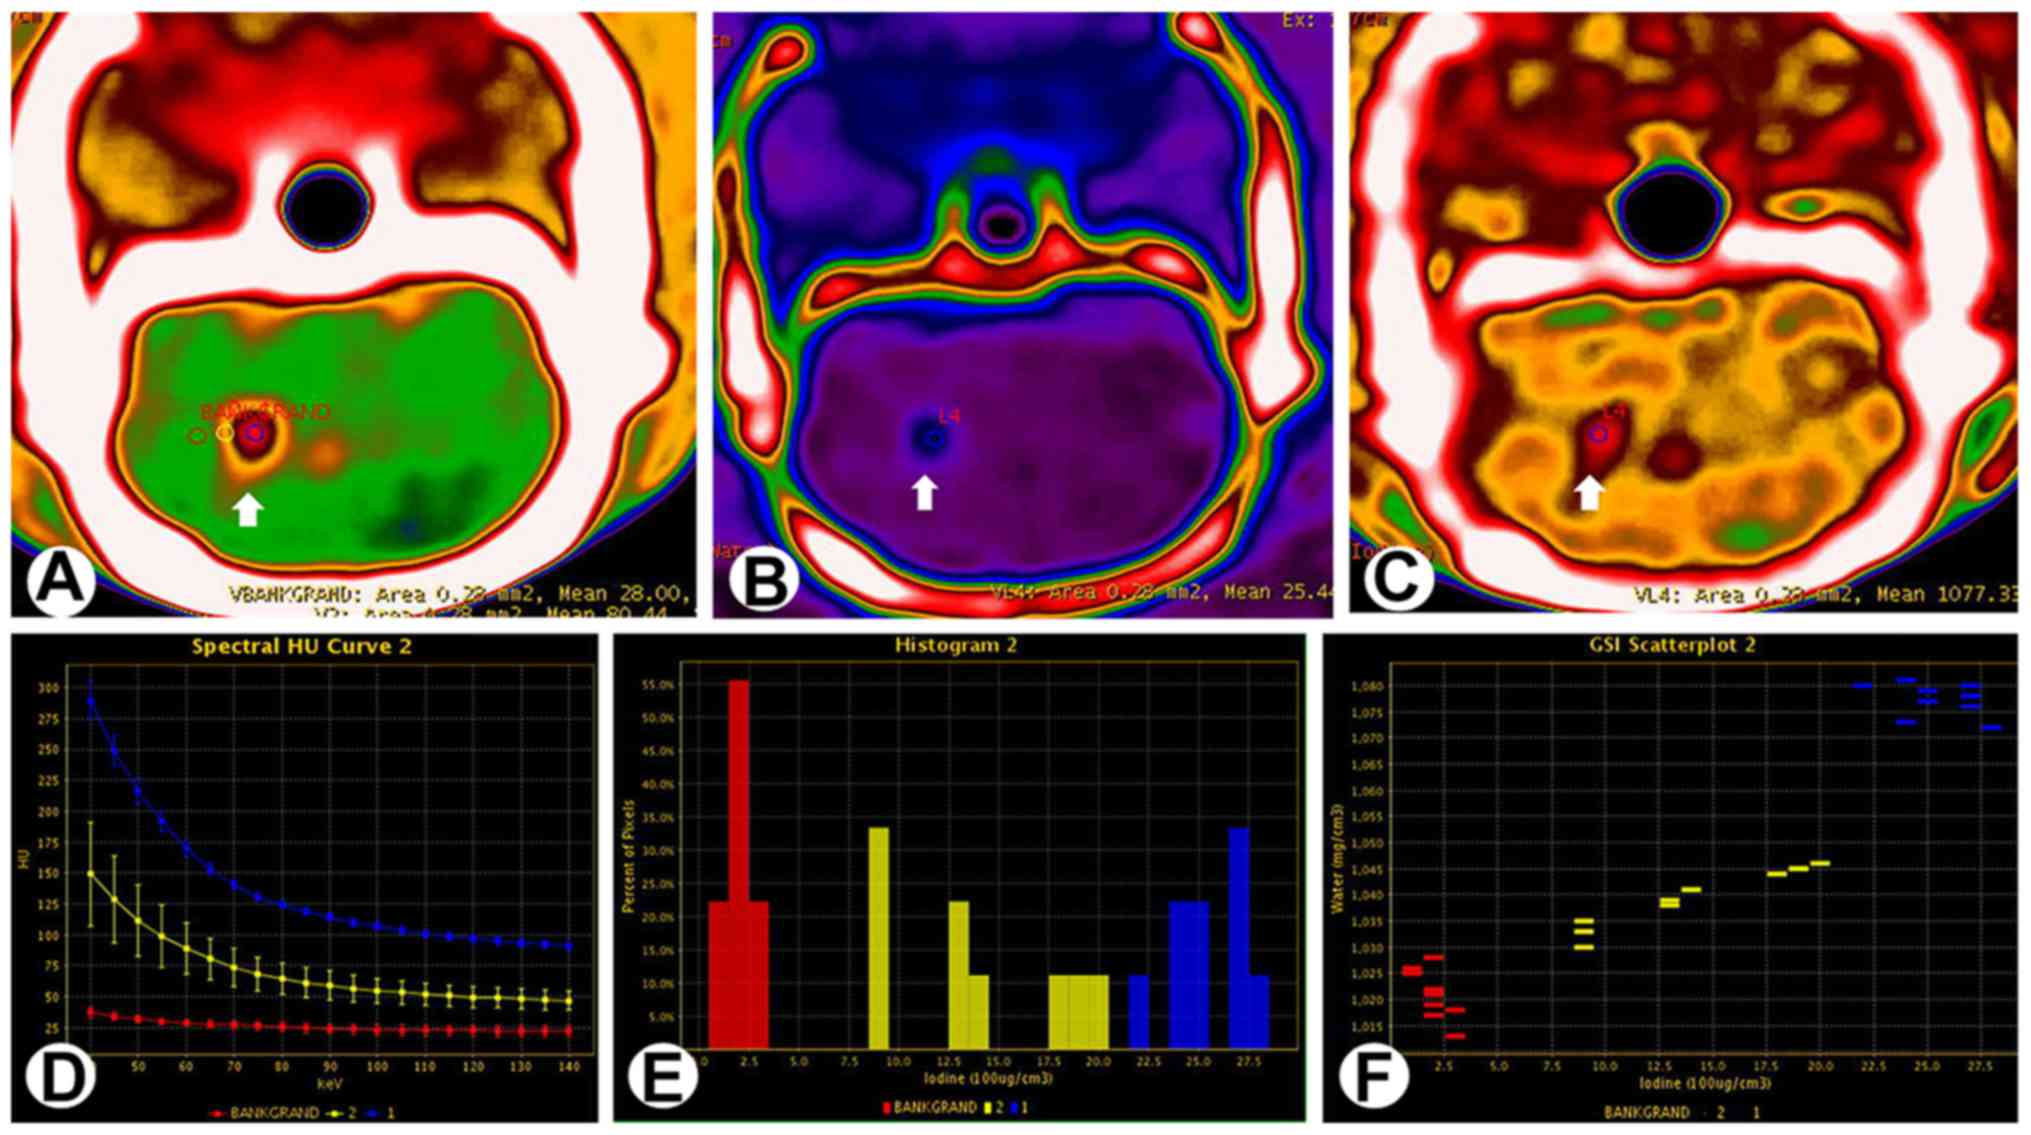
For gliomas with a diameter <2.5 mm, axial
monoenergetic pseudo-color images at 65 keV revealed that the
center of the tumor showed strong enhancement. The enhancement
decreased progressively from the tumor center to the peritumoral
region, where a circular area with slightly higher CT value could
be seen (Fig. 3A). The iodine-based
material-decomposition images revealed that the tumor periphery
contained circular regions with a slightly higher iodine
concentration (Fig. 3B and C). The
normalized spectral curves for solid tumor, peritumoral region and
normal brain tissue differed notably (Fig. 3D). The iodine concentrations also
differed between these regions (Fig.
3E), and a scatter plot of the iodine-water material
decomposition allowed a clear distinction to be made between the
tumor center, peritumoral region and adjacent brain tissue.
There were statistically significant differences
between solid tumor, peritumoral region and normal brain tissue in
the monoenergetic CT value, slope of the spectral curve and iodine
concentration at 65 keV (P<0.001). The values for all 3
parameters were highest in solid tumor and lowest in normal brain
tissue (Table I).
 | Table I.Comparison of spectral CT-derived
parameters (at 65 keV) and Ki67 expression (immunohistochemistry)
between normal brain tissue and various tumor regions in a rat C6
malignant glioma model. |
Table I.
Comparison of spectral CT-derived
parameters (at 65 keV) and Ki67 expression (immunohistochemistry)
between normal brain tissue and various tumor regions in a rat C6
malignant glioma model.
| Parameters | Solid tumor region
(n=13) | Peritumoralregions
(n=13) | Normal brain tissue
(n=13) | Liquefactive necrosis
(n=5) | F | P-value |
|---|
| CT value | 103.18±35.48 | 65.19±13.72 | 38.07±7.36 | 27.2±4.51 |
47.915 | <0.001 |
| HU curve slope | 1.81±1.09 | 0.8±0.43 | 0.11±0.27 | 0.24±0.46 |
21.726 | <0.001 |
| Iodine conc. | 16.05±9.75 | 6.76±3.66 | 1.06±2.35 | 2.41±3.86 |
15.174 | <0.001 |
| Ki67 (%) | 60.77±12.39 | 26.54±6.89 | 1.7±0.32 | 10.00±3.54 | 175.364 | <0.001 |
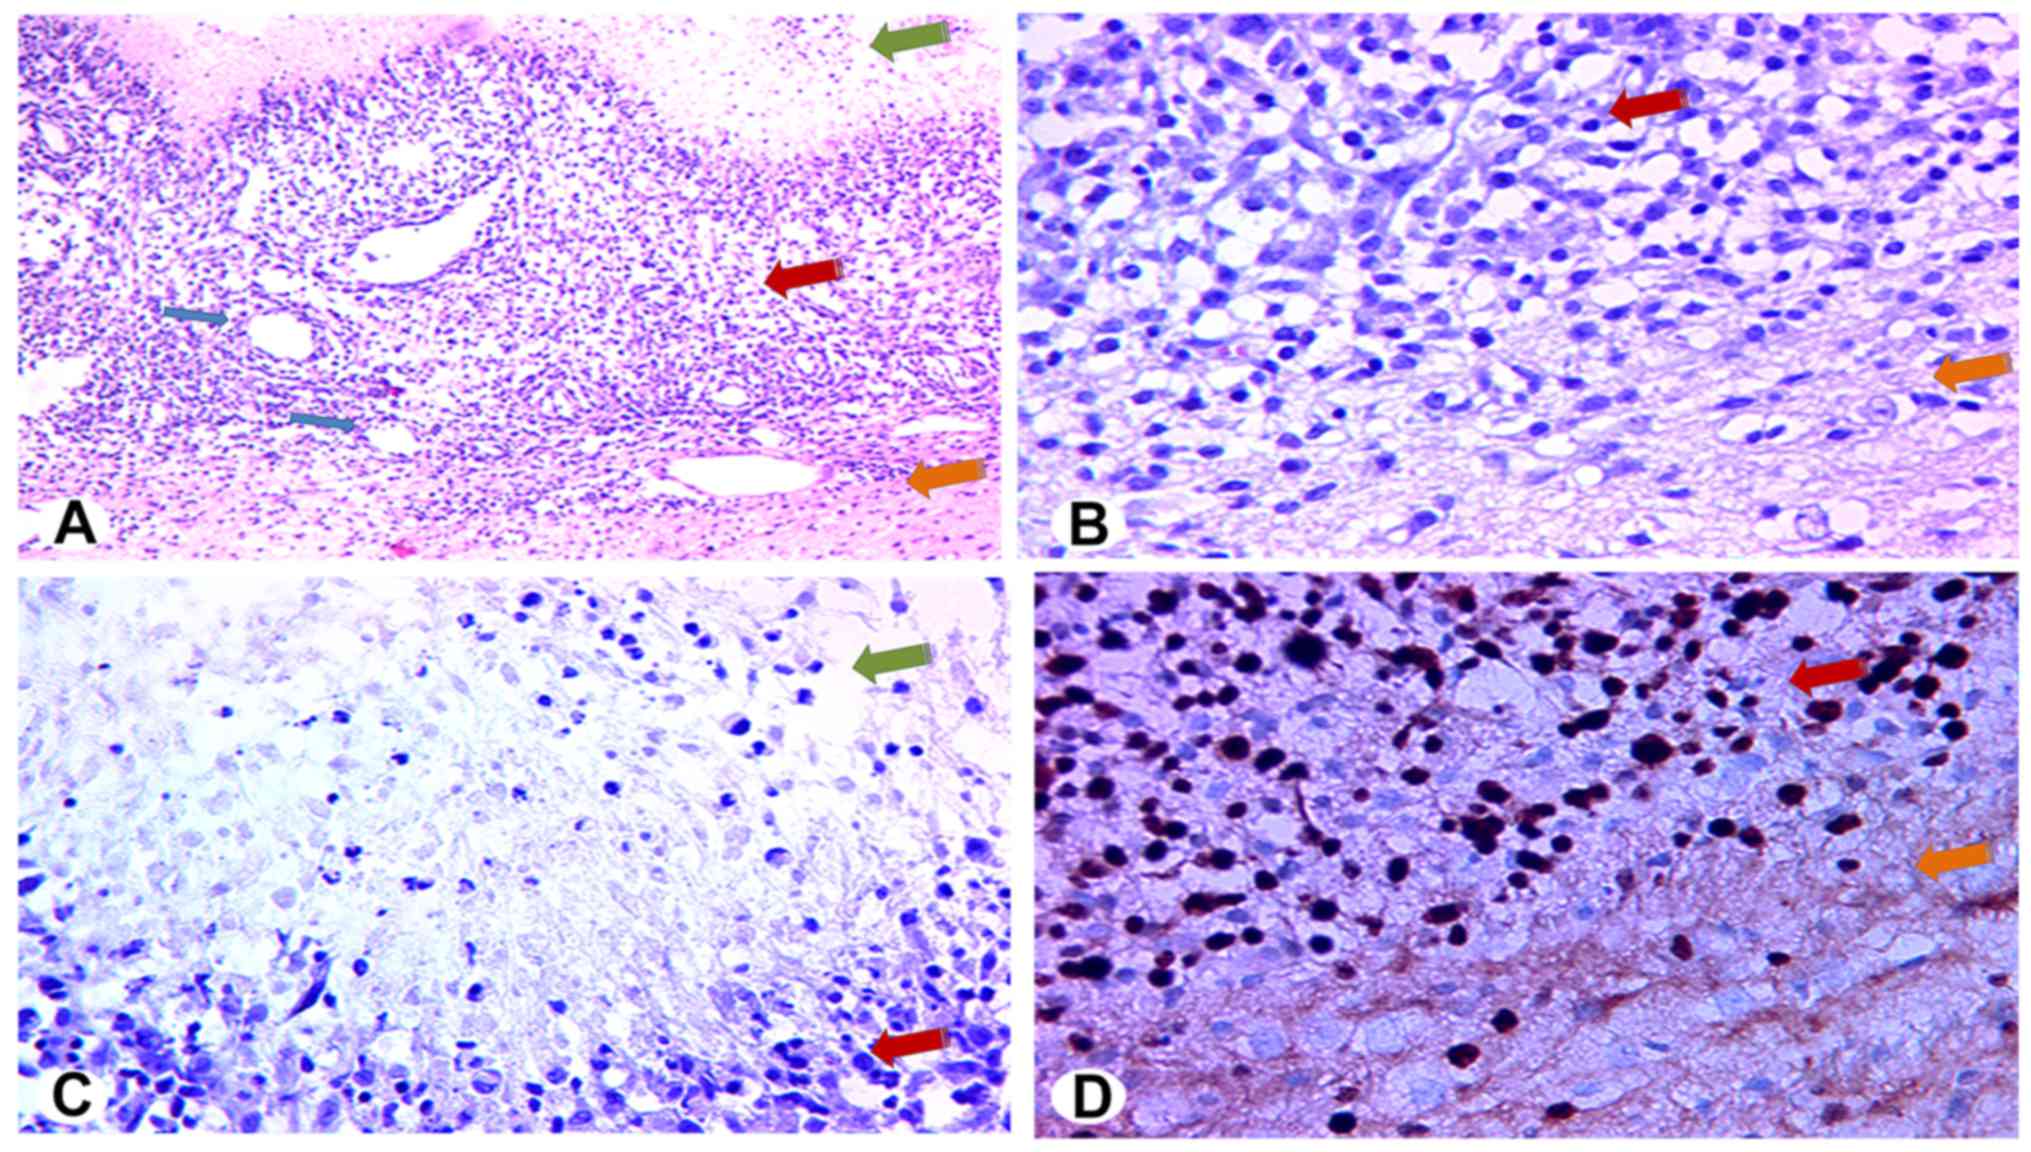
Histopathology
Gross inspection of all the pathological samples
(n=13) showed that the brain structures were intact. Both
the tumor and brain tissue were grayish in color, and the tumor was
observed to have a small volume and distinct margin. Under low
magnification, HE-stained sections of the solid region in the tumor
center revealed a dense arrangement of tumor cells with irregular
alignment (Fig. 4A) and substantial
neovascularization (blue arrows in Fig.
4A). Fewer tumor cells and less neovascularization were present
in the peritumoral region than in the central region (Fig. 4B). Under high magnification, the
tumor cells were observed to have large nuclei, commonly atypical
and mitotic. Immunostaining for Ki67 revealed that areas of
liquefactive necrosis contained only a small number of
Ki67-positive cells (i.e., nuclei stained deep brown; Fig. 4C). In contrast, the percentage of
Ki67-positive cells in solid tumor regions exceeded 60% (Fig. 4D, upper left). A small number of
Ki67-positive cells were also seen in peritumoral regions (Fig. 4D, lower right).
Correlation between spectral CT
imaging results and histopathology data
Tumor diameter on day 12 after seeding of C6 glioma
cells measured by spectral CT (2.39±0.66 mm) was not significantly
different to that measured from HE-stained histopathology specimens
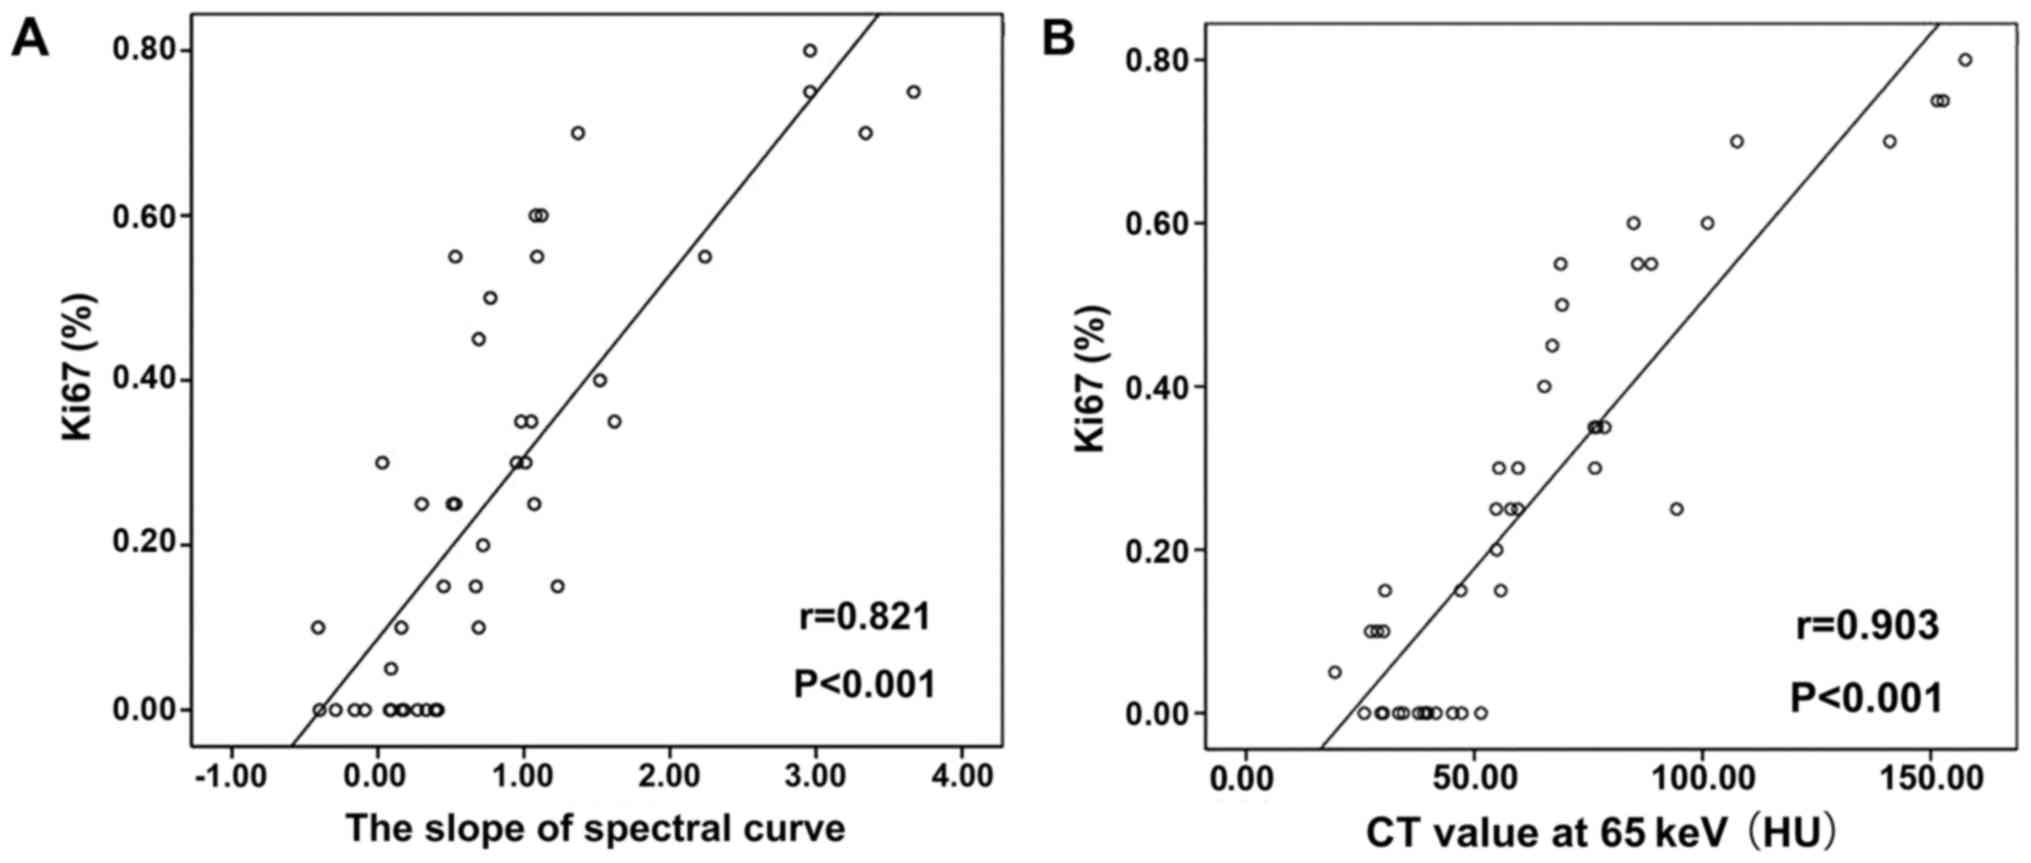
(2.41±0.71 mm; P=0.549). As shown in Table II, Ki67 expression correlated
strongly with the CT value at 65 keV (correlation coefficient
r=0.903, P<0.001, Fig. 5),
the slope of the spectral curve (r=0.821, P<0.001,
Fig. 5), and the iodine
concentration (r=0.813, P<0.001).
| Table II.Pearson correlation analysis of the
relation between Ki67 expression (immunohistochemistry) and
spectral CT-derived parameters measured in normal brain tissue and
various tumor regions (liquefactive necrosis, solid tumor,
peripheral tumor). |
Table II.
Pearson correlation analysis of the
relation between Ki67 expression (immunohistochemistry) and
spectral CT-derived parameters measured in normal brain tissue and
various tumor regions (liquefactive necrosis, solid tumor,
peripheral tumor).
| Parameters | Mean | Standard
deviation | Correlation
coefficient | P-value |
|---|
| Ki67 expression |
0.2693 |
0.25614 |
|
|
| CT value at 65
keV | 64.0839 | 35.29587 | 0.903 | <0.001 |
| Slope of the spectral
curve |
0.8264 |
0.95265 | 0.821 | <0.001 |
| Iodine conc. (100
µg/cm3) |
7.3286 | 8.4248 | 0.813 | <0.001 |
Discussion
To the best of our knowledge, this is the first
study to investigate the utility of spectral CT scanning for
evaluating malignant glioma. The main findings of the present study
were that spectral CT imaging was capable of identifying a C6
glioma in rat brain, delineating the tumor margins, and
differentiating between normal brain tissue and various tumor
regions (solid tumor, area of liquefactive necrosis and peritumoral
region). Furthermore, 3 parameters measured using spectral CT
scanning (CT value, slope of the spectral curve and iodine
concentration) correlated with Ki67 expression (a marker of cell
proliferation) determined from histopathology studies. These
results suggest that spectral CT scanning could potentially be used
to improve the evaluation of glioblastoma and provide useful
information regarding the extent and grade of the tumor.
Routine CT scans measure the decay of mixed-energy
X-rays that penetrate the tissues to be tested, but the limitations
of polychromatic X-rays, including beam-hardening effects, can
sometimes make it difficult to distinguish a lesion from
surrounding normal tissue (11).
Spectral CT allows the generation of monochromatic spectral images
with energies ranging from 40 to 140 keV and permits
material-specific analysis that provides multi-parameter
quantitative and qualitative data. An important advantage of
monoenergetic spectral CT is that it effectively removes
beam-hardening artifacts and therefore more accurately reflects
changes in tissue density (8). It is
thought that spectral CT is more sensitive at distinguishing
structural differences within tissues and thus can facilitate the
diagnosis of a tumor by providing richer imaging information
(8). However, no previous
investigations have assessed whether the monoenergetic imaging and
material-specific analysis provided by spectral CT can accurately
reflect compositional changes within a brain glioma and whether the
pathological basis of these changes is related to tumor cell
proliferation, invasion or apoptosis. Therefore, the present
preclinical study was carried out to explore whether monoenergetic
spectral CT imaging and material-specific quantitative analysis
could be used to detect malignant glioma cell infiltration and
apoptosis. The rat C6 glioma was chosen for use in the animal model
because it is similar to human glioblastoma in terms of growth and
biological behavior and is widely used in imaging and
interventional studies of malignant brain gliomas (14,15).
X-ray decay possesses distinct features at different
energy levels. Low-energy X-rays have low penetrative ability and
generate images with good contrast but high noise, while
high-energy X-rays have high penetrative ability and generate
images with low beam-hardening artifacts but low tissue contrast.
Therefore, the energy level needs to be selected according to
requirements (11,16). Patel and colleagues (17) reported that low-energy images
increased the contrast between a pancreatic lesion and surrounding
tissue and concluded that 50–52 keV was optimal for the display and
diagnosis of pancreatic cancer. Tang and coworkers (18) compared abdominal images obtained with
spectral CT and regular CT and concluded that monoenergetic
spectral CT was better at delineating the gastrocolic ligament; the
optimal CNR was at 50–70 keV. Hu et al (12) constructed a CNR curve for
monochromatic energies ranging from 40 to 140 keV and determined
that the optimal CNR for imaging pancreatic carcinoma xenografts
was obtained at 70 keV. In our study, we used a similar approach to
that of Hu and colleagues and determined that the optimal CNR for
distinguishing glioma from normal brain tissue was obtained at 65
keV. Therefore, 65 keV was selected as the energy level for
subsequent spectral CT imaging studies.
At 65 keV, the monoenergetic CT images of C6 glioma
obtained in our study demonstrated stratification from the center
to the periphery of the tumor. Spectral CT showed a low-density
area of liquefactive necrosis within the tumor in all 5 cases where
the tumor diameter was >2.5 mm. In the 8 cases with a tumor
diameter <2.5 mm, a high-density, evenly distributed shadow was
observed in the tumor center. In all cases, a circular shadow of
slightly higher density could be seen in the peritumoral region.
The tissue density in contrast-enhanced CT is largely dependent on
the local concentration of the contrast agent and on tissue cell
density (19). Since contrast agents
cannot cross the intact blood-brain barrier, we speculate that
tumor cell infiltration into the peritumoral area impairs part of
the blood-brain barrier and/or induces abnormal neovascularization.
The stratification observed from the center to the periphery of the
tumor in CT images may have resulted from differences between the
various regions in cell density, the degree of neovascularization
and/or the extent of blood-brain barrier impairment.
Histopathological analysis (HE staining) revealed a sparse
distribution of cells in areas of liquefactive necrosis but a dense
distribution of cells with rich neovascularization in solid tumor
regions. A small amount of tumor cell infiltration and abnormal
neovascularization were evident in the peritumoral region,
suggesting that variations in the monoenergetic CT values were
associated with tumor cell density and microenvironment.
Furthermore, the mean tumor size (including peritumoral region)
measured with spectral CT imaging was consistent with that measured
using histopathological techniques. Thus, monoenergetic CT images
at 65 keV were able to accurately detect the extent of tumor
infiltration.
Spectral CT demonstrated low-density liquefactive
necrosis in all tumors with a diameter <2.5 mm. Histopathology
with HE staining revealed that necrotic tissue debris and fluid
were the major components of these areas, while the percentage of
Ki67-positive cells was <10%. Moreover, lower CT values on
spectral CT corresponded with increased severity of liquefactive
necrosis. Liquefactive necrosis was not observed when the tumor
size was <2.5 mm, and histopathology indicated that these tumors
had been growing rapidly. It is likely that liquefactive necrosis
arises when a C6 glioma reaches a certain size that results in an
insufficient blood supply to the central portions of the tumor.
Importantly, the presence of liquefactive necrosis could be
sensitively detected by spectral CT.
We utilized spectral CT analytical software to
measure the monoenergetic CT values at 40–140 keV in liquefactive,
solid and peritumoral regions of the tumor as well as in normal
brain tissue, and the slopes of the spectral curves were
calculated. There were significant differences between regions in
the slope of the spectral curve and the mean monoenergetic CT
value. The values for both parameters were highest in solid tumor,
lowest in normal brain tissue, and intermediate in the peritumoral
region. The absorption of X-rays at different energy levels varies
for materials of differing compositions, allowing spectral CT to
detect changes in local tissue structures and their
microenvironment and analyze tumor cell proliferation and invasion
(20,21). In our study, there was a strong and
significant correlation between the slope of the spectral curve and
Ki67 expression detected using immunohistochemistry. Ki67
expression is a widely accepted method for measuring the
proliferative activity of malignant glioma cells (22): the higher the percentage of
Ki67-positive cells in the tumor, the higher the mitosis rate and
the greater the invasiveness of the tumor. Therefore, we
hypothesize that the slope of the spectral curve could be used to
indirectly reflect the proliferation and necrosis of malignant
glioma as well as accurately measure the extent of tumor
infiltration into surrounding tissues.
Based on the material decomposition images, we
plotted the contrast agent distribution by detecting differences in
iodine concentration. This approach can demonstrate local changes
in tissue blood perfusion, which can facilitate the differential
diagnosis of diseases with similar imaging features (23), including lung cancer (24). Aoki et al (24) analyzed the iodine concentrations in
57 cases of lung cancer and found that iodine concentration was
tightly associated with CT perfusion parameters (blood flow, volume
and blood vessel permeability) and could replace CT perfusion in
the evaluation of local blood perfusion. Iodine concentration in
contrast-enhanced CT was determined by the local concentration of
contrast agent and was not affected by the gas composition of the
tumor.
The iodine concentration in our study differed
significantly between the various tumor regions, and associated
with ki67 expression (P<0.001). Solid tumor regions had more
intensive tumor cells, obvious karyokinesis, and significantly
higher the iodine concentration and ki67 expression than other
regions. Therefore, we believe that areas containing actively
proliferating tumor cells have increased local blood flow and
greater vascular permeability. Comprehensive analysis of the
monoenergetic CT value, slope of the spectral curve and iodine
concentration could be an effective method for detecting tumor cell
proliferative activity, invasion and infiltration.
This study has certain limitations. First, the
sample size was relatively small (n=13). Second, the lesion
size was small; although a small ROI was selected with a diameter
of 0.5 mm, there still may have been a degree of variation due to
the volume effect. Third, spectral CT analysis was only performed
on rat C6 gliomas, hence the generalizability of our observations
to malignant gliomas in other species, including human patients,
remains to be established. Fourth, direct comparisons between
spectral CT and other imaging methods were not made. Additional
preclinical and clinical studies with larger sample sizes are
merited to further validate our findings.
In a rat model of malignant glioma, spectral CT
multi-parameter analysis can distinguish between solid tumor,
liquefactive necrosis, peritumoral regions and normal brain tissue,
and effectively detect the infiltration of tumor into surrounding
brain tissues. In particular, the monoenergetic CT value, slope of
the spectral curve and iodine concentration all correlated with the
percentage of Ki67-positive cells, which reflects the proliferative
activity of tumor cells. Quantitative spectral CT analysis can
potentially provide important imaging information for the dynamic
monitoring of microstructural changes within malignant gliomas.
Acknowledgements
We gratefully acknowledge assistance for the animal
experiments from The Institute of Modern Physics (IMP) of the
Chinese Academy of Sciences, and research support from GE
Healthcare.
References
|
1
|
Ostrom QT, Bauchet L, Davis FG, Deltour I,
Fisher JL, Langer CE, Pekmezci M, Schwartzbaum JA, Turner MC, Walsh
KM, et al: The epidemiology of glioma in adults: A ‘state of the
science’ review. Neuro Oncol. 16:896–913. 2014. View Article : Google Scholar : PubMed/NCBI
|
|
2
|
Louis DN, Ohgaki H, Wiestler OD, Cavenee
WK, Burger PC, Jouvet A, Scheithauer BW and Kleihues P: The 2007
WHO classification of tumours of the central nervous system. Acta
Neuropathol. 114:97–109. 2007. View Article : Google Scholar : PubMed/NCBI
|
|
3
|
Hayes J, Thygesen H, Droop A, Hughes TA,
Westhead D, Lawler SE, Wurdak H and Short SC: Prognostic microRNAs
in high-grade glioma reveal a link to oligodendrocyte precursor
differentiation. Oncoscience. 2:252–262. 2014. View Article : Google Scholar : PubMed/NCBI
|
|
4
|
Wen PY, Macdonald DR, Reardon DA,
Cloughesy TF, Sorensen AG, Galanis E, Degroot J, Wick W, Gilbert
MR, Lassman AB, et al: Updated response assessment criteria for
high-grade gliomas: Response assessment in neuro-oncology working
group. J Clin Oncol. 28:1963–1972. 2010. View Article : Google Scholar : PubMed/NCBI
|
|
5
|
Young RM, Jamshidi A, Davis G and Sherman
JH: Current trends in the surgical management and treatment of
adult glioblastoma. Ann Transl Med. 3:1212015.PubMed/NCBI
|
|
6
|
Stupp R, Mason WP, Van den Bent MJ, Weller
M, Fisher B, Taphoorn MJ, Belanger K, Brandes AA, Marosi C, Bogdahn
U, et al: Radiotherapy plus concomitant and adjuvant temozolomide
for glioblastoma. N Engl J Med. 352:987–996. 2005. View Article : Google Scholar : PubMed/NCBI
|
|
7
|
Kalpathy-Cramer J, Gerstner ER, Emblem KE,
Andronesi OC and Rosen B: Advanced magnetic resonance imaging of
the physical processes in human glioblastoma. Cancer Res.
74:4622–4637. 2014. View Article : Google Scholar : PubMed/NCBI
|
|
8
|
McCollough CH, Leng S, Yu L and Fletcher
JG: Dual- and multi-energy CT: Principles, technical approaches,
and clinical applications. Radiology. 276:637–653. 2015. View Article : Google Scholar : PubMed/NCBI
|
|
9
|
Ogata T, Ueguchi T, Yagi M, Yamada S,
Tanaka C, Ogihara R, Isohashi F, Yoshioka Y, Tomiyama N, Ogawa K
and Koizumi M: Feasibility and accuracy of relative electron
density determined by virtual monochromatic CT value subtraction at
two different energies using the gemstone spectral imaging. Radiat
Oncol. 8:832013. View Article : Google Scholar : PubMed/NCBI
|
|
10
|
Graser A, Johnson TR, Chandarana H and
Macari M: Dual energy CT: Preliminary observations and potential
clinical applications in the abdomen. Eur Radiol. 19:13–23. 2009.
View Article : Google Scholar : PubMed/NCBI
|
|
11
|
Pomerantz SR, Kamalian S, Zhang D, Gupta
R, Rapalino O, Sahani DV and Lev MH: Virtual monochromatic
reconstruction of dual-energy unenhanced head CT at 65–75 keV
maximizes image quality compared with conventional polychromatic
CT. Radiology. 266:318–325. 2013. View Article : Google Scholar : PubMed/NCBI
|
|
12
|
Hu S, Huang W, Chen Y, Song Q, Lin X, Wang
Z and Chen K: Spectral CT evaluation of interstitial brachytherapy
in pancreatic carcinoma xenografts: Preliminary animal experience.
Eur Radiol. 24:2167–2173. 2014. View Article : Google Scholar : PubMed/NCBI
|
|
13
|
Wang Y, Gao X, Lu A, Zhou Z, Li B, Sun X
and Zhu B: Residual aneurysm after metal coils treatment detected
by spectral CT. Quant Imaging Med Surg. 2:137–138. 2012.PubMed/NCBI
|
|
14
|
Barth RF and Kaur B: Rat brain tumor
models in experimental neuro-oncology: The C6, 9L, T9, RG2, F98,
BT4C, RT-2 and CNS-1 gliomas. J Neurooncol. 94:299–312. 2009.
View Article : Google Scholar : PubMed/NCBI
|
|
15
|
Liao J, Xia R, Liu T, Feng H, Ai H, Song B
and Gao F: In vivo dynamic monitoring of the biological behavior of
labeled C6 glioma by MRI. Mol Med Rep. 7:1397–1402. 2013.PubMed/NCBI
|
|
16
|
Yamada Y, Jinzaki M, Tanami Y, Abe T and
Kuribayashi S: Virtual monochromatic spectral imaging for the
evaluation of hypovascular hepatic metastases: The optimal
monochromatic level with fast kilovoltage switching dual-energy
computed tomography. Invest Radiol. 47:292–298. 2012. View Article : Google Scholar : PubMed/NCBI
|
|
17
|
Patel BN, Thomas JV, Lockhart ME, Berland
LL and Morgan DE: Single-source dual-energy spectral multidetector
CT of pancreatic adenocarcinoma: Optimization of energy level
viewing significantly increases lesion contrast. Clin Radiol.
68:148–154. 2013. View Article : Google Scholar : PubMed/NCBI
|
|
18
|
Tang L, Zhang XP, Sun YS, Li YL, Li XT,
Cui Y and Gao SY: Spectral CT in the demonstration of the
gastrocolic ligament: A comparison study. Surg Radiol Anat.
35:539–545. 2013. View Article : Google Scholar : PubMed/NCBI
|
|
19
|
Lusic H and Grinstaff MW: X-ray-computed
tomography contrast agents. Chem Rev. 113:1641–1666. 2013.
View Article : Google Scholar : PubMed/NCBI
|
|
20
|
Li A, Liang H, Li W, Wang Z, Pang T, Li J,
Shi H and Zhang C: Spectral CT imaging of laryngeal and
hypopharyngeal squamous cell carcinoma: Evaluation of image quality
and status of lymph nodes. PLoS One. 8:e834922013. View Article : Google Scholar : PubMed/NCBI
|
|
21
|
Wu LM, Li YL, Yin YH, Hou GQ, Zhu R, Hua
XL, Xu JR and Chen ZA: Usefulness of dual-energy computed
tomography imaging in the differential diagnosis of sellar
meningiomas and pituitary adenomas: Preliminary report. PLoS One.
9:e906582014. View Article : Google Scholar : PubMed/NCBI
|
|
22
|
Sun H, Guo D, Su Y, Yu D, Wang Q, Wang T,
Zhou Q, Ran X and Zou Z: Hyperplasia of pericytes is one of the
main characteristics of microvascular architecture in malignant
glioma. PLoS One. 9:e1142462014. View Article : Google Scholar : PubMed/NCBI
|
|
23
|
Yu Y, He N, Sun K, Lin X, Yan F and Chen
K: Differentiating hepatocellular carcinoma from angiomyolipoma of
the liver with CT spectral imaging: A preliminary study. Clin
Radiol. 68:e491–e497. 2013. View Article : Google Scholar : PubMed/NCBI
|
|
24
|
Aoki M, Takai Y, Narita Y, Hirose K, Sato
M, Akimoto H, Kawaguchi H, Hatayama Y, Miura H and Ono S:
Correlation between tumor size and blood volume in lung tumors: A
prospective study on dual-energy gemstone spectral CT imaging. J
Radiat Res. 55:917–923. 2014. View Article : Google Scholar : PubMed/NCBI
|