Introduction
Several epidemiological studies show that all-cause
mortality as well as the incidences of cardiovascular diseases,
diabetes, liver cirrhosis and stroke are lower in people reporting
moderate alcohol consumption than both non-drinkers and heavy
drinkers; this suggests a J-shaped or U-shaped effect of alcohol
consumption on human health (1–3). Recent
epidemiological evidence has further suggested low or moderate
intake of alcohol decreases the risk of brain diseases such as
dementia and cognitive impairment (4,5). In
epidemiological studies, however, it is difficult to completely
adjust for confounding factors (e.g., ethnicity, beverage type,
drinking style, socioeconomic status, lifestyle, physical activity
and personality type) (6,7). Thus, epidemiological studies have
limited power to conclude that moderate alcohol intake itself
directly improves human health and exerts a biological effect.
Animal experiments are useful for examining the direct effects of
pure alcohol. However, experimental animal models have focused on
high toxicological doses with forced and excessive ingestion (e.g.,
intragastric ethanol infusion and liquid diets) (8,9).
Meanwhile, animal studies involving low alcohol intake are
limited.
Research with experimental rodent models and
cultured cardiac myocytes, or endothelial cells indicates that
moderate alcohol exposure can promote anti-inflammatory processes
involving adenosine receptors, protein kinase C (PKC), nitric oxide
synthase, heat shock proteins, and others which could underlie
cardioprotection (10). Decreased
risks of cognitive loss or dementia in moderate, non-binge
consumers of alcohol (wine, beer, liquor) have been reported,
whereas increased risk has been reported only in a few studies
(11). Thus, moderate alcohol
exposure appears to trigger analogous mild stress-associated,
anti-inflammatory mechanisms in the heart, vasculature, and brain
that tend to promote cellular survival pathways (10). One study indicated that ethanol
intake levels achieved by alcohol-preferring P rats as a result of
chronic voluntary exposure may have favorable rather than
detrimental effects on lipid profiles in this genetic line,
consistent with data supporting beneficial cardioprotective and
neuroprotective effects of moderate ethanol consumption (12). Our recent study has suggested that
intake of 1% ethanol in drinking water improved liver function in
rats maintained on a high-fat diet, but that of 2% ethanol did so
to a lesser extent (13). In the
present study, we examined the effect of low ethanol intake on
senescence in senescence-accelerated mice (SAM). SAM are widely
used as an animal genetic model for studying aging, and a
techniques for evaluation of senescence degree are well established
(14). The system was designed to
represent changes in both behavior and appearance of these mice,
which display the clinical manifestations and gross lesions
associated with the aging process. The defined grading score system
is one of the significant advantages in aging studies using SAM.
The Senescence-Accelerated Mouse Prone 8 (SAMP8) line has further
advantages, because some behavioral traits and histopathology
resemble human dementia as well as its recapitulating rapid
physiological senescence (15,16).
Thus, the present study was conducted to examine the effects of low
dose of ethanol on SAMP8 mice.
Materials and methods
Animal experiment
Eight-week-old male SAMP8 mice (Japan SLC, Shizuoka,
Japan) were maintained under controlled conditions (ambient
temperature, 22°C ± 2°C, 12-h light/dark cycle, lights on from
12:00 a.m. to 12:00 p.m., lights off from 12:00 p.m. to 12:00
a.m.). The animals were housed individually in plastic cages
(125×200×110 mm) with free access to food (MF, Oriental Yeast,
Tokyo, Japan) and water. This study was approved by the Animal Care
Committee of the National Research Institute of Brewing, Japan
(Ethical approval No. 25-1). After a 3-week acclimation period, the
mice received deionized drinking water with 0, 1% (v/v) or 2% (v/v)
ethanol (n=8 mice per group) for 15 weeks. The ethanol-consuming
groups had free access to only 1 or 2% ethanol without other water
being available. Licking counts of drinking water were evaluated by
drinking sensors (DS-1, Shinfactory, Fukuoka, Japan) for 21 h
(11:00 a.m. to 08:00 a.m.) in 20-week-old mice. Food intake was
quantified using measuring the difference between the preweighed
pellet in food cups and the weight of remaining pellet and spill at
the end of 24-h period. Fluid intake was also determined by
measuring the difference between preweighed water bottle and the
weight of remaining bottle at the end of 24-h period. At the
termination of experimental procedure, mice were sacrificed by
decapitation under diethylether anesthesia (between 01:00 p.m. and
03:00 p.m.) after removal of food and drinking water (08:00
a.m.).
Grading of senescence
The degree of senescence was evaluated by a grading
system (14) comprising the
following 11 items in four categories: Behaviors (reactivity and
passivity), skin and hair (glossiness, coarseness and hair loss),
eyes (ulcer, periophthalmic lesions, cataract, corneal ulcer and
corneal opacity) and skeleton (lordokyphosis). The grading score
was calculated by summing the scores of all 11 items from 0 to
4.
Serum biochemical analysis
The activities of serum alanine aminotransferase
(ALT, EC 1.1.1.27) and aspartate aminotransferase (AST, EC 2.6.1.1)
as well as levels of serum glucose, triglyceride, albumin, and
total cholesterol were measured calorimetrically by the DRICHEM
commercial assay system (Fujifilm, Tokyo, Japan). Serum insulin
(Mercodia, Uppsala, Sweden), adiponectin and IGF-1 (both from
R&D Systems, Minneapolis, MN, USA) were measured by commercial
ELISA kits. Serum IL-1β, IL-12, and TNF-α were determined by the
Bio-Plex cytokine assay kit in combination with the Bio-Plex
Manager software (Bio-Rad, Hercules, CA, USA).
Open-field test
Open-field test was performed using a two-level
infrared beam apparatus (Scanet MV-40; Melquest, Toyama, Japan), an
automatic analysis system for measuring murine locomotor activity
(17). Testing was performed between
01:00 p.m. and 03:00 p.m. Mice were placed into the center of the
open field (44×44×30 cm) and left to explore for 10 min. Food and
water were available ad libitum other than during 10-min
trials. Rearing counts were evaluated as vertical activity. The
field was cleaned after each session.
Spontaneous locomotor activity
Spontaneous locomotor activity was automatically
measured by a laboratory animal movement analyzing system
(ACTIMO-100; Shinfactory, Fukuoka, Japan). Locomotor activity was
measured as ambulatory counts from a record of consecutive adjacent
infrared beam breaks. Mice were housed individually in plastic
cages, and food and water were available ad libitum. Mice
were acclimatized to the cages for 1 h before recordings commenced
and then monitored for 21 h (dark period for 11 h; 01:00 p.m. to
12:00 a.m. and light period for 10 h; 12:00 a.m. to 10:00
a.m.).
In the above behavior tests, the different treatment
groups were tested in counterbalanced order with a single blinded
method.
RNA extraction
Total RNA was extracted from the whole brain by
using QIAzol Lysis Reagent (Qiagen, Hilden, Germany) according to
the manufacturer's instructions. Isolated RNA was purified using
the RNeasy® Lipid Tissue Mini kit (Qiagen).
DNA microarray analysis
Pooled RNAs were subjected to cRNA synthesis for a
DNA microarray analysis. Cyanine-3 (Cy3) labeled cRNA was prepared
from 100 ng RNA using the One-Color Low Input Quick Amp labeling
kit (Agilent Technologies, Santa Clara, CA, USA) according to the
manufacturer's instructions. All procedures of hybridization, slide
washing, and scanning were carried out according to the
manufacturer's instructions [Agilent Whole Mouse Genome Microarray
kit ver2.0 (G4846A); Agilent Technologies]. The data were analyzed
using GeneSpring software version 12.6.1 (Agilent
Technologies).
Real-time PCR
cDNA was synthesized from total RNA using the
Revertrace RT-PCR kit (Toyobo Co., Ltd., Osaka, Japan). Real-time
PCR was performed on an Opticon 2 system (Bio-Rad) using SYBR qPCR
mix (Toyobo Co., Ltd.) employing primers (forward/reverse) as shown
in Table I. Expression of the target
genes was normalized to that of GAPDH as an endogenous
control gene.
 | Table I.Primer sequences used for real-time
PCR. |
Table I.
Primer sequences used for real-time
PCR.
| Gene | Forward
(5′-3′) | Reverse
(5′-3′) |
|---|
| S100a8 |
ACAAGGAAATCACCATGCCCT |
TCACCATCGCAAGGAACTCC |
| S100a9 |
ACCAGGACAATCAGCTGAGC |
ACAGCCTTTGCCATGACTGT |
| Gpr35 |
TCTTCCCCCTGGAGATCTTT |
CTGGGAGAAAGGAGACCACA |
| Cyp2e1 |
TCCCTAAGTATCCTCCGTGA |
GTAATCGAAGCGTTTGTTGA |
| Adh1 |
TGTGGTTGATGCAACGGTTG |
TTCGCGCATAAAAATGCCCC |
| Adh2 |
AGGCCAATCTTGCCAGAGTC |
GCCAAAGACAGCACAAGTGG |
| Adh3 |
CTGGACGAATCCTCCTCCGTAGC |
GACTGACAGGCCAACTCCTC |
| Adh4 |
AGGCCAATCTTGCCAGAGTC |
GCCAAAGACAGCACAAGTCC |
| Aldh1 |
GCACTCAATGGTGGGAAAGT |
TTTGGCCACACACTCCAATA |
| Aldh2 |
GCTGGGCTGACAAGTACCAT |
TTGATCAAGTTGGCCACGTA |
Statistical analysis
Data were analyzed by one-way ANOVA or two-way
repeated-measures ANOVA followed by Tukey-Kramer honest significant
difference (HSD) test. The level of significance was set at
P<0.05. In tables and figures, the means in the row or bar with
superscripts without a common letter significantly differ,
P<0.05 (Tukey-Kramer HSD test).
Results
Growth and senescence grading
score
Food and fluid intake, body weight, and weights of
adipose tissues and gastrocnemius muscle weight were not
significantly different among the three groups (Table II). Mean ethanol intake in the
2%-ethanol group was almost twice as much as that in the 1%-ethanol
group (Table III). Licking counts
of drinking water (access status to water bottle) in 20-week-old
mice are indicated in Table IV. The
temporal changes in the senescence grading score (behavior, skin
and hair, eyes, spondylus, and total) are shown in Table V. In 18-week-old mice, the senescence
score of behavior and total senescence score were unaffected by
ethanol intake. In contrast, in 22-week-old mice, both 1% and
2%-ethanol intake significantly (P<0.05) decreased the
senescence scores for behavior and total scores compared to the
controls. In 25-week-old mice, 1%-ethanol intake caused lower
scores of behavior and total scores than the other two groups
(P<0.05). The senescence scores of skin and hair were
significantly lower (P<0.05) in the 2%-ethanol group than in the
control groups in 18-week-old mice, but there was no difference
between the control and 1%-ethanol groups. Ethanol intake caused no
influence on the senescence score of spondylus in 25-week-old
mice.
| Table II.Effects of ethanol exposure on SAMP8
mice. |
Table II.
Effects of ethanol exposure on SAMP8
mice.
| Variable | Control (no
ethanol) | 1% Ethanol | 2% Ethanol |
|---|
| Final body weight
(g) | 30.6±0.8 | 28.6±0.8 | 30.4±0.7 |
| Gains in body
weight (g) | 6.5±0.5 | 4.6±0.9 | 6.5±0.7 |
| Epididymal adipose
tissue (g) | 0.250±0.040 | 0.156±0.028 | 0.190±0.028 |
| Perinephric adipose
tissue (g) | 0.088±0.016 | 0.061±0.012 | 0.080±0.015 |
| Gastrocnemius
muscle (g) | 0.111±0.006 | 0.111±0.006 | 0.117±0.004 |
| Total food intake
(g) | 451±12 | 467±7 | 462±6 |
| Total fluid intake
(g) | 691±30 | 680±22 | 697±31 |
| Table III.Mean of ethanol ingestion. |
Table III.
Mean of ethanol ingestion.
|
| Ethanol ingestion
(g/kg body weight−1 day−1) |
|---|
|
|
|
|---|
| Age of mice | Control (no
ethanol) | 1% Ethanol | 2% Ethanol |
|---|
| 10-week-old | 0a |
1.72±0.07b |
3.34±0.12c |
| 11-week-old | 0a |
1.65±0.07b |
3.17±0.13c |
| 13-week-old | 0a |
1.62±0.05b |
3.10±0.24c |
| 15-week-old | 0a |
1.47±0.04b |
2.93±0.13c |
| 17-week-old | 0a |
1.47±0.04b |
2.88±0.20c |
| 19-week-old | 0a |
1.45±0.07b |
3.17±0.43c |
| 21-week-old | 0a |
1.47±0.06b |
2.98±0.19c |
| 23-week-old | 0a |
1.42±0.06b |
2.69±0.15c |
| 25-week-old | 0a |
1.41±0.06b |
2.83±0.19c |
| 26-week-old | 0a |
1.44±0.06b |
2.89±0.14c |
| Table IV.Mean of licking counts of drinking
water from 11:00 a.m. to 08:00 a.m. |
Table IV.
Mean of licking counts of drinking
water from 11:00 a.m. to 08:00 a.m.
|
| Licking counts
(counts/h) |
|---|
|
|
|
|---|
| Light/dark period,
time range | Control (no
ethanol) | 1% Ethanol | 2% Ethanol |
|---|
| Light period, 11:00
a.m. to 12:00 p.m. | 7.1±3.4 | 12.4±1.2 | 7.9±0.2 |
| Dark period, 12:00
a.m. to 01:00 p.m. | 8.1±2.9 | 7.4±5.1 | 5.4±2.6 |
| Dark period, 01:00
p.m. to 02:00 p.m. | 26.4±8.1 | 20.6±2.9 | 13.9±4.0 |
| Dark period, 02:00
p.m. to 03:00 p.m. | 19.6±5.0 | 25.9±4.9 | 11.9±4.5 |
| Dark period, 03:00
p.m. to 04:00 p.m. | 16.8±5.4 | 19.6±6.4 | 12.7±6.0 |
| Dark period, 04:00
p.m. to 05:00 p.m. | 23.1±7.1 | 21.6±5.6 | 12.1±3.7 |
| Dark period, 05:00
p.m. to 06:00 p.m. | 17.8±5.4 | 13.6±4.9 | 21.0±4.9 |
| Dark period, 06:00
p.m. to 07:00 p.m. | 12.8±4.2 | 22.9±5.7 | 17.7±5.0 |
| Dark period, 07:00
p.m. to 08:00 p.m. | 12.1±4.7 | 18.8±7.2 | 10.4±9.7 |
| Dark period, 08:00
p.m. to 09:00 p.m. | 9.0±4.2 | 13.5±7.4 | 12.1±7.2 |
| Dark period, 09:00
p.m. to 10:00 p.m. | 4.5±3.0 | 7.5±3.5 | 10.4±6.6 |
| Dark period, 10:00
p.m. to 11:00 p.m. | 4.8±3.1 | 7.0±3.3 | 5.7±4.6 |
| Dark period, 11:00
p.m. to 12:00 a.m. | 10.8±3.8 | 1.4±3.3 | 11.3±5.9 |
| Light period, 00:00
a.m. to 01:00 a.m. | 1.6±1.5 | 6.8±0.8 | 5.4±2.7 |
| Light period, 01:00
a.m. to 02:00 a.m. | 0.0±0.0 | 0.6±2.7 | 4.3±6.8 |
| Light period, 02:00
a.m. to 03:00 a.m. | 0.0±0.0 | 0.4±0.5 | 2.9±3.7 |
| Light period, 03:00
a.m. to 04:00 a.m. | 1.8±1.6 | 2.5±0.4 | 4.1±2.8 |
| Light period, 04:00
a.m. to 05:00 a.m. | 2.8±2.2 | 0.1±2.4 | 1.7±2.9 |
| Light period, 05:00
a.m. to 06:00 a.m. | 3.1±3.1 | 0.6±0.1 | 2.4±2.2 |
| Light period, 06:00
a.m. to 07:00 a.m. | 0.3±0.2 | 0.0±0.5 | 0.0±1.7 |
| Light period, 07:00
a.m. to 08:00 a.m. | 2.4±2.4 | 0.3±0.0 | 0.0±2.4 |
| Table V.Effects of ethanol exposure on
senescence grading score in SAMP8 mice. |
Table V.
Effects of ethanol exposure on
senescence grading score in SAMP8 mice.
|
| Two-way
repeated-measures (ANOVA; P-value) |
|---|
|
|
|
|---|
| Variable | Week-old | Control (no
ethanol) | 1% Ethanol | 2% Ethanol | Week-old
effect | Ethanol effect | Interaction |
|---|
| Behavior | 18 | 0.03±0.03 | 0.03±0.03 | 0 |
|
|
| 22 |
0.51±0.14a |
0.08±0.04b |
0.13±0.07b | <0.01 | <0.01 | <0.01 |
|
| 25 |
0.94±0.15a |
0.30±0.16b |
0.83±0.10a |
|
| Skin and hair | 18 |
0.10±0.04a |
0.03±0.02a,b | 0b |
|
|
| 22 | 0.28±0.04 | 0.24±0.03 | 0.30±0.06 | <0.01 | 0.17 | 0.40 |
|
| 25 | 0.71±0.11 | 0.56±0.04 | 0.70±0.03 |
|
| Eyes | 18 | 0 | 0 | 0 |
|
|
| 22 | 0.15±0.12 | 0 | 0 | 0.24 | 0.25 | 0.23 |
|
| 25 | 0 | 0 | 0 |
|
| Spondylus | 18 | 0.13±0.04 | 0.10±0.03 |
0.04±0.03 |
|
|
| 22 | 0.19±0.03 | 0.16±0.04 | 0.15±0.03 | <0.01 | 0.16 | <0.05 |
|
| 25 | 0.54±0.08 | 0.34±0.05 | 0.48±0.03 |
|
| Total | 18 | 0.25±0.08 | 0.15±0.06 | 0.04±0.03 |
|
|
| 22 |
1.13±0.18a |
0.48±0.09b |
0.58±0.10b | <0.01 | <0.01 | <0.01 |
|
| 25 |
2.19±0.31a |
1.20±0.20b |
2.00±0.10a |
|
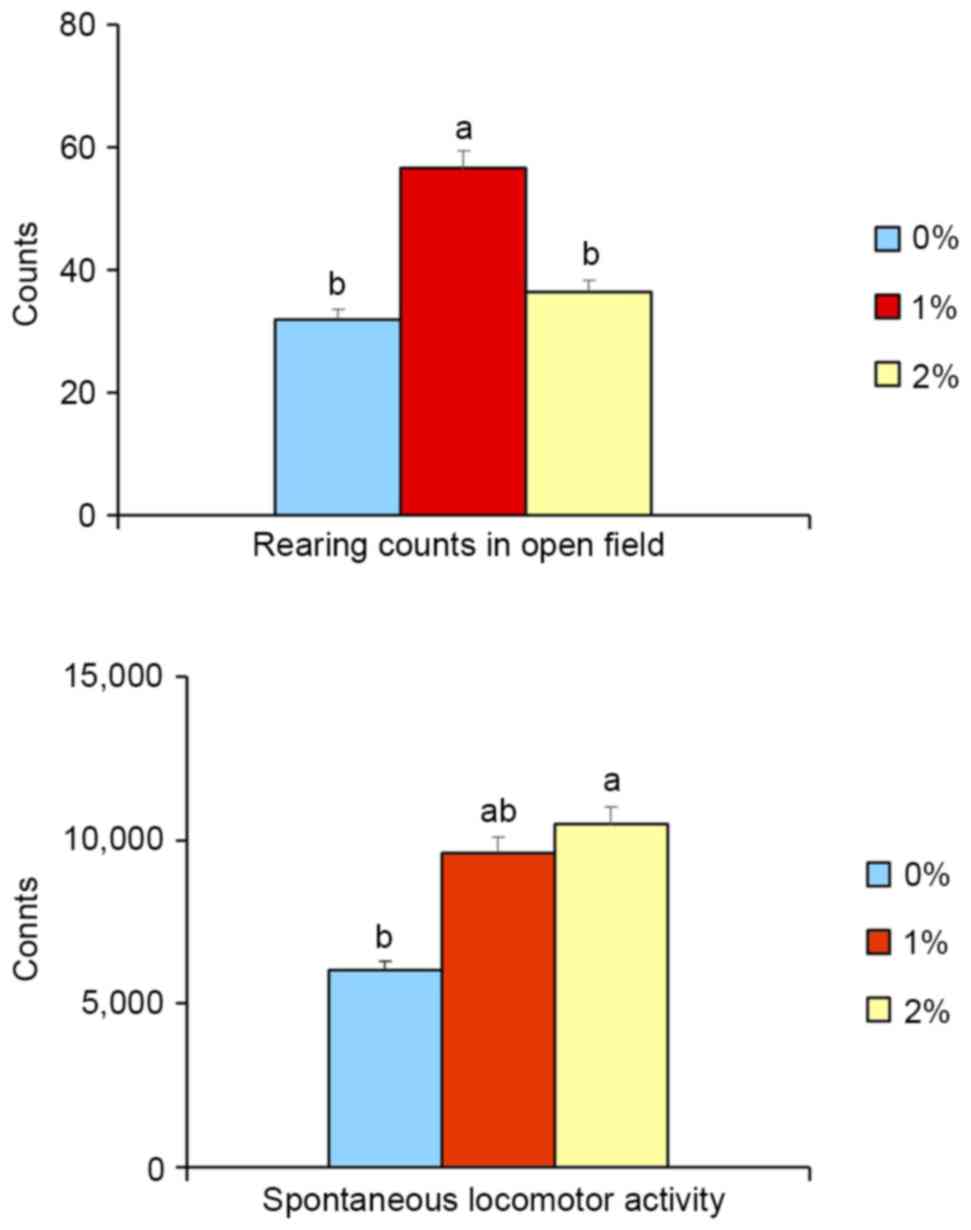
Behavioral analyzes
In the open-field test, the rearing activity of
animals in the 1%-ethanol group was significantly higher (+77%,
P<0.05) than for the control and 2%-ethanol groups. There was no
difference in activity between control and 2%-ethanol groups
(Fig. 1), indicating that
exploratory activity (index of seeking behavior) was increased in
the 1%-ethanol group. Moreover, 2%-ethanol intake significantly
elevated (+75%, P<0.05, Fig. 1)
spontaneous locomotor activity, whereas 1%-ethanol intake did not
increase such activity, implying the vitality of 2% ethanol-treated
mice. The animals allowed free access to food and drinking, mainly
from 01:00 p.m. to 08:00 p.m. in the dark period in this study,
which was confirmed by drink sensor measurements (Table IV). The open-field test was
conducted from 01:00 p.m. to 03:00 p.m., and it is unclear that the
effects of ethanol exposure on the behavioral parameters are direct
or indirect effects.
Serum parameters
None of the three groups exhibited significant
differences in serum triglyceride, total cholesterol, or glucose
levels, and AST and ALT activities were similar among the three
groups (Table VI). The serum levels
of albumin were significantly lower (−8%, P<0.05) in the ethanol
group than in the control group, but there was no difference
between the control and 2%-ethanol groups (Table VI). Intake of 1% ethanol slightly
decreased serum level of insulin (−12%, P<0.01), but that of 2%
ethanol did not (Table VI). Serum
levels of adiponectin, IGF-1, IL-1β, IL-12, and TNF-α were
unaffected by ethanol intake (Table
VI).
| Table VI.Effects of ethanol exposure on serum
parameters in SAMP8 mice. |
Table VI.
Effects of ethanol exposure on serum
parameters in SAMP8 mice.
| Variable | Control (no
ethanol) | 1% Ethanol | 2% Ethanol |
|---|
| Glucose
(mmol/l) | 8.97±0.53 | 8.19±0.59 | 8.59±0.65 |
| Triglyceride
(mmol/l) | 1.18±0.13 | 0.99±0.05 | 1.10±0.09 |
| Total cholesterol
(mmol/l) | 2.72±0.12 | 2.65±0.10 | 2.74±0.15 |
| ALT (U/l) | 25.3±1.5 | 26.5±2.1 | 26.3±1.6 |
| AST (U/l) | 133±5 | 124±9 | 135±6 |
| Albumin (g/l) |
27.0±0.4a |
24.8±0.6b |
25.5±0.7a,b |
| Insulin (mg/l) |
0.63±0.02a |
0.55±0.01b |
0.58±0.01a,b |
| Adiponectin
(mg/l) | 6.51±0.22 | 7.11±0.41 | 7.63±0.22 |
| IGF-1 (µg/l) | 310±39 | 272±35 | 237±38 |
| IL-1β (ng/l) | 407±94 | 376±94 | 308±87 |
| IL-12 (ng/l) | 128±33 | 97±33 | 80±31 |
| TNF-α (ng/l) | 312±68 | 272±68 | 211±63 |
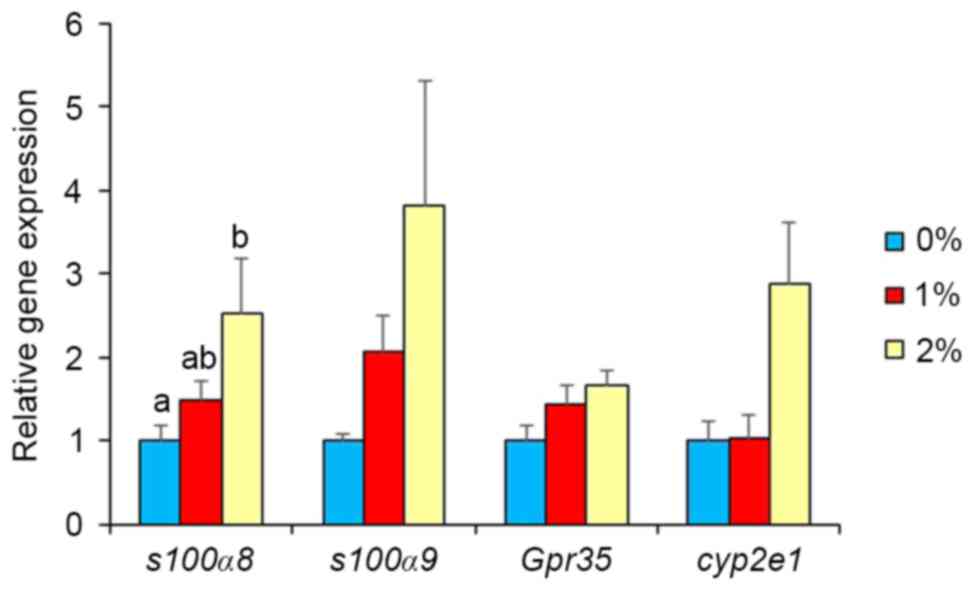
Gene expression in brain
In our preliminary study, DNA microarray analysis
indicated alterations in the gene expression of S100a8, S100a9,
GPR35, Cyp2e1, Adh1, and Adh4 by ethanol intake. Thus,
real-time PCR analysis was used in the present study to confirm
these results. Gene expression of other ethanol-metabolizing
enzymes was also determined. Intake of 2% ethanol resulted in a
2.5-fold elevation (P<0.05; Fig.
2) of S100a8 mRNA, but 1%-ethanol intake did not.
S100a9, GPR35 and Cyp2e1 expression levels were
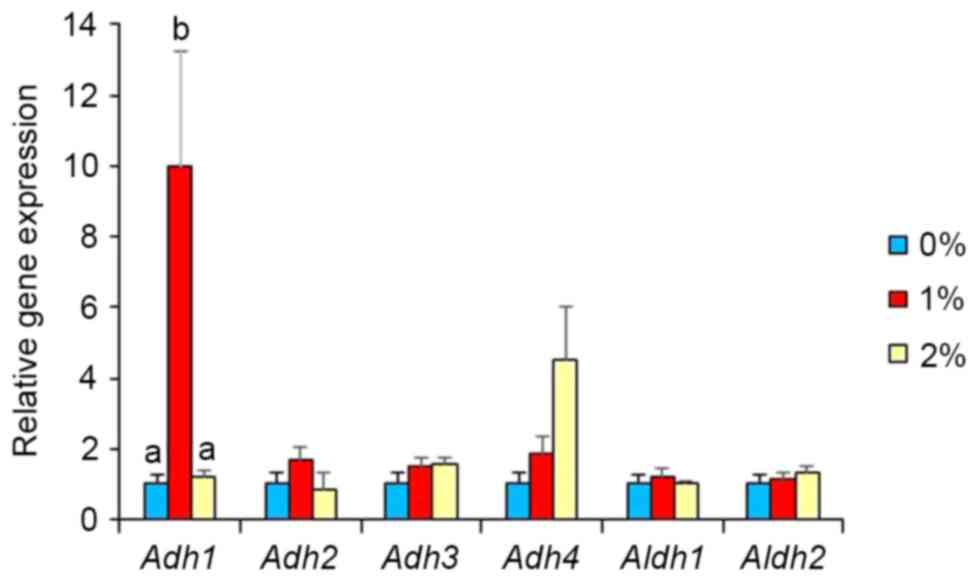
unaffected in the 2%-ethanol intake group. Intake of 1% ethanol
caused a marked elevation (10-fold, P<0.05; Fig. 3) in Adh1 expression, but that
of 2% ethanol did not. Intake of 1 and 2% ethanol caused no
influence on Adh2, Adh3, Adh4, Aldh1, and Aldh2 expression
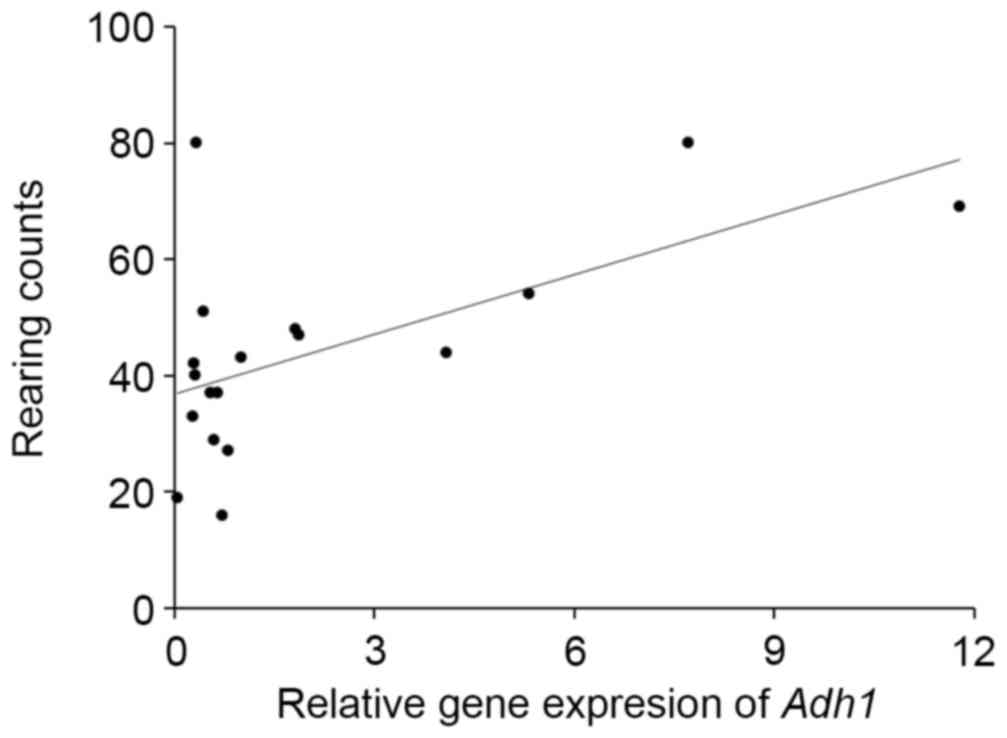
(Fig. 3). Adh1 expression was
significantly correlated with the rearing activity of the mice
(r=0.598, P<0.01; Fig. 4) and
with the total senescence score at 22 weeks (r=−0.497, P<0.05),
but not with the total senescence score at 25 weeks (r=−0.412,
P=0.09). The expression of Adh1 was not correlated
(P>0.05) with any of the serum factors or behavioral results,
with the exception of rearing activity. In addition, the serum
results were not correlated with the rearing activity and total
senescence scores (P>0.05). Adh2, Adh3, Aldh1 and
Aldh2 expression levels were unaffected by ethanol intake.
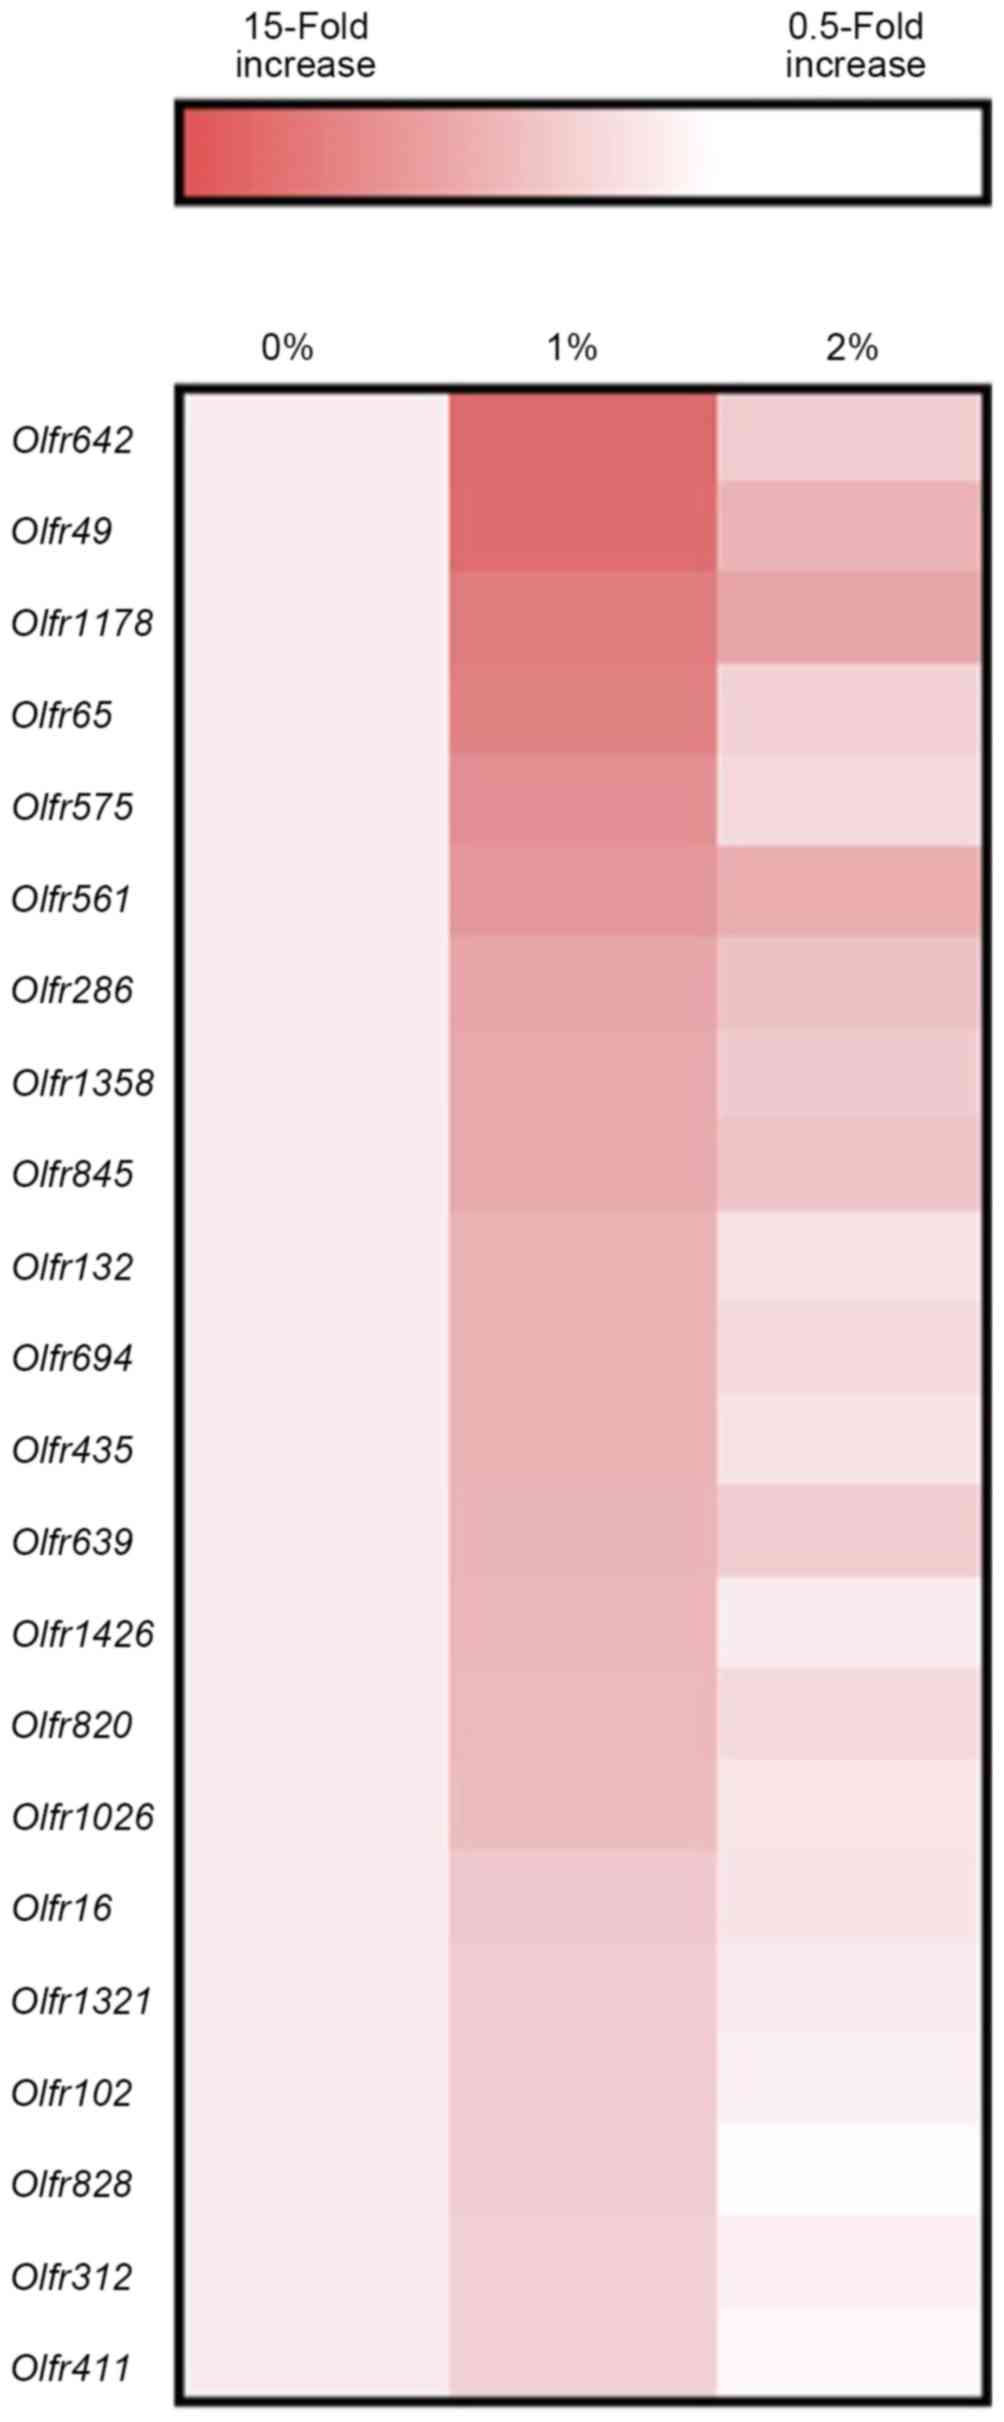
DNA microarray analysis also indicated the elevated gene expression
of several olfactory receptors as a consequence of 1% ethanol
intake (Fig. 5).
Discussion
The present results, obtained SAMP8 mice, indicate
that low-ethanol intake does not exert any significant deleterious
effects on the general welfare of animals. Consumption of 1%
ethanol appeared to retard senescence development with respect to
the eyes, skin, and hair, and behavior, whereas 2%-ethanol intake
appeared to do so to a lesser extent. These results suggest that
1%-ethanol intake is beneficial for SAMP8 mice.
Here, indices of liver function in SAMP8 mice were
unaffected by ethanol intake. This is in contrast to the results
observed in the rats fed a high-fat diet, in which 1%-ethanol
intake improved the parameters relating to the liver function
(10). Although the reason for this
discrepancy is unknown, our study implies a favorable effect of
1%-ethanol intake on SAMP8 animals, which may be mediated through
mechanisms not involving liver function. Of interest is the finding
that 1%- ethanol intake caused a significant reduction in serum
insulin, which has been considered to play an important role in
aging process (18), whereas 2%
ethanol did not. However, serum insulin levels were not associated
with the total senescence score, raising activity and Ahd1
expression. Further study is necessary to examine the effect of 1%
ethanol on insulin signaling in the senescence mice.
In this study, analysis using open-field tests
demonstrated a significant elevation in rearing activity in the
1%-ethanol group, but not in the 2%-ethanol group. This rearing
activity has been suggested an index of exploratory behavior
(19,20). Importantly, senescence has previously
been reported to be associated with diminished rearing activity
(21,22). Thus, at low doses of ethanol, ethanol
is likely to cause positive effects on such ‘seeking-out’ behavior,
which is otherwise decreased by senescence. Because senescence is
associated with decreased locomotor function in SAMP1 animals
(23), locomotor function was also
examined. We found that 2%-ethanol intake significantly elevated
(+75%) locomotor activity, whereas 1%-ethanol intake tended to
promote such activity to a lesser degree (+60%). The results were
consistent with the previous studies indicating low doses of
ethanol stimulate locomotor activity in mice (24). Thus, intake of either 1 or 2% ethanol
appears to have positive effect on the locomotor function in SAMP8
mice.
Gene expression analysis revealed significantly
higher levels of brain S100a8 in the 2%-ethanol group, but
not in the 1%-ethanol group. S100a9, GPR35 and Cyp2e1
expressions also tended to be higher in the 2%-ethanol group.
S100a8 and S100a9 have been suggested to be involved
in inflammatory signaling (25), and
GPR35 is proposed to be associated with inflammation (26). Cyp2e1 is considered a source
of reactive oxygen species generation (27). Thus, the dose of 2% ethanol appears
to be necessary for the induction of expression of the factors
responsible for inflammation and oxidative stress.
Surprisingly, our study quantified a marked
elevation in gene expression in brain tissue for Adh1 in the
1%-ethanol group, but not in the 2%-ethanol group. Alcohol
dehydrogenases (ADHs) metabolize a broad spectrum of substrates
such as alcohols and aldehydes endogenously produced during lipid
peroxidation so as to prevent the possible toxic accumulation of
these compounds (28). Because these
compounds can be harmful to dopaminergic neurons, ADHs have
attracted attention. Genetic variants in ADH1C have been reported
to be associated with Parkinson disease (29). In fact, recent study using
Adh1 knockout mice has shown lack of Adh1 leads to
changes in dopamine neurons related behavior (30). Furthermore, Adhs are a
critical mediator of retinoic acid synthesis from vitamin A
(31,32). Retinoic acid has been suggested a
protective factor against neurodegenaration via retinoid signaling
(33). Our studies further indicated
Adh1 expression is significantly correlated with the rearing
activity. Expression of several olfactory receptor genes was also
higher in the 1%-ethanol group compared with other groups. An
Alzheimer's disease model rat revealed down regulation of olfactory
receptor genes in the olfactory bulb (34) and olfactory dysfunction has been also
reported in neurodegerative disorders such as Alzheimer's and
Parkinson's diseases. Olfactory dysfunction also increases with
aging. In view of these facts, it will be necessary to evaluate if
perturbed expression of Adh1 expression leads to the
alterations in the rearing activity. Furthermore, the elevation of
Adh1 expression requires confirmation at the protein level
and is being investigated in future studies.
We obtained preliminary measurement data for serum
ethanol when dissected (01:00 p.m. to 03:00 p.m.) at 23-week-old,
noting that no differences were observed among the three groups
(Kimoto et al, unpublished data). At present, there are no
supporting data from the literature to suggest what blood or brain
ethanol concentrations may have been reached in this model as a
result of the 1 and 2% ethanol treatments. It has been reported
that consumption of 6% ethanol containing liquid diet by C56BL6
mice for 22 weeks permits the use of plasma ethanol as a
confirmation of alcohol exposure model (35). Meanwhile, plasma ethanol levels of
the mice fed 3% ethanol containing liquid diet did not
significantly differ from the base line levels of mice without
receiving ethanol (35).
In conclusion, our study provides evidence for the
beneficial effect of low doses of ethanol on SAMP8 mice. In
particular, 1%-ethanol intake appeared to cause a favorable effect
on senescence score and rearing activity, whereas 2%-ethanol intake
prompted a lesser effect. These results support the J-curve effect
for ethanol exposure as suggested by a number of epidemiological
studies (1–3). Of great interest is the finding of the
markedly higher Adh1 expression in the brains of 1%-ethanol
group, but not in those of the 2%-ethanol exposed group. Thus, our
results raised the prospect that the induction of Adh1
expression by 1% ethanol intake leads to the quantified beneficial
effect. Further research is necessary to examine this proposal. The
molecular mechanisms modulating higher levels of Adh1
expression by 1% ethanol also warrant further investigation. At
present, it is unclear whether the 1% ethanol intake exerted direct
or indirect effect on the Adh1 expression and the rearing
activity. Further study will be necessary to reveal this issue.
Acknowledgements
This study was supported in part by a Grant-in-Aid
for Scientific Research from the Ministry of Education, Culture,
Sports, Science and Technology of Japan and in part by a grant from
the Brewers Association of Japan. The authors would like to thank
Enago (www.enago.jp) for English language
review.
References
|
1
|
Marmot MG, Rose G, Shipley MJ and Thomas
BJ: Alcohol and mortality: A U-shaped curve. Lancet. 1:580–583.
1981. View Article : Google Scholar : PubMed/NCBI
|
|
2
|
Di Castelnuovo A, Costanzo S, Bagnardi V,
Donati MB, Iacoviello L and de Gaetano G: Alcohol dosing and total
mortality in men and women: An updated meta-analysis of 34
prospective studies. Arch Intern Med. 166:2437–2445. 2006.
View Article : Google Scholar : PubMed/NCBI
|
|
3
|
Nova E, Baccan GC, Veses A, Zapatera B and
Marcos A: Potential health benefits of moderate alcohol
consumption: Current perspectives in research. Proc Nutr Soc.
71:pp. 307–315. 2012; View Article : Google Scholar : PubMed/NCBI
|
|
4
|
Mukamal KJ, Kuller LH, Fitzpatrick AL,
Longstreth WT Jr, Mittleman MA and Siscovick DS: Prospective study
of alcohol consumption and risk of dementia in older adults. JAMA.
289:1405–1413. 2003. View Article : Google Scholar : PubMed/NCBI
|
|
5
|
Peters R, Peters J, Warner J, Beckett N
and Bulpitt C: Alcohol, dementia and cognitive decline in the
elderly: A systematic review. Age Ageing. 37:505–512. 2008.
View Article : Google Scholar : PubMed/NCBI
|
|
6
|
Fagrell B, De Faire U, Bondy S, Criqui M,
Gaziano M, Gronbaek M, Jackson R, Klatsky A, Salonen J and Shaper
AG: The effects of light to moderate drinking on cardiovascular
diseases. J Intern Med. 246:331–340. 1999. View Article : Google Scholar : PubMed/NCBI
|
|
7
|
McCann SE, Sempos C, Freudenheim JL, Muti
P, Russell M, Nochajski TH, Ram M, Hovey K and Trevisan M:
Alcoholic beverage preference and characteristics of drinkers and
nondrinkers in western New York (United States). Nutr Metab
Cardiovasc Dis. 13:2–11. 2003. View Article : Google Scholar : PubMed/NCBI
|
|
8
|
Lieber CS and DeCarli LM: Liquid diet
technique of ethanol administration: 1989 update. Alcohol Alcohol.
24:197–211. 1989.PubMed/NCBI
|
|
9
|
Izu H, Shobayashi M, Manabe Y, Goto K and
Iefuji H: S-adenosylmethionine (SAM)-accumulating sake yeast
suppresses acute alcohol-induced live injury in mice. Biosci
Biotechnol Biochem. 70:2982–2989. 2006. View Article : Google Scholar : PubMed/NCBI
|
|
10
|
Collins MA, Neafsey EJ, Mukamal KJ, Gray
MO, Parks DA, Das DK and Korthuis RJ: Alcohol in moderation,
cardioprotection and neuroprotection: Epidemiological
considerations and mechanistic studies. Alcohol Clin Exp Res.
33:206–219. 2009. View Article : Google Scholar : PubMed/NCBI
|
|
11
|
Ilomaki J, Jokanovic N, Tan EC and
Lonnroos E: Alcohol consumption, dementia and cognitive decline: An
overview of systematic reviews. Curr Clin Pharmacol. 10:204–212.
2015. View Article : Google Scholar : PubMed/NCBI
|
|
12
|
Godfrey J, Jeanguenin L, Castro N, Olney
JJ, Dudley J, Pipkin J, Walls SM, Wang W, Herr DR, Harris GL and
Brasser SM: Chronic voluntary ethanol consumption induces favorable
ceramide profiles in selectively bred alcohol-preferring (P) rats.
PLoS One. 10:e01390122015. View Article : Google Scholar : PubMed/NCBI
|
|
13
|
Osaki A, Okazaki Y, Kimoto A, Izu H and
Kato N: Beneficial effect of low dose of ethanol on liver function
and serum urate in rats fed a high-fat diet. J Nutr Sci Vitaminol
(Tokyo). 60:408–412. 2014. View Article : Google Scholar : PubMed/NCBI
|
|
14
|
Hosokawa M, Kasai R, Higuchi K, Takeshita
S, Shimizu K, Hamamoto H, Honma A, Irino M, Toda K, Matsumura A, et
al: Grading score system: A method for evaluation of the degree of
senescence in senescence accelerated mouse (SAM). Mech Ageing Dev.
26:91–102. 1984. View Article : Google Scholar : PubMed/NCBI
|
|
15
|
Takeda T: Senescence-accelerated mouse
(SAM) with special references to neurodegeneration models, SAMP8
and SAMP10 mice. Neurochem Res. 34:639–659. 2009. View Article : Google Scholar : PubMed/NCBI
|
|
16
|
Wang H, Lian K, Han B, Wang Y, Kuo SH,
Geng Y, Qiang J, Sun M and Wang M: Age-related alterations in the
metabolic profile in the hippocampus of the senescence-accelerated
mouse prone 8: A spontaneous Alzheimer's disease mouse model. J
Alzheimers Dis. 39:841–848. 2014.PubMed/NCBI
|
|
17
|
Shinozaki M, Takahashi Y, Mukaino M, Saito
N, Toyama Y, Okano H and Nakamura M: Novel concept of motor
functional analysis for spinal cord injury in adult mice. J Biomed
Biotechnol. 2011:1574582011. View Article : Google Scholar : PubMed/NCBI
|
|
18
|
Lamming DW: Diminished mTOR signaling: A
common mode of action for endocrine longevity factors.
Springerplus. 3:7352014. View Article : Google Scholar : PubMed/NCBI
|
|
19
|
Easton A, Arbuzova J and Turek FW: The
circadian Clock mutation increases exploratory activity and
escape-seeking behavior. Genes Brain Behav. 2:11–19. 2003.
View Article : Google Scholar : PubMed/NCBI
|
|
20
|
Pardo M, López-Cruz L, Valverde O, Ledent
C, Baqi Y, Müller CE, Salamone JD and Correa M: Effect of
subtype-selective adenosine receptor antagonists on basal or
haloperidol-regulated striatal function: Studies of exploratory
locomotion and c-Fos immunoreactivity in outbred and A(2A)R KO
mice. Behav Brain Res. 247:217–226. 2013. View Article : Google Scholar : PubMed/NCBI
|
|
21
|
Ikegami S, Shumiya S and Kawamura H:
Age-related changes in radial-arm maze learning and basal forebrain
cholinergic systems in senescence accelerated mice (SAM). Behav
Brain Res. 51:15–22. 1992. View Article : Google Scholar : PubMed/NCBI
|
|
22
|
Lalonde R and Strazielle C: Exploratory
activity and motor coordination in old versus middle-aged C57BL/6 J
mice. Arch Gerontol Geriatr. 49:39–42. 2009. View Article : Google Scholar : PubMed/NCBI
|
|
23
|
Aoyama Y, Kim TY, Yoshimoto T, Niimi K,
Takahashi E and Itakura C: Impaired motor function in
senescence-accelerated mouse prone 1 (SAMP1). Brain Res.
1515:48–54. 2013. View Article : Google Scholar : PubMed/NCBI
|
|
24
|
Arizzi MN, Correa M, Betz AJ, Wisniecki A
and Salamone JD: Behavioral effects of intraventricular injections
of low doses of ethanol, acetaldehyde and acetate in rats: Studies
with low and high rate operant schedules. Behav Brain Res.
147:203–210. 2003. View Article : Google Scholar : PubMed/NCBI
|
|
25
|
Gebhardt C, Németh J, Angel P and Hess J:
S100A8 and S100A9 in inflammation and cancer. Biochem Pharmacol.
72:1622–1631. 2006. View Article : Google Scholar : PubMed/NCBI
|
|
26
|
Divorty N, Mackenzie AE, Nicklin SA and
Milligan G: G protein-coupled receptor 35: An emerging target in
inflammatory and cardiovascular disease. Front Pharmacol. 6:412015.
View Article : Google Scholar : PubMed/NCBI
|
|
27
|
Seitz HK and Wang XD: The role of
cytochrome P450 2E1 in ethanol-mediated carcinogenesis. Subcell
Biochem. 67:131–143. 2013. View Article : Google Scholar : PubMed/NCBI
|
|
28
|
Boleda MD, Saubi N, Farrés J and Parés X:
Physiological substrates for rat alcohol dehydrogenase classes:
Aldehydes of lipid peroxidation, omega-hydroxyfatty acids and
retinoids. Arch Biochem Biophys. 307:85–90. 1993. View Article : Google Scholar : PubMed/NCBI
|
|
29
|
Buervenich S, Sydow O, Carmine A, Zhang Z,
Anvret M and Olson L: Alcohol dehydrogenase alleles in Parkinson's
disease. Mov Disord. 15:813–818. 2000. View Article : Google Scholar : PubMed/NCBI
|
|
30
|
Anvret A, Ran C, Westerlund M, Gellhaar S,
Lindqvist E, Pernold K, Lundströmer K, Duester G, Felder MR, Galter
D and Belin AC: Adh1 and Adh1/4 knockout mice as possible rodent
models for presymptomatic parkinson's disease. Behav Brain Res.
227:252–257. 2012. View Article : Google Scholar : PubMed/NCBI
|
|
31
|
Duester G: Alcohol dehydrogenase as a
critical mediator of retinoic acid synthesis from vitamin A in the
mouse embryo. J Nutr. 128 2 Suppl:459S–462S. 1998.PubMed/NCBI
|
|
32
|
Molotkov A, Deltour L, Foglio MH, Cuenca
AE and Duester G: Distinct retinoid metabolic functions for alcohol
dehydrogenase genes Adh1 and Adh4 in protection against vitamin A
toxicity or deficiency revealed in double null mutant mice. J Biol
Chem. 277:13804–13811. 2002. View Article : Google Scholar : PubMed/NCBI
|
|
33
|
Sodhi RK and Singh N: Retinoids as
potential targets for Alzheimer's disease. Pharmacol Biochem Behav.
120:117–123. 2014. View Article : Google Scholar : PubMed/NCBI
|
|
34
|
Zhu YY, Ni DF and Xu CM: Gene expression
profiles in the olfactory bulb from a rat model of Alzheimer's
disease. J Alzheimers Dis. 18:581–593. 2009. View Article : Google Scholar : PubMed/NCBI
|
|
35
|
Emeson EE, Manaves V, Singer T and Tabesh
T: Chronic alcohol feeding inhibits atherogenesis in C57BL/6
hyperlipidemic mice. Am J Pathol. 147:1749–1758. 1995.PubMed/NCBI
|