Introduction
X-ray computed tomography (CT) is a medical imaging
technique in which computer-processed X-ray projections are used to
produce tomographic images or slices of specific areas of the body.
Since 2000, the importance of multi-detector CT, which permits
faster scanning and a wider range of clinical applications, has
been recognized (1). According to a
report from the Ministry of Health, Labour and Welfare of Japan,
the number of facilities that owned diagnostic CT equipment, the
number of CT examinations and the number of CT scanners in 2005
were 8,149 [1-month (September) total], 1,634,056 [1-month
(September) total] and 8,903 (as of October 1st), respectively
(2). By 2011, these numbers had
increased to 11,415 [1-month (September) total], 2,357,580 [1-month
(September) total] and 12,482 (as of October 1st), respectively
(3), demonstrating a ~1.4-fold
increase relative to 2005.
A study by Tsushima et al (4) indicated that CT is accountable for more
than half of the radiation exposure incurred from diagnostic
imaging. The authors noted that unfortunately no reliable data
regarding radiation exposure from radiological imaging are
available; it is expected that the situation in Japan is similar.
The International Commission on Radiological Protection (ICRP)
developed the ‘as low as reasonably achievable’ concept to minimize
exposure (5). Although the effects
of low-dose exposure have not been clarified, various reports have
suggested that exposure is carcinogenic (6–8). As
pediatric patients are generally highly radiation-sensitive and
have a long life expectancy, it is necessary to pay particular
attention to their medical exposure. In 2005, the Japan
Radiological Society, Japanese Society of Radiological Technology
and Japanese Society of Pediatric Radiology published CT guidelines
with the intent to reduce CT exposure dose (9). Therefore, the actual pediatric medical
exposure derived from CT scans should be estimated.
The present study aimed to clarify the actual
radiation exposure incurred by children during CT examinations and
the effective doses in various regions, particularly in children
aged 0, 1 and 5 years, using data collected at Hirosaki University
Hospital (Hirosaki, Japan) during a 3-year period from January 2011
to December 2013.
Materials and methods
Analysis of CT examination
Data of CT examinations performed at Hirosaki
University Hospital from January 2011 to December 2013 were
extracted from the hospital's radiology information system (RISE-1
Version 1.1.6.0, PSP Corporation, Tokyo, Japan) and analyzed using
a Digital Imaging and Communication in Medicine image viewer (EV
Insite Version 2.10.6.45, PSP Corporation). The extracted data
included the patient's age, examination region, scan protocols,
volume CT dose index (CTDIvol) and dose-length product
(DLP). Other specific information about each patient was not
extracted to avoid a loss of confidentiality. In addition, the
original study files were subjected to high security. The files
were password-protected for both reading and editing, and only the
first author managed the data. Regions on which CT examinations
were performed were classified as the head, neck, chest, abdomen,
pelvis, coronary and extremity. For example, if one patient had
undergone head, abdominal, and pelvic scans, the numbers of
patients and regions would be 1 and 3, respectively. Hirosaki
University Hospital used the following CT devices for diagnostic
radiation: LightSpeed QX/i (GE Healthcare, Waukesha, WI, USA),
Discovery CT 750HD (GE Healthcare), SOMATOM Definition (Siemens AG,
Erlangen, Germany), SOMATOM Definition AS (Siemens AG) and Aquilion
PREMIUM (Toshiba Medical Systems Corp., Otawara, Japan). The
present study was approved by the Committee of Medical Ethics of
Hirosaki University Graduate School of Medicine (Hirosaki,
Japan).
Evaluation of effective doses
Effective doses were calculated using the
age-specific and region-specific conversion factors provided in the
ICRP Publication 102 (Table I)
(10). The effective dose in mSv was
calculated by multiplying the conversion factors by the DLP.
Although the present study focused on children aged 0–5 years,
Publication 102 only provided conversion factors for children aged
0, 1 and 5 years. Therefore, the effective dose evaluation only
included children of the following ages: 0 years (up to 11 months
after birth), 1 year (up to 1 year and 11 months after birth) and 5
years (up to 5 years and 11 months after birth). The evaluated
regions were the head, neck, chest, abdomen and pelvis. Coronary
and extremity CT scans were excluded from the evaluation due to a
lack of available conversion factors in Publication 102 (10). The clinical scan protocols obtained
from the Discovery CT 750HD device, including region, scan type,
tube voltage, tube current, noise index, rotation time and pitch
are summarized in Table II. The
console-displayed CTDIvol was calculated from the mean
tube current when the automatic exposure control (AEC) setting on
the Discovery CT 750HD was used. Discovery CT 750HD equipment was
used for effective dose estimation in the present study. All
displayed DLP data were obtained from the Discovery CT 750HD in
accordance with the International Electrotechnical Commission
60601-2-44 Ed.3 (11). At that time,
patients without displayed DLP data were excluded from the
evaluation, as the effective dose could not be calculated. Exposure
doses incurred from positioning images (i.e., scout view) were not
evaluated in the present study as they differed in terms of
concepts of CTDIvol and DLP.
 | Table I.Age-specific and region-specific
conversion factors derived from the International Commission on
Radiological Protection Publication 102. |
Table I.
Age-specific and region-specific
conversion factors derived from the International Commission on
Radiological Protection Publication 102.
|
|
| Patient age,
years |
|---|
|
|
|
|
|---|
| Region | 0 | 1 | 5 |
|---|
| Head | 0.0110 | 0.0067 | 0.0040 |
| Neck | 0.0170 | 0.0120 | 0.0110 |
| Chest | 0.0390 | 0.0260 | 0.0180 |
| Abdomen | 0.0490 | 0.0300 | 0.0200 |
| Pelvis | 0.0490 | 0.0300 | 0.0200 |
| Table II.Discovery Computed Tomography 750HD
scan protocol used for effective dose estimation. |
Table II.
Discovery Computed Tomography 750HD
scan protocol used for effective dose estimation.
|
|
|
|
| Scan parameter |
|---|
|
|
|
|
|
|
|---|
| Protocol | Region | Scan type | Tube voltage, kV | Tube current, mA | Set min
mAa | Set max
mAa | Noise index | Rotation time,
sec | Slice thick-ness,
mm | Beam colli-mation,
mm | Pitch |
|---|
| Clinical | Head | Axial | 120 | AEC | 50 | 400 | 3.5 | 0.5 | 5 | 20 | – |
|
|
| Helical | 120 | AEC | 50 | 400 | 3.5 | 0.5 | 5 | 20 | 0.969 |
|
| Neck, chest | Helical | 80, 100 | AEC | 40 | 100, 150, 200 | 10.97, 11.97 | 0.4 | 5 | 20 | 0.969 |
|
| Abdomen, pelvis | Helical | 80, 100 | AEC | 30 | 80, 100, 120 | 10.97 | 0.5 | 5 | 20 | 0.969 |
| Measurement | Head | Axial | 120 | 50, 100, 150 | – | – | – | 0.5 | 5 | 20 | – |
|
|
| Helical | 120 | 50, 100, 150 | – | – | – | 0.5 | 5 | 20 | 0.969 |
|
| Neck, chest, abdomen,
pelvis | Helical | 80, 100 | 100, 200 | – | – | – | 0.4 | 5 | 20 | 0.969 |
To confirm the accuracies of the displayed
CTDIvol and DLP, it was necessary to compare the
measured CTDIvol and DLP. The measured
CTDIvol value of each protocol was measured using a 9015
dosimeter and 10X5-3CT chamber (Radcal Corp., Monrovia, CA, USA). A
CTDI phantom (16-cm diameter, IBA Dosimetry GmbH, Schwarzenbruck,
Germany) was placed on urethane foam at the CT gantry opening to
eliminate an influence of the couch. Each measurement was repeated
three times per measurement position (center and four peripheral
points) on the Discovery CT 750HD, using scan parameters similar to
the clinical protocols (Table II).
The CTDIvol was calculated using corrected temperature
and pressure values, a calibration constant, W-value, beam width,
gantry rotation number and pitch. The DLP (mGy × cm) was calculated
by multiplying the measured CTDIvol (mGy) by the scan
range (cm). These calculations were based on Publication 102
(10). The scan protocols in the
present study were subjected to the 16-cm phantom. As ~50% of the
pediatric radiological examination data were obtained with 750HD
and the differences between the measured CTDIvol and DLP
and console-displayed CTDIvol and DLP had a minimum
value of <2.4%, the following analysis only used examination
data obtained with the 750HD.
The advantages of this effective dose estimation
method included its user-friendliness and ready availability for
estimating pediatric effective CT doses, particularly in diagnostic
facilities without specialized equipment, application tools and
knowledge. However, the effective doses obtained with this method
did not consider each individual patient, and so the effective
doses are a reference value (10),
that yield normalized effective doses.
Statistical analysis
Normality tests of the data was performed using the
χ2 goodness of fit test to confirm that they were
non-parametric data. Significant differences within groups were
determined using Kruskal-Wallis tests. The statistical
significances of differences among multiple groups were assessed
using the Steel-Dwass test for non-parametric multiple comparisons.
All statistical analysis were calculated using Excel 2010 Version
14.0.7177.5000 (Microsoft Corp., Redmond, WA, USA) with the Statcel
3 add-on package (OMS publishing Inc., Saitama, Japan). Data were
presented as the mean ± standard deviation. P<0.05 was
considered to indicate a statistically significant difference.
Results
Number of CT examinations
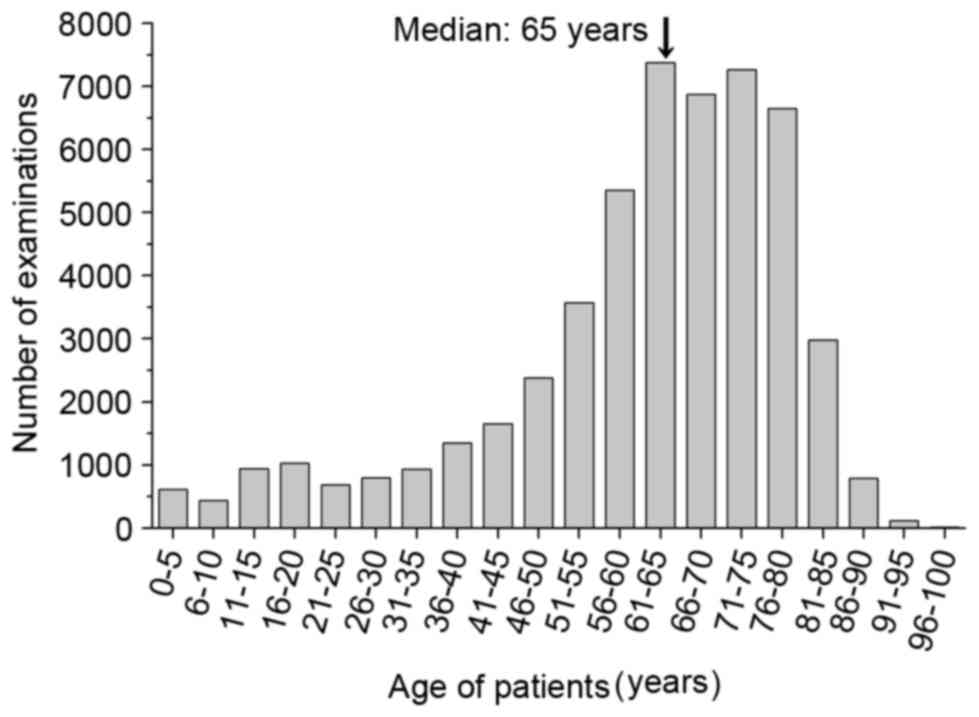
In 2011, 2012 and 2013, 16,662, 17,491 and 17,649 CT
examinations were performed, respectively, for a total of 51,802
examinations during the 3-year period. All examinations were
classified as follows: Children aged 0–5 years were classified into
one group, and all other older subjects were classified into 5-year
categories up to >96 years (Fig.
1). The median age was 65 years, and a large proportion of the
patients' ages ranged from 61–80 years, with 7,381 and 6,650 cases
in the 61–65 and 76–80 year groups, respectively. In total, 613
cases (1.2%) involved children aged 0–5 years. The numbers of CT
examinations per region and age group are summarized in Table III.
| Table III.Number of computed tomography
examination regions among children aged 0–5 years. |
Table III.
Number of computed tomography
examination regions among children aged 0–5 years.
|
|
| Region, n |
|
|---|
|
|
|
|
|
|---|
| Age, years | Number of
patients | Head | Neck | Chest | Abdomen | Pelvis | Coronary | Extremity | Total regions |
|---|
| 0 | 221 | 110 | 40 | 108 | 103 | 44 | 0 | 1 |
406 |
| 1 | 104 | 55 | 23 | 40 | 44 | 28 | 0 | 0 |
190 |
| 2 | 56 | 30 |
8 | 18 | 25 | 15 | 0 | 2 |
98 |
| 3 | 73 | 27 | 11 | 25 | 37 | 23 | 0 | 1 |
124 |
| 4 | 78 | 39 | 20 | 32 | 30 | 19 | 0 | 0 |
140 |
| 5 | 81 | 36 | 24 | 32 | 29 | 17 | 1 | 1 |
140 |
| Total | 613 | 297 | 126 | 255 | 268 | 146 | 1 | 5 | 1,098 |
Estimated effective doses in
children
As previously mentioned, although the present study
focused on an analysis of children aged 0–5 years (total 613
cases), conversion factors from Publication 102 were only available
for ages 0, 1 and 5 years. The present study therefore only
evaluated the effective dose for these ages. The effective dose
evaluation targeted the 173 cases subjected to diagnostic radiology
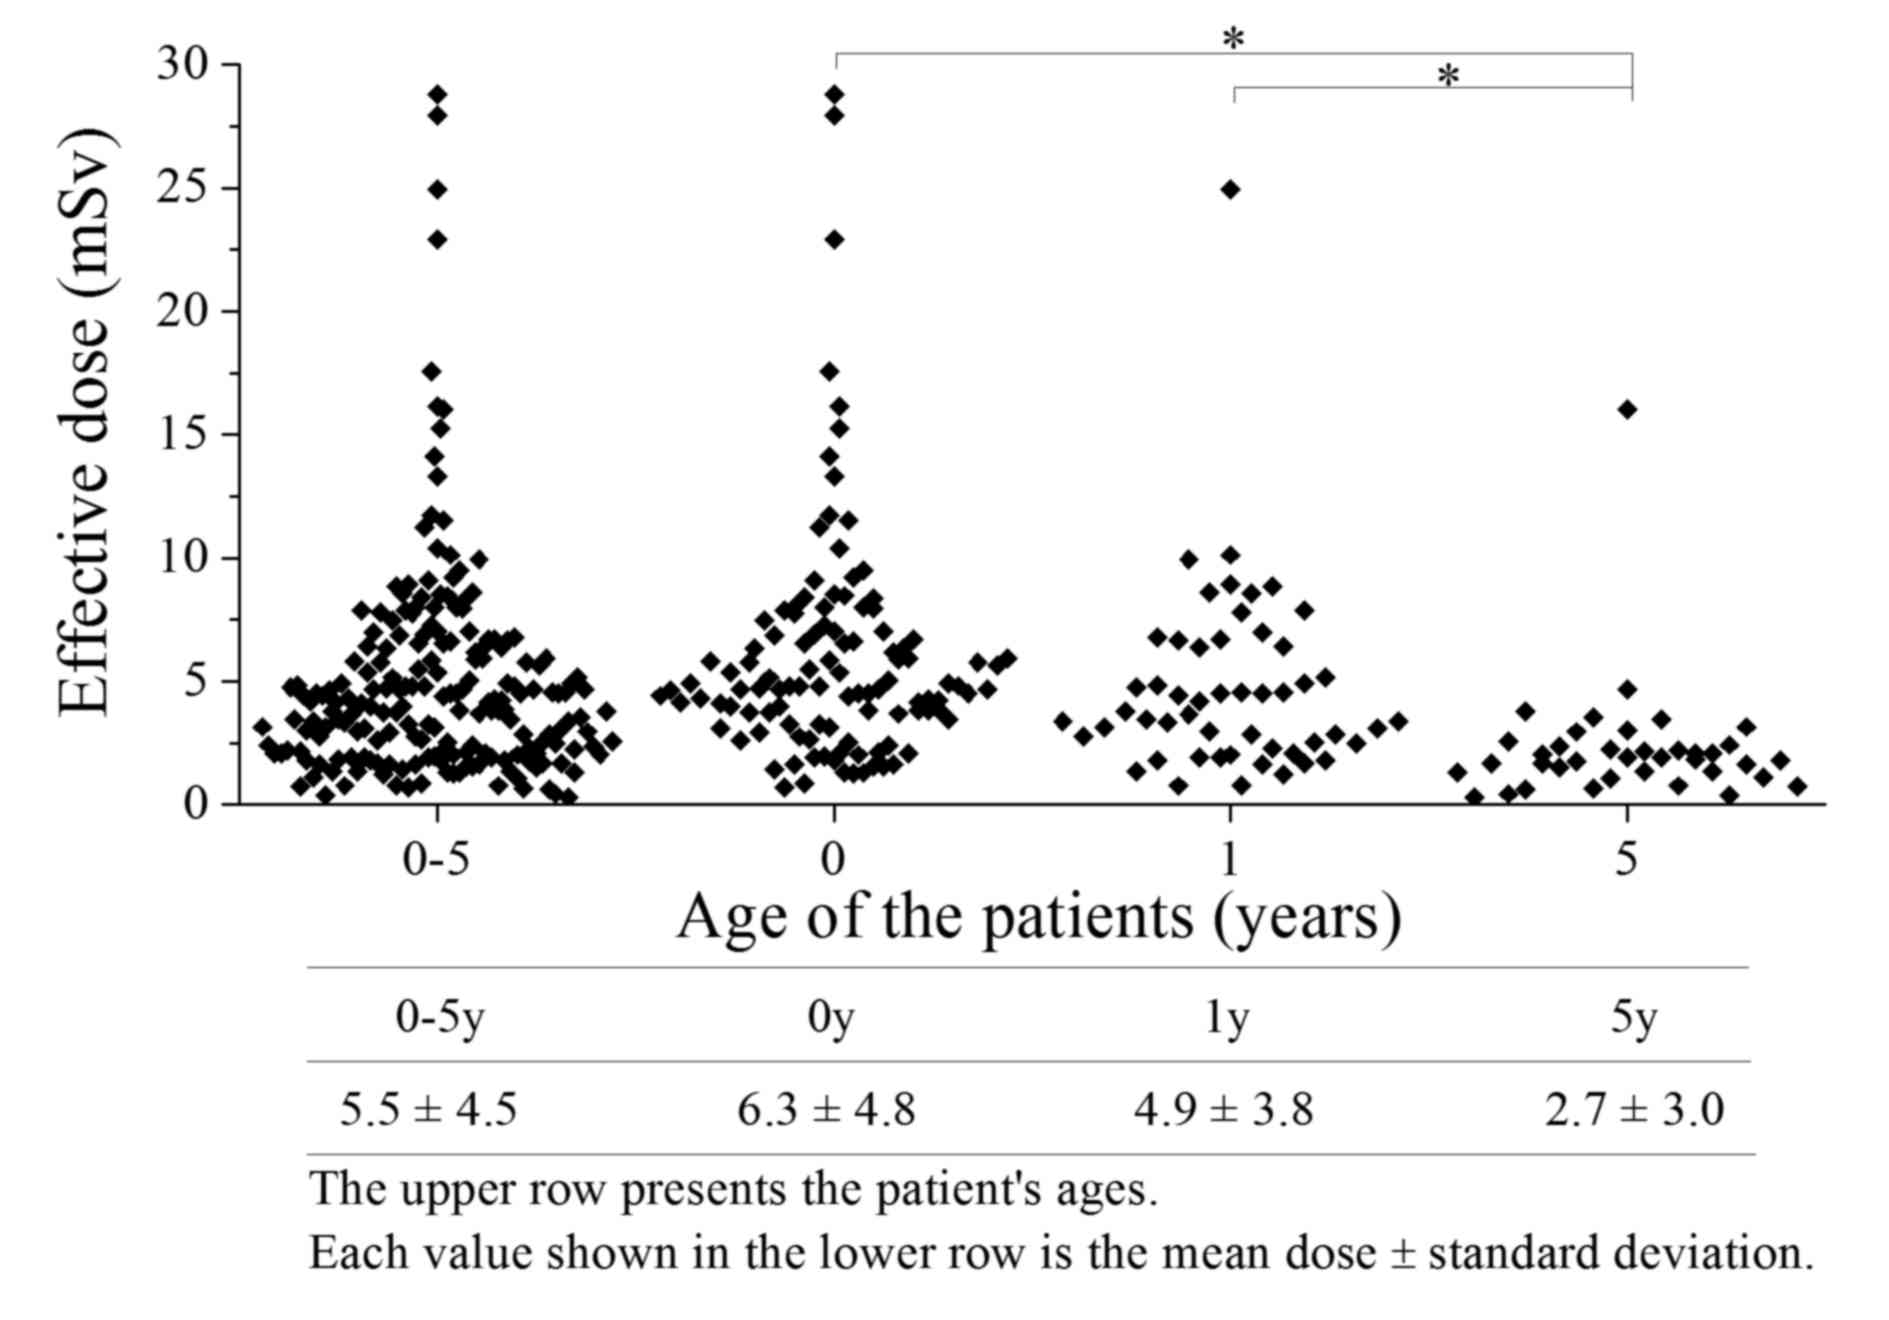
using the Discovery CT 750HD. The effective doses incurred by
children aged 0–5 years are demonstrated in Fig. 2, and the number of examinations are
presented in Table IV. The
effective dose distribution per examination at each age ranged from
0.66–28.8 mSv, with a mean ± standard deviation of 5.5±4.5 mSv.
Patients with 0.66 mSv of exposure underwent only plain imaging
from the neck to chest. In contrast, patients who received an
estimated exposure of 28.8 mSv underwent both plain and contrast
imaging from the head to pelvis. In the present study, the
effective doses at each age ranged from 2.7±3.0 mSv (5 years group)
to 6.3±4.8 mSv (0 years group). The effective doses received by
5-year-old patients differed significantly from those of the other
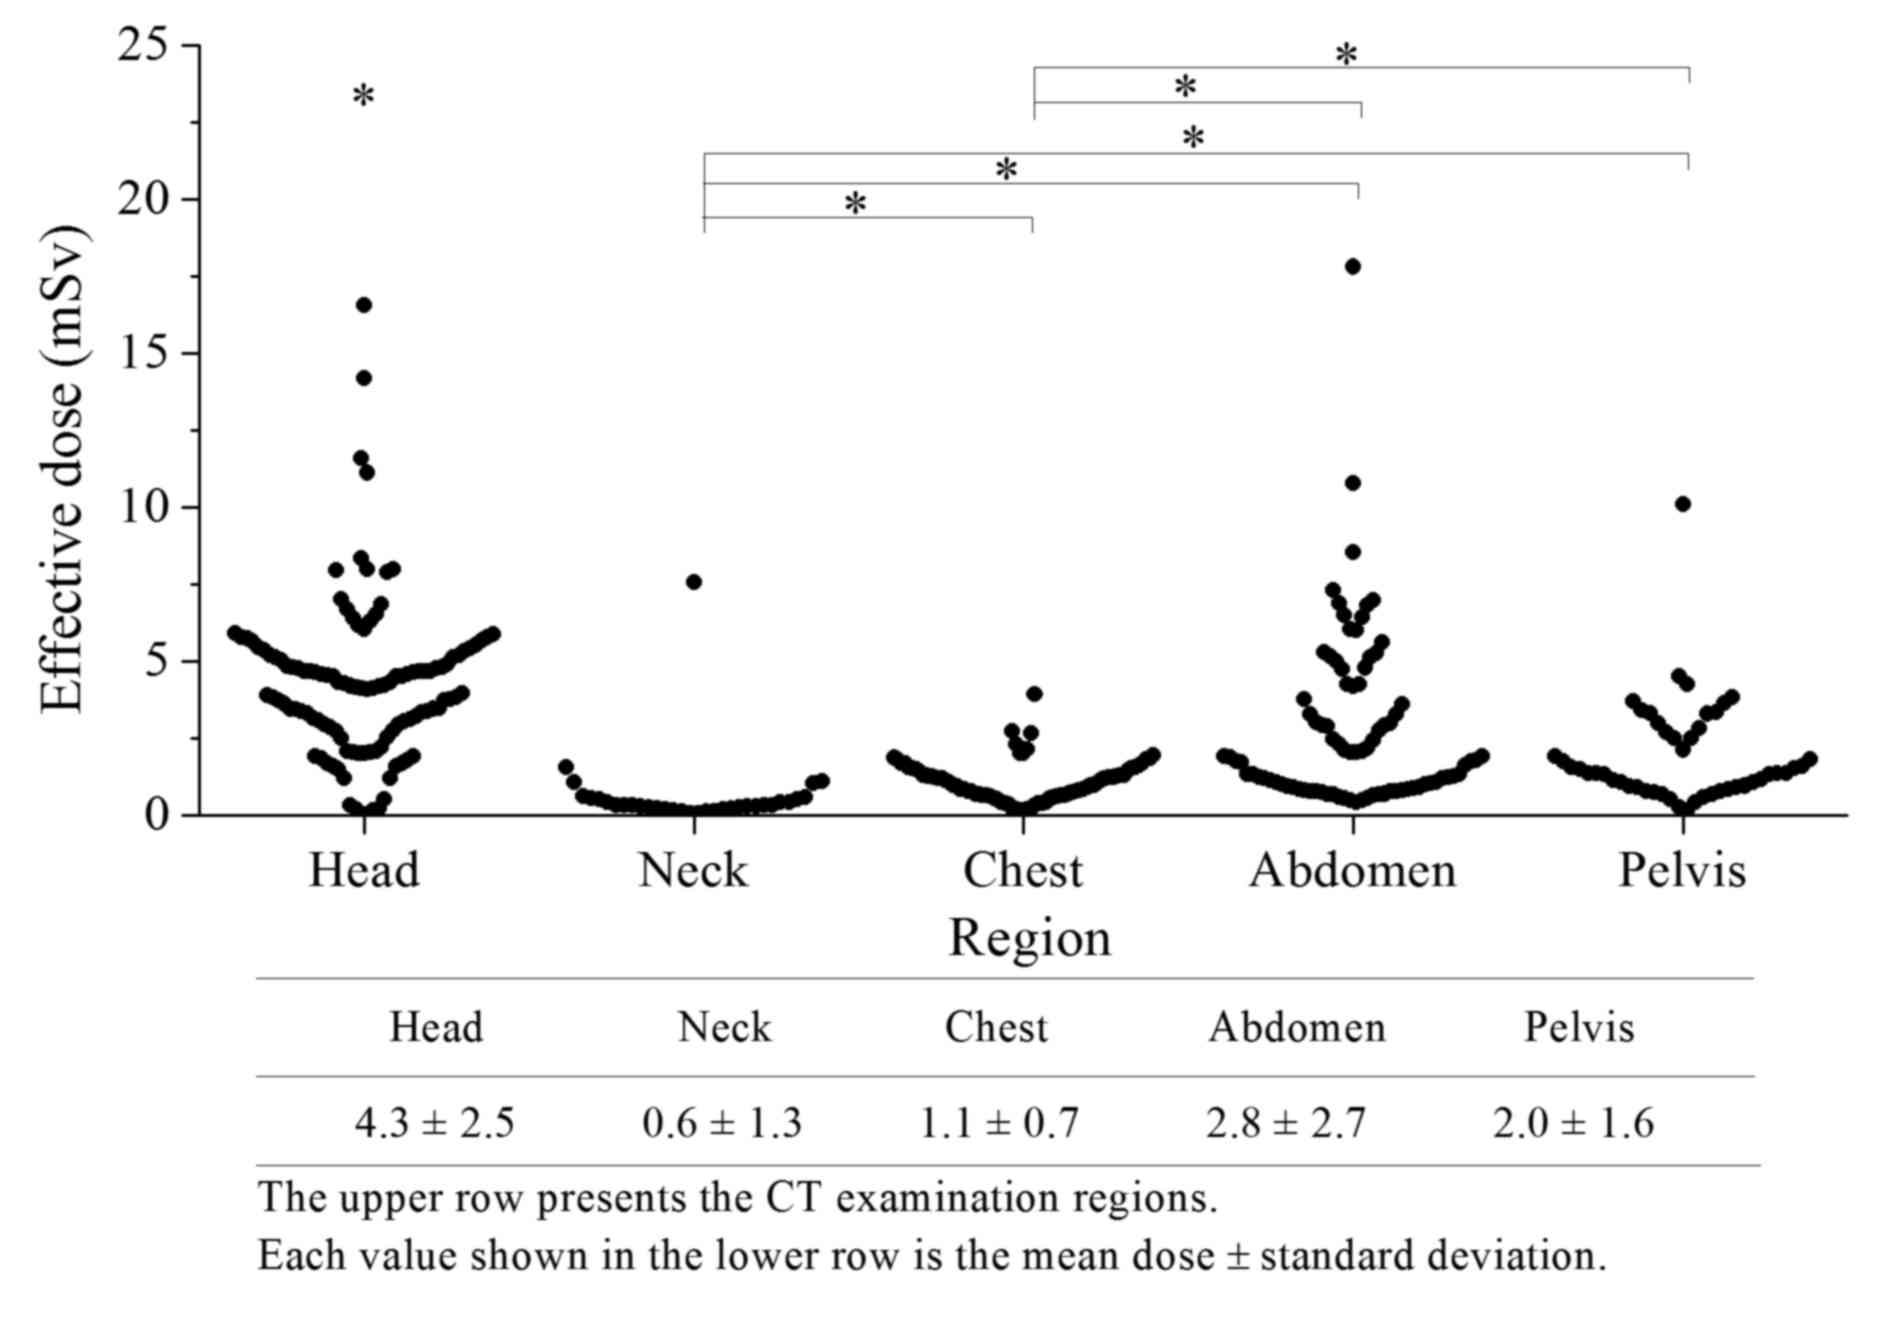
age groups (P<0.01). Subsequently, the effective doses in each
region were compared in each age group. In Fig. 3, the effective dose to the head
(4.3±2.5 mSv) was significantly higher than the doses to the neck
(0.60±1.3 mSv), chest (1.1±0.7 mSv), abdomen (2.8±2.7 mSv) and
pelvis (2.0±1.6 mSv; P<0.01). Similarly, the effective dose to
the abdomen was significantly higher than those to the neck and
chest (P<0.01). The effective dose to the neck demonstrated the
lowest value of all regions evaluated.
| Table IV.Number of computed tomography
examination regions for effective dose estimation. |
Table IV.
Number of computed tomography
examination regions for effective dose estimation.
|
|
| Region, n |
|
|---|
|
|
|
|
|
|---|
| Age, years | Number of
patients | Head | Neck | Chest | Abdomen | Pelvis | Total regions |
|---|
| 0 | 104 | 69 | 20 | 56 | 58 | 26 |
229 |
| 1 | 48 | 32 | 8 | 16 | 23 | 17 | 96 |
| 5 | 21 | 15 | 5 | 6 | 5 | 5 | 36 |
| Total | 173 | 116 | 33 | 78 | 86 | 48 | 361 |
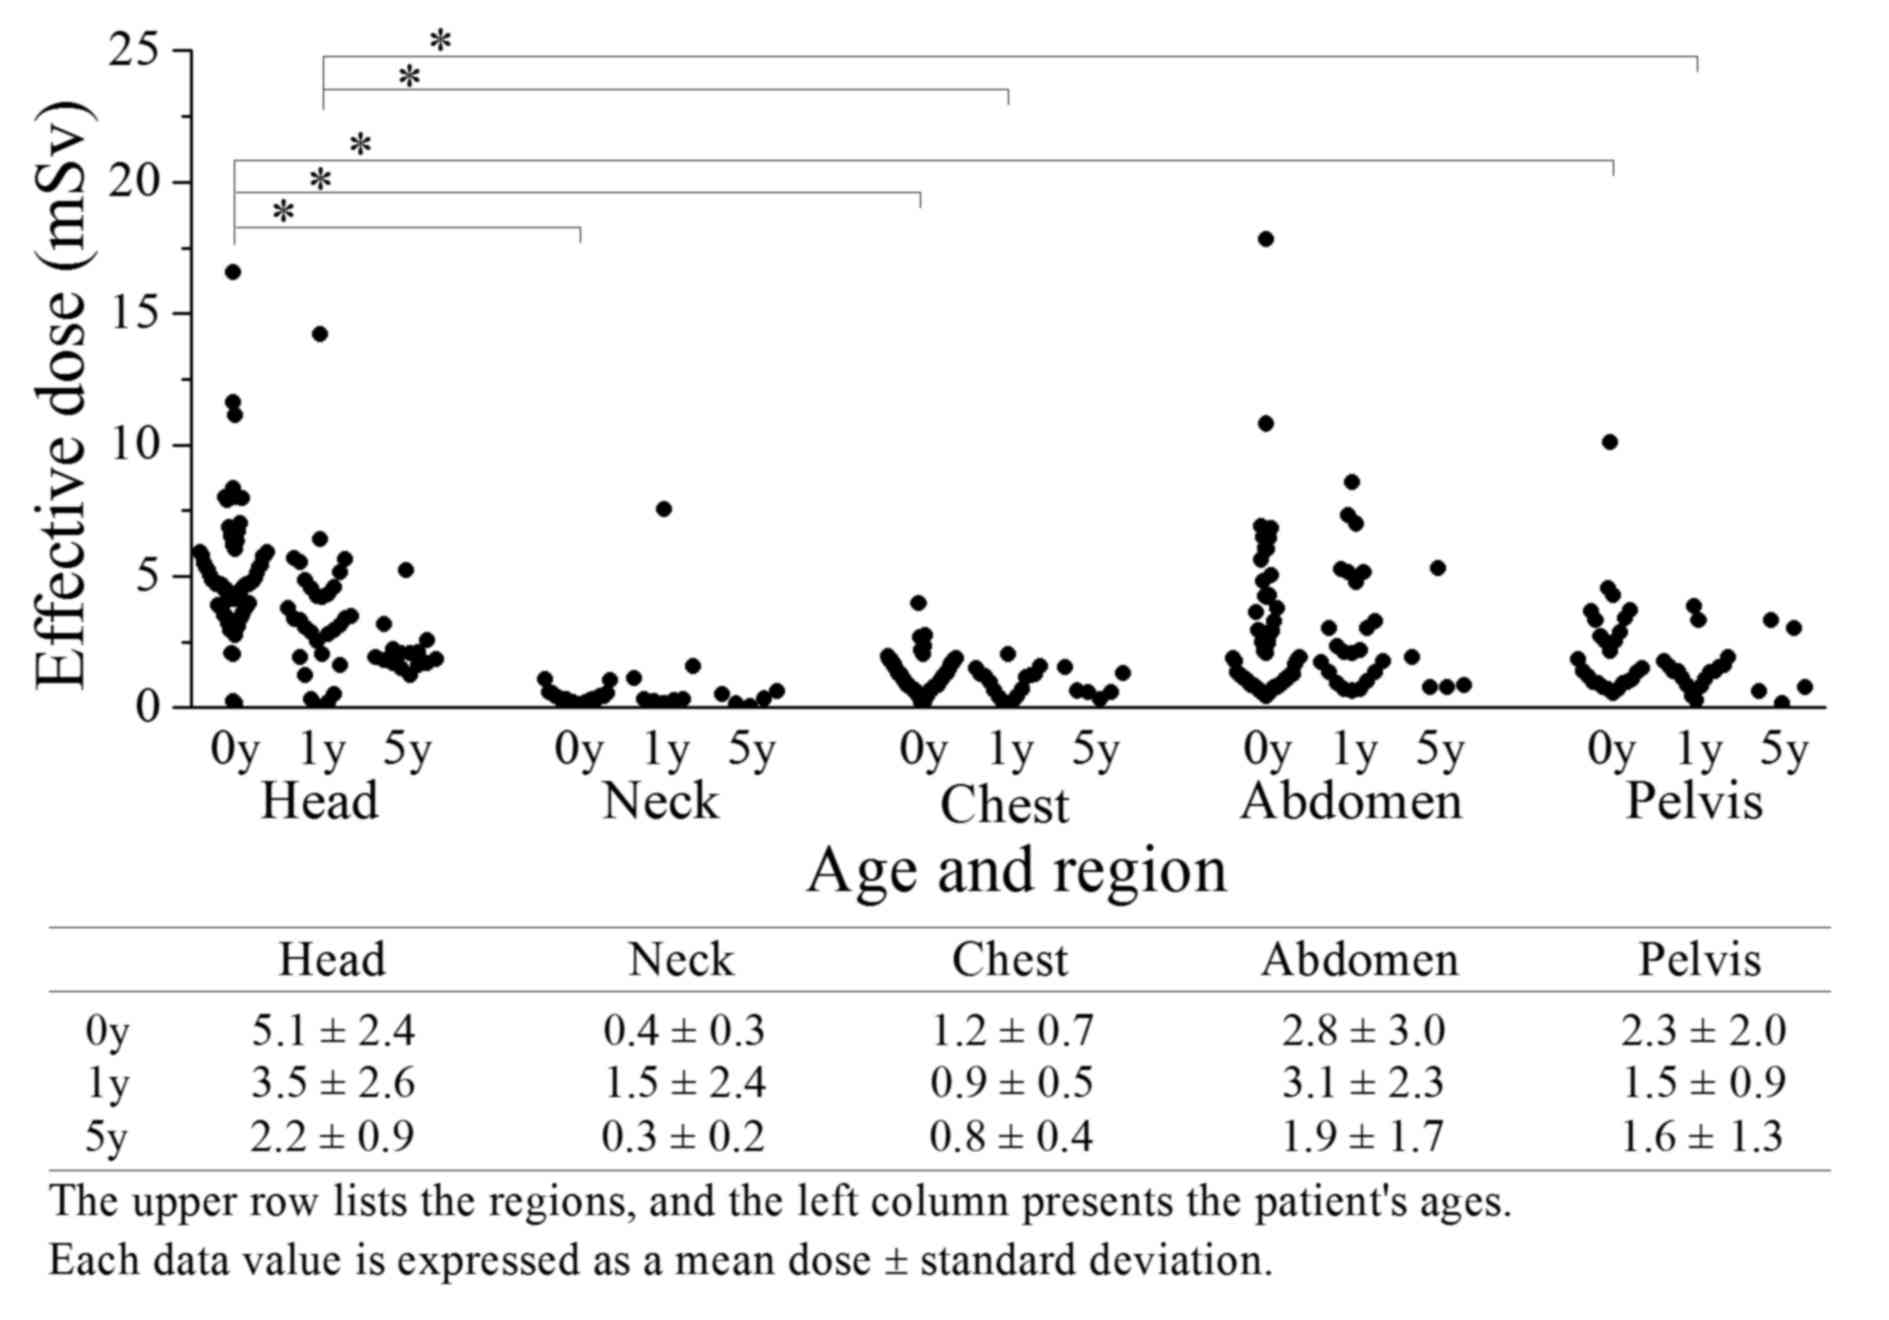
The effective doses per region in each age group are
demonstrated in Fig. 4. The dose to
each of the 5 regions differed according to the age group. In 0-
and 1-year-old children, the effective doses to the head (5.1±2.4
and 3.5±2.6 mSv, respectively) were significantly higher than those
to the neck of the 0 year group (0.40±0.26 mSv; P<0.01), chest
of the 0- and 1-year old children (1.2±0.71 and 0.94±0.54 mSv,
respectively) and pelvis of the 0- and 1-year old children (2.3±2.0
and 1.5±0.88 mSv, respectively; P<0.01). At all ages, the doses
to the neck and chest tended to be lower than those of other
regions. In the head, chest and pelvis, the conversion factors
indicated reduced values with younger ages; a similar trend was
observed for the effective doses.
Discussion
The present study aimed to clarify the actual dose
of pediatric radiation exposure incurred during CT examinations and
the effective doses to various regions, particularly in children
aged 0, 1 and 5 years, using data collected at Hirosaki University
Hospital during a 3-year period from January 2011 to December 2013.
The proportions of children aged 0–5 years among patients aged 0–15
years who were examined by CT at the Nagasaki University Hospital
(Nagasaki, Japan) in 2004 were ~9.5, 5.1, 4.9, 2.9, 4.9 and 4.5%,
respectively (12). In the present
study, the corresponding proportions were 11.1, 5.2, 2.8, 3.7, 3.9
and 4.1%, respectively. Although the target age differed, the
proportion of CT examinations in the 0-year group was significantly
higher than that in the 1–5 year groups.
The mean effective dose per examination among
children aged 0, 1 and 5 years was 5.5±4.5 mSv. Furthermore, the
estimated effective doses to the head, chest and abdomen were 4.3,
1.1 and 2.8 mSv, respectively. A study by Thomas and Wang (12) reported that an 0-year old patient
would incur mean effective doses to the head of 4.2 mSv, following
a single same-region scan in one examination, and 9.1 mSv following
two same-region scans in one examination. According to the Japanese
pediatric CT guidelines, the effective doses from the reference CT
protocol for infants were 3.4 (male) and 3.9 mSv (female) to the
chest, 8.8 (male) and 11.9 mSv (female) to the abdomen (100 kV
multiplied by 0.63) (9). In
children, the effective doses according to the reference CT
protocol were 2.1 (male) and 2.5 mSv (female) to the chest, and 7.0
(male) and 8.7 mSv (female) to the abdomen (100 kV multiplied by
0.63) (9). Previously reported doses
incurred by other age and region groups were higher than those
observed in the present study (12).
Therefore, the mean effective doses to all regions in the present
study were similar to or lower than the reference and effective
doses described in other reports.
Accordingly, in the present study, the results
varied widely across all ages and between some regions. Pediatric
CT employs a wide range of effective doses, ranging from specific
ultralow-dose protocols (<1 mSv) to the extended-coverage body
examinations often used for follow-up imaging in oncology and
detailed examinations (>810 mSv) (12). A 44-fold difference in the effective
dose was observed in the present study. Within each group, the
range of effective doses was larger than we had anticipated.
Several factors likely contributed to this discrepancy. The first
factor encompasses scan methods and ranges. The variation would
therefore result from the use of either plain or contrast imaging
alone or together, or multiple-phase imaging. Secondly,
single-region examinations affected adjacent regions in the
cranio-caudal direction, for example, a chest examination may have
also included part of the abdomen (liver, spleen, and kidney);
therefore, such cases were also counted as abdominal exposure with
respect to effective dose and number. In the present study, even
scans with small ranges were classified according to region and
were included in the calculations. Some variability in scan length
may be expected due to of operator variability, and body
examinations vary according to patient height. Such variability was
most often encountered in head CT scans, where selected axial
images were occasionally repeated if patient motion had
significantly degraded the image quality. Also, for head and neck
scans, neck images were obtained using the same scan parameters as
the head. As a result, large variation occurred in these cases.
Furthermore, each age group may include considerable ranges in
patient height and weight. Tube current with AEC was determined by
calculating the body thickness and size from positioning images.
The present study elected to include these patients in the study as
the purpose was to reflect actual situations and effective
doses.
The displayed DLP conversion factor-based
methodology used in the present study demonstrated some limitations
and issues. According to a study by Kobayashi et al
(13), effective doses estimated
using conversion factors differed from the measured doses by 20%,
even in the simplest scans. Patients who underwent coronary artery
and extremity CT evaluations were excluded from the present study
as conversion factors have not been reported for these regions
(14). Although AEC is applied to
optimize the dose to the body size, the displayed
CTDIvol would cause uncertainty by averaging the tube
current value. Therefore, it is difficult to indicate an assessed
dose that is suitable for a particular body size using the
effective doses in the present study, as these effective doses are
reference value, specifically normalized effective doses (10).
Despite these limitations, the simple approach used
in the present study to estimate the radiation exposure from CT
examinations is adequate for current data and technology (13,15). The
effectiveness of diagnostic imaging is widely and generally known,
and the number of CT scanners may be used as an index of hospital
quality (1). Compared with other
countries, Japanese patients expect higher levels of medical care
and seek treatment at hospitals owning CT scanners (1). The strength of the displayed DLP
conversion factor-based method is readily available to all
radiologists, clinicians and technologists. Furthermore, this
method may be used to contribute to pediatric CT examination and
diagnostic reference level surveys.
In Japan, no official system is responsible for the
quality control of CT examinations and patient radiation exposure
(4). In addition, it is difficult to
accurately quantify the CT risk level that would require long-term
follow-up of a majority of patients (16,17).
Reports concerning risks and CT doses have indicated a low level of
awareness and knowledge among medical staff (18,19). The
present study may allow medical staff to understand and recognize
the significance of a wide effective dose range that encompasses
specific low-dose protocols to extended-coverage body scans. In
addition, this effective dose estimation method may serve as an
important reference value that allows specific values for effective
doses to be obtained, and includes the advantage of being a
user-friendly and rapidly available method for the estimation of
pediatric CT effective doses, particularly in diagnostic facilities
without specialized equipment, application tools, and/or knowledge.
In conclusion, it is necessary to consider the requirement for a
prospective exposure management system in each patient, as well as
the estimation of each patient's low-dose radiation exposure
(20,21). The introduction of a cancer
registration according to medical exposure and a resulting medical
exposure dose management system would leave a great legacy for
future generations.
Acknowledgements
The present study was supported by Hirosaki
University Institutional Research (2012, IK).
References
|
1
|
Katada K: CT radiation exposure in Japan:
Analysis of social factors. Nihon Hoshasen Gijutsu Gakkai Zasshi.
62:649–656. 2006.(In Japanese). View Article : Google Scholar : PubMed/NCBI
|
|
2
|
The silver market phenomenonBusiness
opportunities in an Era of demographic change. Kohlbacher F and
Herstatt C: Springer; Germany: pp. 427–441. 2008
|
|
3
|
Yoshioka M, Shirayama Y, Imoto I, Hinode
D, Yanagisawa S and Takeuchi Y: Current status of collaborative
relationships between dialysis facilities and dental facilities in
Japan: Results of a nationwide survey. BMC Nephrol. 16:172015.
View Article : Google Scholar : PubMed/NCBI
|
|
4
|
Tsushima Y, Taketomi-Takahashi A, Takei H,
Otake H and Endo K: Radiation exposure from CT examinations in
Japan. BMC Med Imaging. 10:242010. View Article : Google Scholar : PubMed/NCBI
|
|
5
|
Implications of Commission recommendations
that doses be kept as low as readily achievableA report of ICRP
Committee 4 lCRP Publication 22. Pergamon Press; Oxford: pp. 2–3.
1977
|
|
6
|
Brenner D, Elliston C, Hall E and Berdon
W: Estimated risks of radiation-induced fatal cancer from pediatric
CT. AJR Am J Roentgenol. 176:289–296. 2001. View Article : Google Scholar : PubMed/NCBI
|
|
7
|
Krille L, Zeeb H, Jahnen A, Mildenberger
P, Seidenbusch M, Schneider K, Weisser G, Hammer G, Scholz P and
Blettner M: Computed tomographies and cancer risk in children: A
literature overview of CT practices, risk estimations and an
epidemiologic cohort study proposal. Radiat Environ Biophys.
51:103–111. 2012. View Article : Google Scholar : PubMed/NCBI
|
|
8
|
Mathews JD, Forsythe AV, Brady Z, Butler
MW, Goergen SK, Byrnes GB, Giles GG, Wallace AB, Anderson PR,
Guiver TA, et al: Cancer risk in 680,000 people exposed to computed
tomography scans in childhood or adolescence: Data linkage study of
11 million Australians. BMJ. 346:f23602013. View Article : Google Scholar : PubMed/NCBI
|
|
9
|
Japanese Radiological Society: Management
of patient dose in pediatric computed tomography. Nihon Hoshasen
Gijutsu Gakkai Zasshi. 61:493–495. 2005.(In Japanese). View Article : Google Scholar : PubMed/NCBI
|
|
10
|
Valentin J: International Commission on
Radiation Protection: Managing patient dose in multi-detector
computed tomography(MDCT). ICRP Publication 102. Ann ICRP. 37:1–79,
iii. 2007.
|
|
11
|
International Electrotechnical Commission:
Medical electrical equipment-Part 2–44: Particular requirements for
the basic safety and essential performance of X-ray equipment for
computed tomography3rd. IEC International Standard 60601-2-44: IEC.
Geneva: 2009
|
|
12
|
Thomas KE and Wang B: Age-specific
effective doses for pediatric MSCT examinations at a large
children's hospital using DLP conversion coefficients: A simple
estimation method. Pediatr Radiol. 38:645–656. 2008. View Article : Google Scholar : PubMed/NCBI
|
|
13
|
Kobayashi M, Ootsuka T and Suzuki S:
Evaluation and examination of accuracy for the conversion factors
of effective dose per dose-length product. Nihon Hoshasen Gijutsu
Gakkai Zasshi. 69:19–27. 2013.(In Japanese). View Article : Google Scholar : PubMed/NCBI
|
|
14
|
Ghotbi N, Ohtsuru A, Ogawa Y, Morishita M,
Norimatsu N, Namba H, Moriuchi H, Uetani M and Yamashita S:
Pediatric CT scan usage in Japan: Results of a hospital survey.
Radiat Med. 24:560–567. 2006. View Article : Google Scholar : PubMed/NCBI
|
|
15
|
Brady Z, Cain TM and Johnston PN:
Justifying referrals for paediatric CT. Med J Aust. 197:95–99.
2012. View Article : Google Scholar : PubMed/NCBI
|
|
16
|
de González Berrington A, Mahesh M, Kim
KP, Bhargavan M, Lewis R, Mettler F and Land C: Projected cancer
risks from computed tomographic scans performed in the United
States in 2007. Arch Intern Med. 169:2071–2077. 2009. View Article : Google Scholar : PubMed/NCBI
|
|
17
|
Preston RJ, Boice JD Jr, Brill AB,
Chakraborty R, Conolly R, Hoffman FO, Hornung RW, Kocher DC, Land
CE, Shore RE and Woloschak GE: Uncertainti in estimating health
risks associated with exposure to ionising radiation. J Radiol
Prot. 33:573–588. 2013. View Article : Google Scholar : PubMed/NCBI
|
|
18
|
Merzenich H, Krille L, Hammer G, Kaiser M,
Yamashita S and Zeeb H: Paediatric CT scan usage and referrals of
children to computed tomography in Germany-a cross-sectional survey
of medical practice and awareness of radiation related health risks
among physicians. BMC Health Serv Res. 12:472012. View Article : Google Scholar : PubMed/NCBI
|
|
19
|
Brown N and Jones L: Knowledge of medical
imaging radiation dose and risk among doctors. J Med Imaging Radiat
Oncol. 57:8–14. 2013. View Article : Google Scholar : PubMed/NCBI
|
|
20
|
Eisenberg MJ, Afilalo J, Lawler PR,
Abrahamowicz M, Richard H and Pilote L: Cancer risk related to
low-dose ionizing radiation from cardiac imaging in patients after
acute myocardial infarction. CMAJ. 183:430–436. 2011. View Article : Google Scholar : PubMed/NCBI
|
|
21
|
Hiromitsu O: Health risk assessment of
exposure to ionizing radiation. J Natl-Inst-Public Health.
60:326–631. 2011.
|