Introduction
Cerebral small vessel disease (CSVD) predominantly
affects the perforating cerebral arterioles and capillaries, and
results in injury to subcortical grey and white matter (1). CSVD is associated with focal motor
deficits, stroke and cognitive decline, which typically progresses
to dementia (2). Genetic studies of
CSVD indicate that the development and progression of the disease
can be attributed to the accumulation of genomic changes (3). Gene expression profiling has been
widely used to research the pathogenesis of diseases, including
CSVD. However, despite advances in our knowledge of the genetic
basis of CSVD, the underlying molecular mechanisms of the
development and progression of CSVD remain unclear.
Pathway analysis is a useful tool for gaining
insight into the biological functions of genes and proteins
(4). Given the complex nature of
biological systems, signaling pathways are typically required in
order for systems to function in a coordinated fashion to produce
the appropriate physiological responses to internal and external
stimuli (5). However, previous
studies have focused on identifying altered signaling pathways
between normal and diseased groups, and common genes between
different signaling pathways. For example, a previous study
identified differential interactions between two signaling pathways
across diseased and normal samples (6). Network-based methods have been used to
analyze this interaction data and gain insights into the underlying
molecular mechanisms by which biological systems operate (7). Sun et al (8) introduced a network-based approach,
differential expression network analysis, which reflects phenotypic
differences at a network level. Similarly, in the present study, a
differential pathway network was constructed to conduct analysis on
the pathogenesis of CSVD, in which nodes represented signaling
pathways. In this way, CSVD was analyzed at a signaling pathway
network level.
In the present study, this differential pathway
network analysis method was applied to identify key signaling
pathways associated with CSVD. CSVD data, including gene expression
profiles, protein-protein interactions (PPIs) and signaling
pathways, were identified and preprocessed. Differential pathway
interactions in CSVD were identified using the Spearman's
correlation coefficient (SCC) strategy and a differential pathway
network was constructed. Topological analysis of the differential
pathway network was performed to identify hub pathways, which
revealed 15 hub pathways with a top 5% degree distribution. The
results of the present study may aid in the identification of
potential biomarkers for the early diagnosis and treatment of CSVD,
and provide novel insights into the pathological mechanism
underlying this disease.
Materials and methods
Gene expression data recruitment and
preprocessing
Gene expression profiles from CSVD samples
(accession no. E-MTAB-3408) (9) were
downloaded using the ArrayExpress database (http://www.ebi.ac.uk/arrayexpress). The E-MTAB-3408
dataset was collected using the A-AFFY-14 Affymetrix GeneChip™
Human Gene 1.0 ST Array (Thermo Fisher Scientific, Inc., Waltham,
MA, USA). The data were obtained from 15 CSVD samples and 15 normal
controls.
The oligo package (version 1.14.0) (10) for R software was used to read the
data. The robust multiarray average algorithm was applied to
conduct background subtraction (11). Quantile normalization and
summarization were performed using the median polish procedure, and
the data were filtered using the varFilter function in R software
(12). Subsequently, all of the gene
annotation files were downloaded and all probes were mapped onto
the genes. A total of 5,786 genes were contained in the expression
profile.
PPI data recruitment and
preprocessing
Global PPIs were obtained from the Search Tool of
the Retrieval of Interacting Genes/Proteins database (http://string-db.org). Currently, this database covers
932,553,897 total interactions from 2,031 organisms. Here only
human PPIs were retrieved, including a total of 787,896
interactions after removing self-loops and duplicated interactions.
The gene expression profile was mapped onto the global PPI network
and these intersections were selected to construct a novel PPI
network, which was regarded as the background PPI network. In this
case, a background PPI network with 89,574 interactions covering
4,971 nodes was constructed.
Signaling pathway data identification
and preprocessing
All human signaling pathways were downloaded from
the Reactome pathway database (http://www.reactome.org), and a total of 1,675
pathways were obtained. Pathways with too many genes may be
considered too complex analysis, while pathways with too few genes
may not have sufficient biological content (13). Thus, to enhance the confidence and
stability of the signaling pathways identified, the number of
common genes between each pathway and the background PPI network
was calculated, and pathways with common gene size >100 or <5
were discarded. Following this, a total of 706 signaling pathways
were obtained for further analysis.
Identifying differential interactions
between signaling pathways
To evaluate interactions between signaling pathways,
gene interactions were constructed randomly and then evaluated. In
addition, these pathway genes were mapped onto the background PPI
network. In this way, interactions between signaling pathways were
constructed. In order to describe the strengths of signaling
pathway interactions, the SCC method (14) was utilized to rank pairwise
interactions between the CSVD samples and normal controls. The SCC
absolute difference value of a pathway interaction between CSVD and
normal samples was defined as the weight value of this pathway
interaction.
For example, in pathway 1, genes in pathways 1 and 2
were used to construct gene interactions and these interactions
were integrated with the background PPI network. All gene
intersections were considered to be interactions of pathways 1 and
2. Subsequently, the pathway intersections between CSVD and normal
samples were weighted by SCC, respectively. The SCC of a pair of
gene interactions (a and b), was defined as:
SCC(a,b)=1n–1∑i=1n(g(a,i)–g¯(a)σ(a))·(g(b,i)–g¯(b)σ(b))
Where n was the number of gene interactions,
g(a, i) or g(b, i) was
the expression level of gene a or b in the pathway,
i indicated a specific condition (CSVD or normal),
g(a) and g(b) represented the mean
expression level of gene a or b, respectively, and
σ(a) and σ(b) represented the standard deviation of
the expression level of genes a and b.
The absolute SCC difference of a gene interaction
between CSVD and normal conditions was calculated, and the mean
value of the absolute SCC differences of all gene interactions
between pathways 1 and 2 was defined as the weight value. If there
was no intersection between pathway 1 and 2, this indicated that
there was no interaction between the two pathways. Similarly, gene
interactions were constructed based on genes in pathways 1 and 3,
and the method used to explore interactions and the weight value
between the pathways was the same as described above. By such
analogy, all of the interactions and weight values between any two
pathways were obtained.
Differential pathway network
construction
Once all pathway interactions and weight values were
obtained, the weight values were set in descending order and
pathway interactions with weight values >0.95 were considered as
differential interactions. These differential interactions were
selected to construct a differential pathway network, which was
visualized using Cytoscape software (version 2.8) (15).
Centrality analysis
To further investigate the significance of signaling
pathways in the differential pathway network, the biological
importance of pathways was characterized using indices of
centrality. Centrality analysis is a network analysis method to
investigate biological networks, including gene regulatory, protein
interaction and metabolic networks, in order to identify important
elements of a network (16,17). Degree centrality is a simple local
centrality measure, which is based on the notion of neighborhood.
The degree is useful in statistical graphs to identify vertices
that have the most direct connections to other vertices (18). In the present study, the nodes
indicated the signaling pathways and the edges indicated the
interactions between signaling pathways. The connectivity degree of
a signaling pathway was quantified by considering the pathway as a
node and the number of adjacent pathways as the degree value. The
pathways whose degree values were at the top 5% of the degree
distribution (≥95% quantile) in the network were defined as hub
signaling pathways.
Network clustering
Genes and signaling pathways that are involved in a
similar function are frequently coexpressed or activated,
respectively, which establishes conserved transcription modules
(19). These modules are groups of
genes or pathways whose expression profiles or activations,
respectively, are highly correlated across samples (20). In the present study, the signaling
pathways in the differential pathway network were clustered using
ClusterONE (version 1.0) plugin for Cytoscape, which uses a
cohesiveness measurement to determine the likelihood of an overlap
between a group of proteins or pathways in a complex is based on
the weight of interactions within the group and with the rest of
the network (21). During module
searching, the three primary parameters were as follows: Module
size, weighted density and overlap threshold. In the present study,
pathway modules were selected under the thresholds of a module size
≥20, a weighted density ≥0.1 and an overlap threshold ≥0.5.
Results
Pathway network construction
In the present study, microarray data from CSVD
samples was combined with human PPI and signaling pathway data to
identify differential pathway interactions using the SCC strategy.
Pathways whose gene set size was >100 or <5 were discarded,
leaving a total of 706 pathways for further analysis. Once these
pathways were intersected with background PPI data, the pathway
interactions were screened to construct a pathway network. The
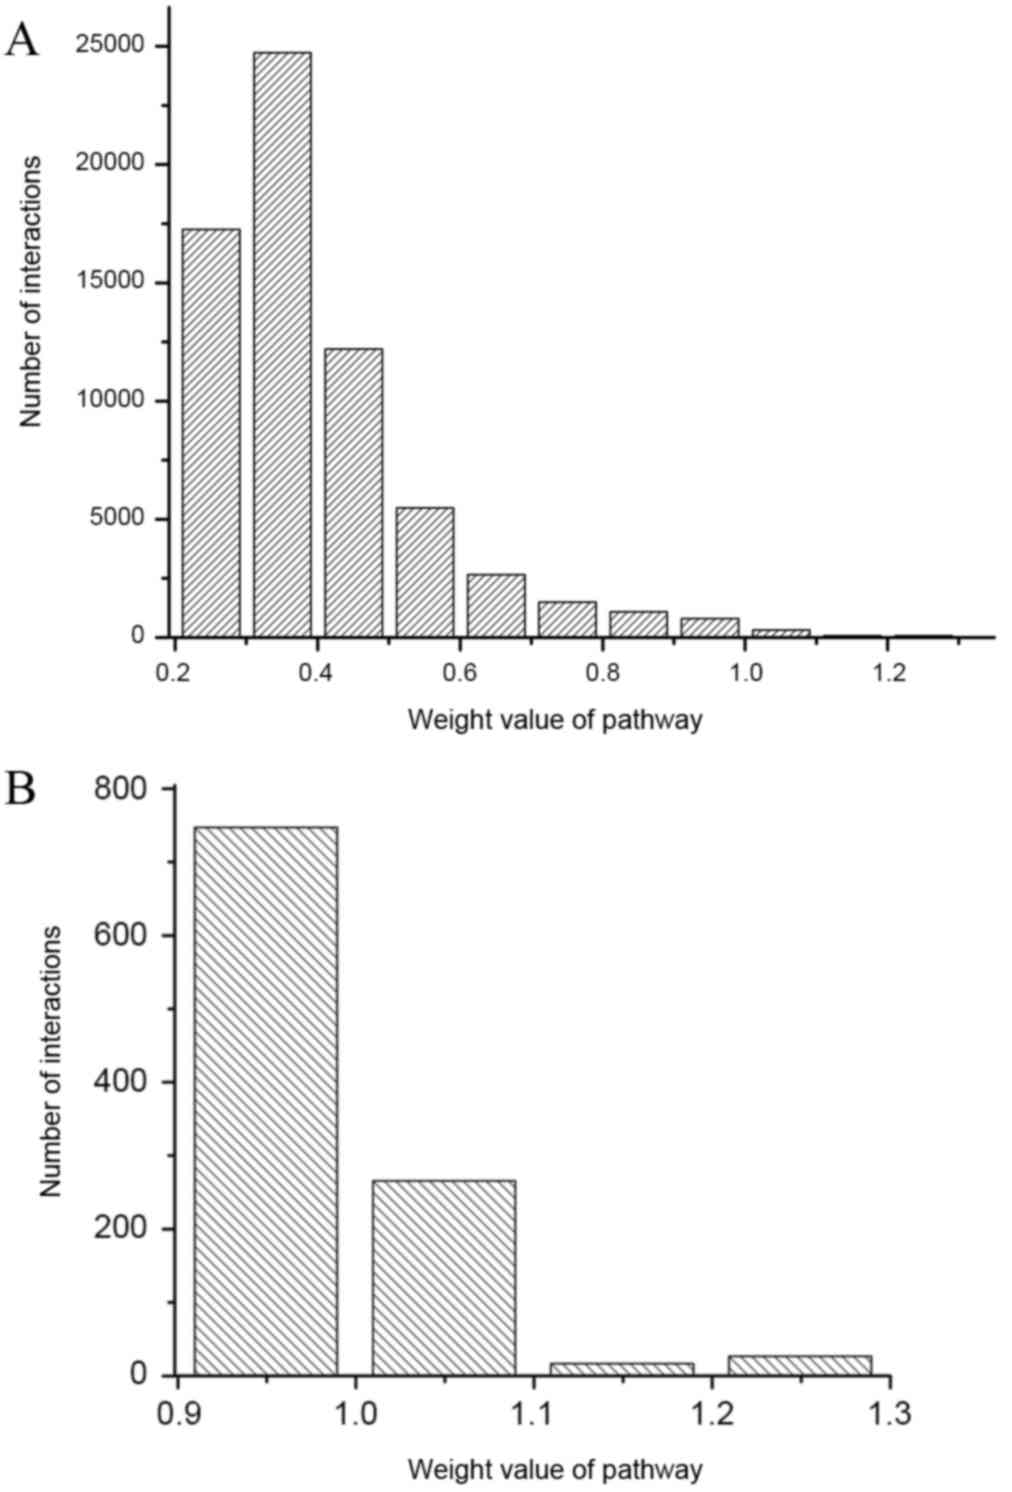
results demonstrated that these 706 pathways formed 188,420 pathway
interactions in total. The distribution of weight values are
demonstrated in Fig. 1. It was
identified that the weight values of the interactions ranged from
0.2–1.3, and that the majority of interactions ranged between 0.2
and 0.5. Because small weight values indicated small differences in
pathway interactions between disease and normal conditions, pathway
interactions with weight values of >0.95 were selected to
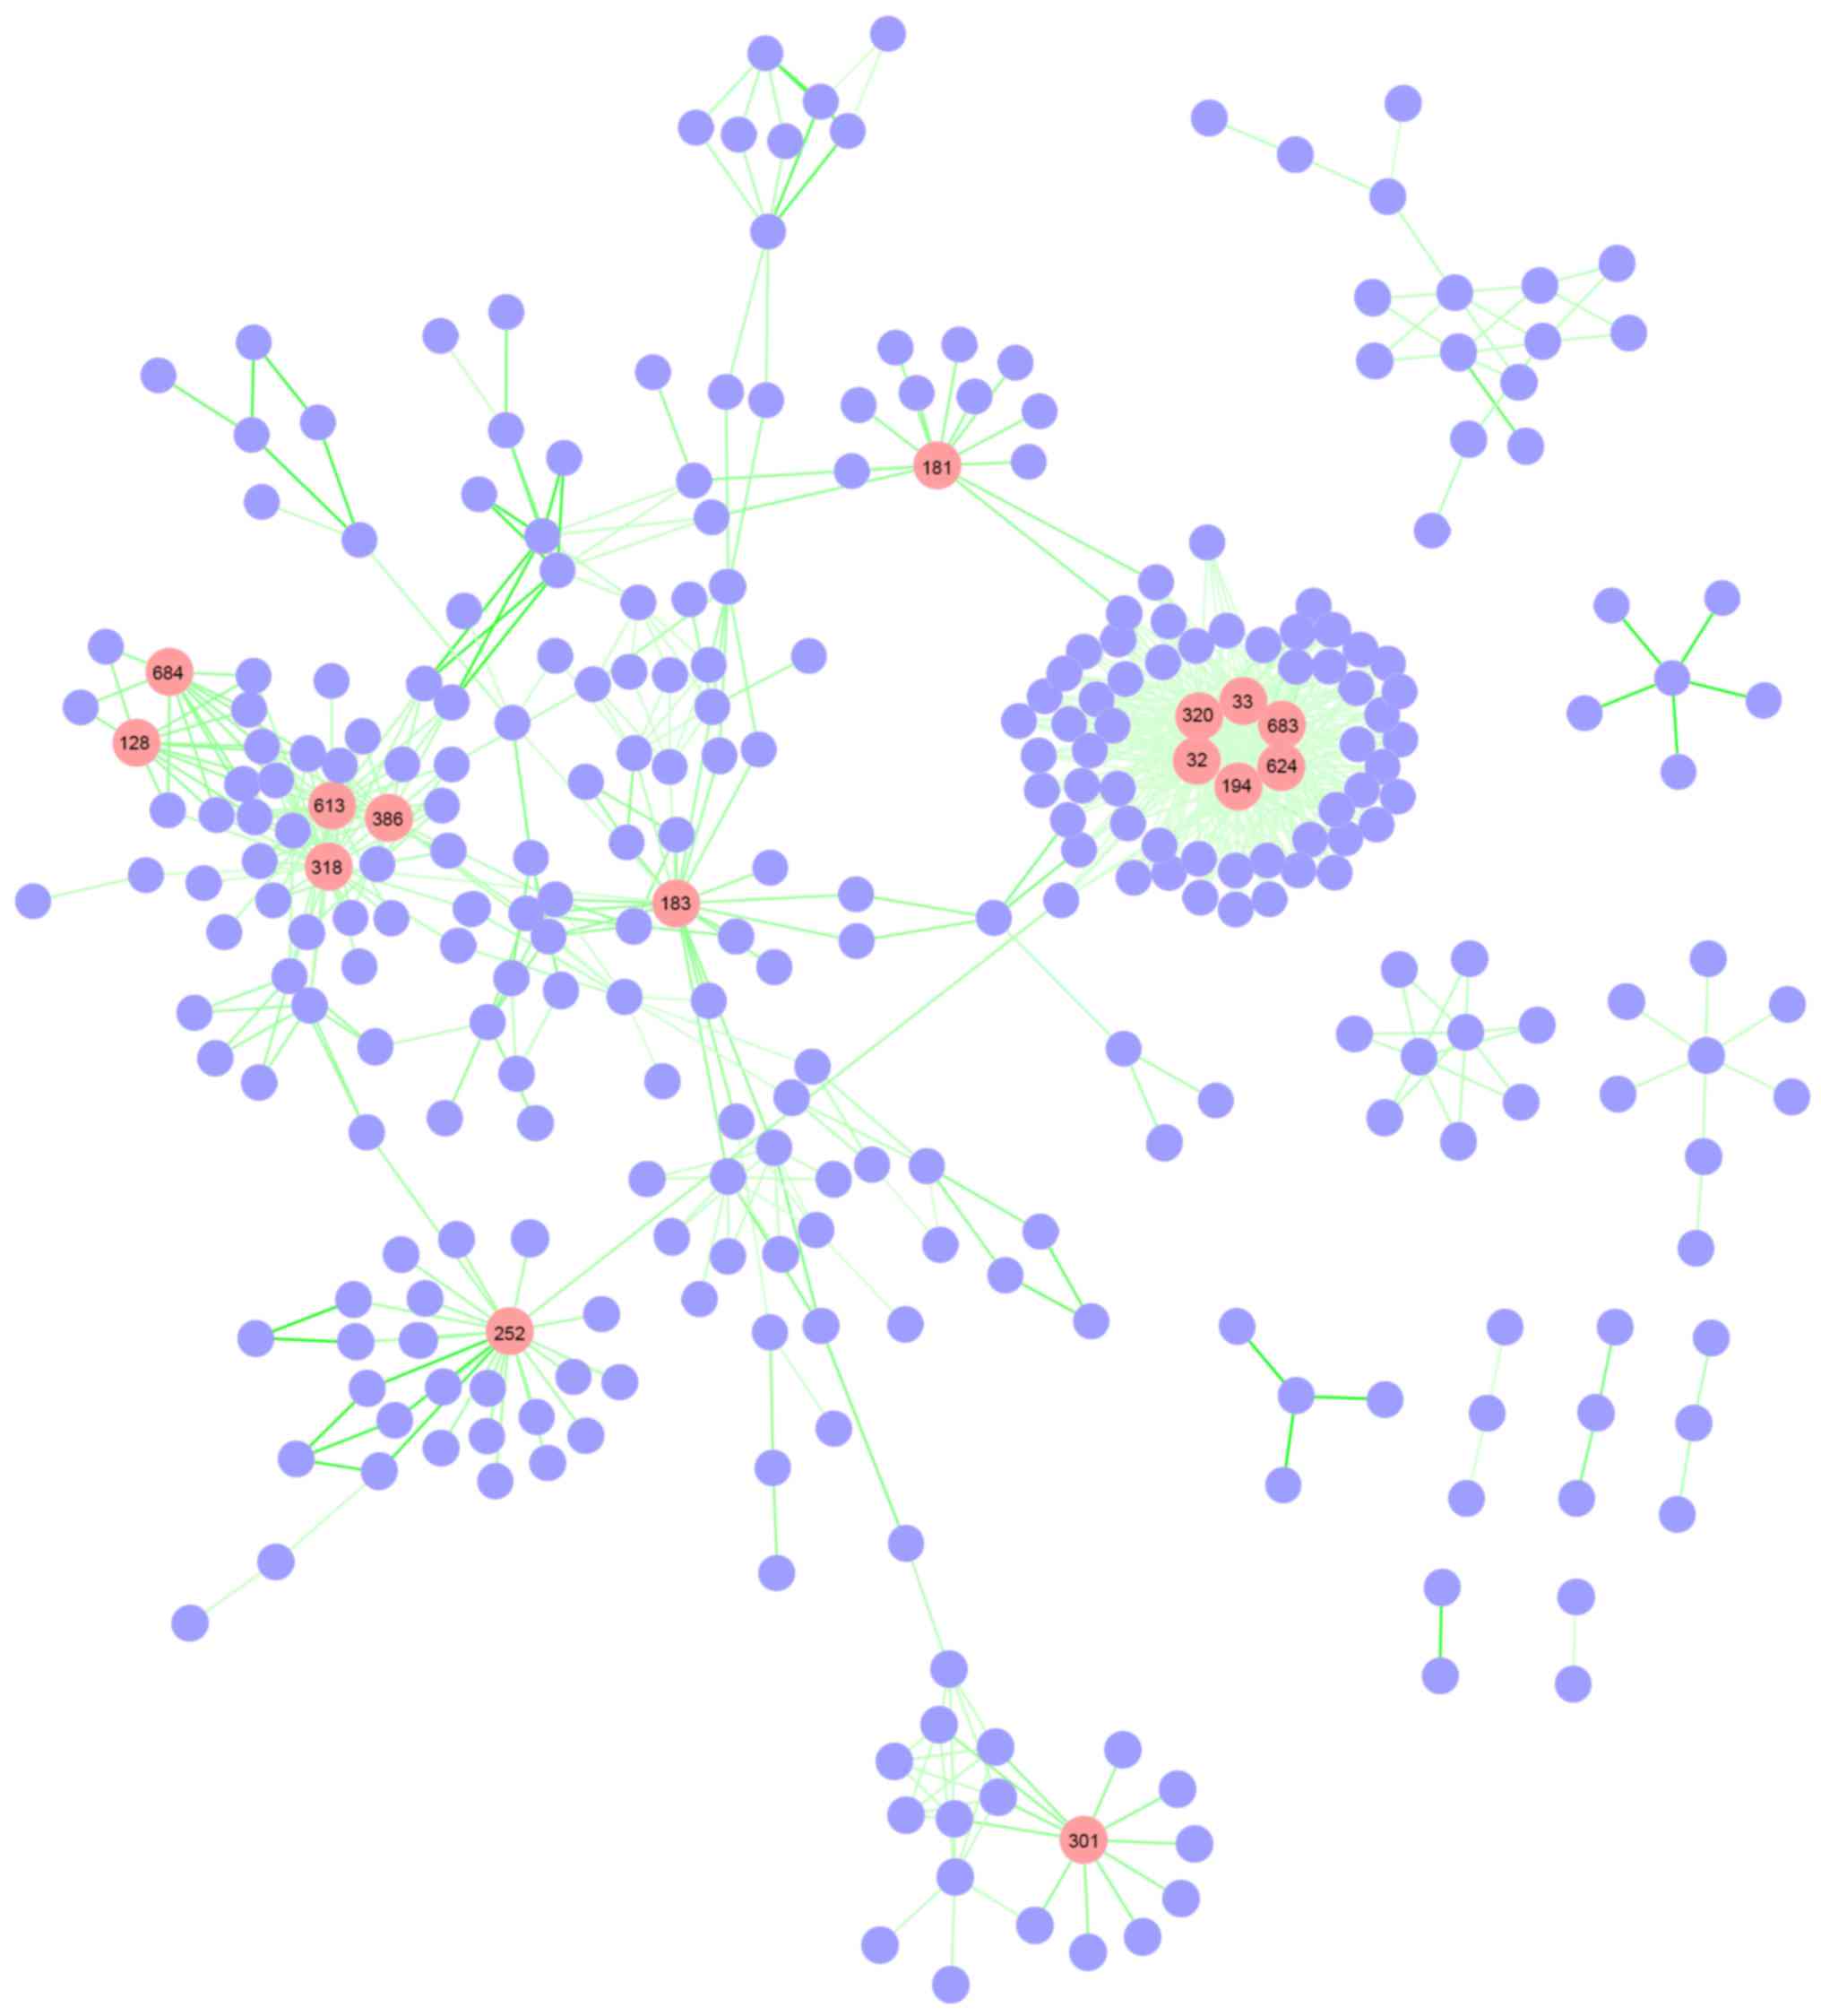
construct the differential pathway network. The differential
pathway network constructed included 715 differential pathway
interactions and 312 pathways (Fig.
2).
Centrality analysis
In order to further investigate the importance and
significance of the 312 differential pathways in the differential
pathway network, degree centrality analysis was applied to obtain
hub pathways. Using the top 5% degree distribution, a total of 15
hub pathways were identified (Fig.
2). The detailed degrees for the 15 hub pathways are listed in
Table I. Notably, signaling pathways
for fatty acyl-co-enzyme A (CoA) biosynthesis (node 194), linoleic
acid (LA) metabolism (node 320) and the synthesis of very
long-chain fatty acyl-CoAs (node 624) produced the highest
connectivity degree (degree=54). This was closely followed by
α-linolenic (omega 3) and linoleic (omega 6) acid metabolism (node
32), and α-LA (ALA) metabolism (node 33), which scored a degree of
53. These signaling pathways were all associated with the synthesis
of fatty acyl-CoA and LA metabolism, which suggests the involvement
of these metabolic processes with the development and progression
of CSVD.
 | Table I.Detailed degrees of the identified
hub pathways. |
Table I.
Detailed degrees of the identified
hub pathways.
| Node | Pathway term | Degree |
|---|
| 194 | Fatty acyl-CoA
biosynthesis | 54 |
| 320 | Linoleic acid
metabolism | 54 |
| 624 | Synthesis of very
long-chain fatty acyl-CoAs | 54 |
| 32 | α-linolenic (omega
3) and linoleic (omega 6) acid metabolism | 53 |
| 33 | α-linolenic acid
metabolism | 53 |
| 683 | Triglyceride
biosynthesis | 48 |
| 318 | Laminin
interactions | 27 |
| 252 | Glycogen breakdown
(glycogenolysis) | 23 |
| 613 | Syndecan
interactions | 23 |
| 183 | Ephrin
signaling | 21 |
| 386 | Non-integrin
membrane-extracellular matrix interactions | 15 |
| 181 | Ephrin A-mediated
growth cone collapse | 13 |
| 128 | Cytosolic tRNA
aminoacylation | 11 |
| 301 | Intraflagellar
transport | 11 |
| 684 | tRNA
aminoacylation | 11 |
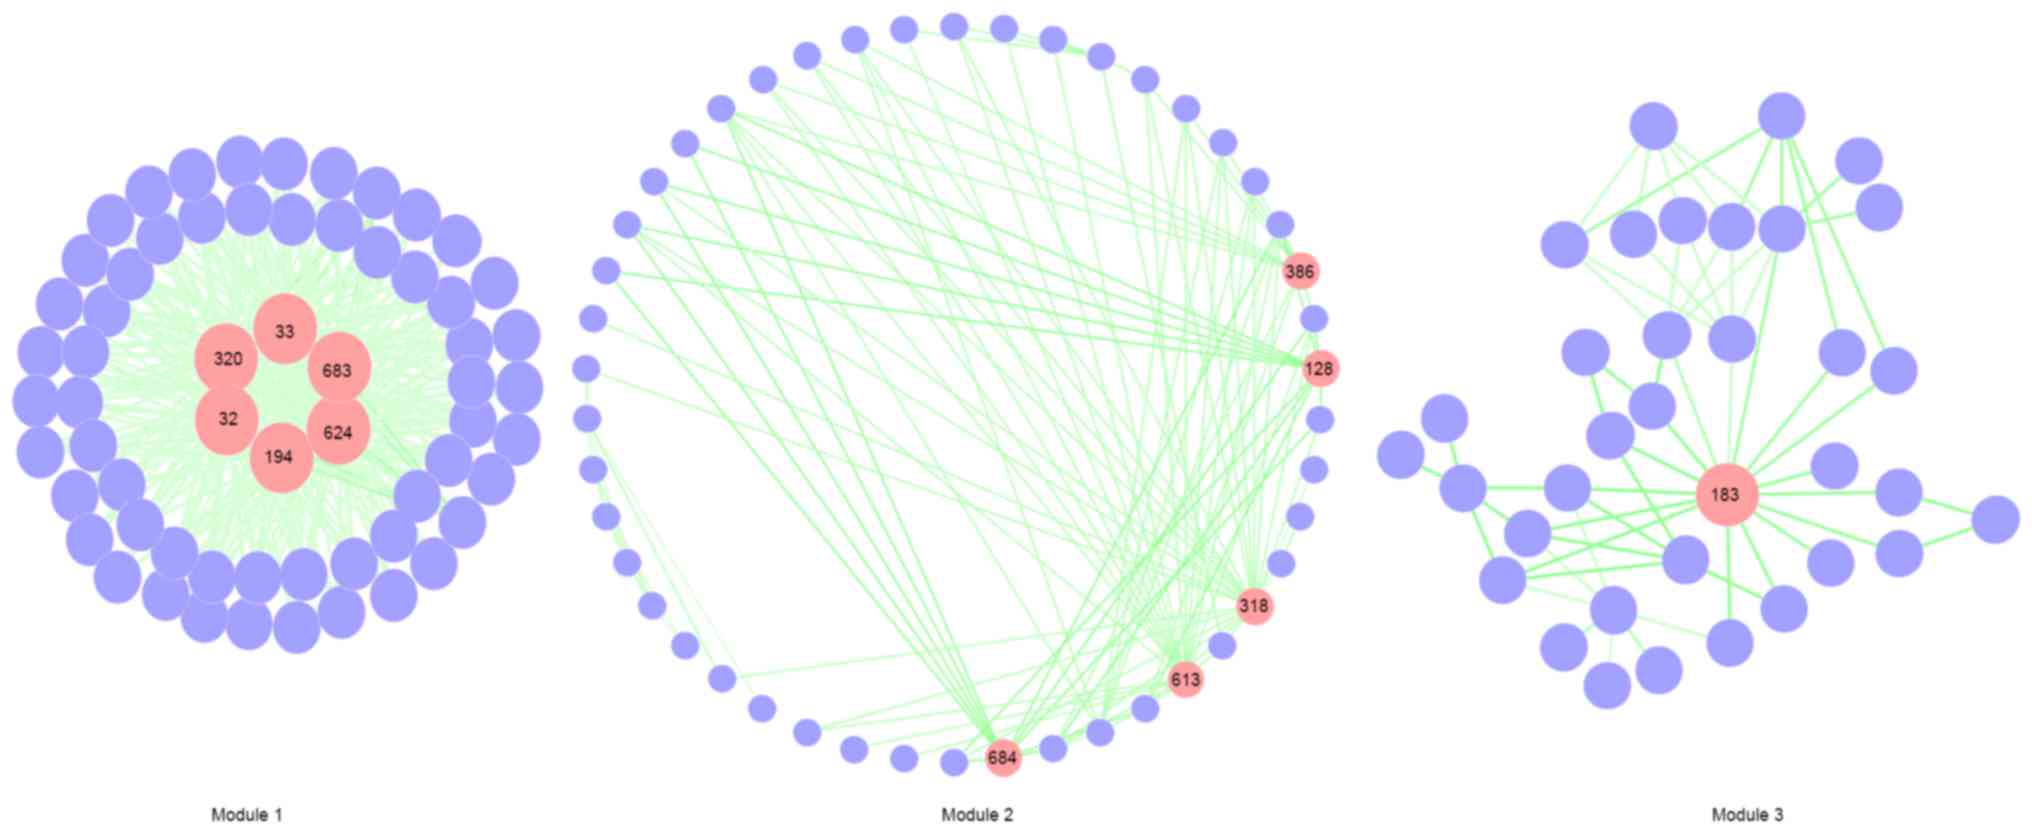
Network clustering
ClusterONE was applied to identify modules from the
differential pathway network that were involved in similar
biological processes and thus had similar functions. After applying
the thresholds for module size (≥20), weighted density (≥0.1) and
the overlap threshold (≥0.5), 3 pathway modules were identified
(Fig. 3). There were 6, 5 and 1 hub
pathways indicated in modules 1, 2 and 3, respectively. The 6 hub
pathways with the highest degree scores were all clustered in
module 1, indicating that module 1 serves an important role in
CSVD. As shown in Fig. 3, the 6 hub
pathways in module 1 were fatty acyl-CoA biosynthesis (node 194,
degree=54), LA metabolism (node 320, degree=54), synthesis of very
long-chain fatty acyl-CoAs (node 624, degree=54), α-linolenic
(omega3) and linoleic (omega6) acid metabolism (node 32,
degree=53), ALA metabolism (node 33, degree=53), and triglyceride
biosynthesis (node 683, degree=48).
Discussion
High-throughput biological experiments that probe
various genes simultaneously have generated unprecedented amounts
of data. Candidate diagnostic and prognostic biomarkers are
typically the most significant differentially expressed genes
(DEGs) between the control and disease samples (22–24).
However, the most significant DEGs obtained from different studies
for a particular disease are frequently different (25). The cross validation of datasets,
including via network-based methods, reduces false findings and
increases the sensitivity of the identification of significant DEGs
(26). Furthermore, pathway networks
provide insight into the potential underlying molecular mechanisms
of disease (27). Therefore, in the
present study, differential pathway network analysis was used to
identify hub signaling pathways in CSVD. The differential pathway
network was composed of differential pathway interactions using
background PPIs, the Reactome pathway database and a gene
expression profile dataset. In addition, modules within the
differential pathway network were identified using ClusterONE.
The results of the present study revealed that there
were 15 hub pathways associated with CSVD, and that the top hits
were associated with the synthesis of fatty acyl-CoA and
LA-associated metabolism, which indicates that these processes
contribute to the development and progression of CSVD. In addition,
network clustering analysis indicated that the top 5 hub pathways
were all within module 1, which suggests that these pathways
exerted their role in the development and progression of CSVD in a
cooperative way.
Fatty acids are a family of molecules within the
lipid macronutrient class (28). A
previous study indicated that saturated fatty acids and trans-fatty
acids are particularly harmful to blood vessels and that omega 3
fatty acids are considered good fats (29). Long-chain acyl-CoA esters serve as
important intermediates in lipid biosynthesis and fatty acid
degradation. Bortz and Lynen (30)
proposed that acyl-CoA esters are key regulators of fatty acid
synthesis, and that long-chain acyl-CoA esters affect a large
number of cellular systems and functions, including ion channels,
ion pumps, enzyme activity, membrane fusion and gene regulation.
Polyunsaturated fatty acids (PUFAs), particularly ALAs, have a
protective function against focal and global ischemia (31,32). The
ratio of membrane omega 3 to omega 6 PUFAs may be modulated by
dietary intake, and this ratio influences neurotransmission and
prostaglandin formation, which are vital to the maintenance of
normal brain function (33).
Previous studies indicate that omega 3 PUFAs may influence vascular
tone by affecting membrane potential and inhibiting migration of
vascular smooth muscle cells (34)
and maintain vascular integrity by decreasing numerous soluble
markers of endothelial hemostatic activity (35). Experimental analysis of animal models
and human subjects has demonstrated that omega 3 PUFAs cause a
moderate reduction in blood pressure, indicating altered vascular
neuroeffector responses (36). In
the present study, the top 5 hub pathways were associated with the
synthesis and metabolism of fatty acids, and were clustered in
module 1. These findings suggest that the synthesis and metabolism
of fatty acids is associated with the occurrence and development of
CSVD.
To the best of our knowledge, the present study is
the first to report the analysis of CSVD using a differential
pathway network method. The present study identified several
pathways that were associated in the occurrence and development of
CSVD. However, several limitations were associated with the present
study. For example, all of the data were obtained from databases
and these data themselves may be unreliable. In addition, only a
small sample size was used in the present study and the results
obtained using bioinformatics methods were not verified via wet lab
experiments. Although disadvantages exist, the used method and the
results obtained by the present study provide investigators with
valuable resources for improving understanding of the underlying
molecular mechanisms of CSVD, and for the identification of
potential biomarkers for the early diagnosis and treatment of CSVD.
Furthermore, the method proposed may be considered as a framework
for optimizing further pathway analysis.
References
|
1
|
Benjamin P, Zeestraten E, Lambert C, Ster
IC, Williams OA, Lawrence AJ, Patel B, MacKinnon AD, Barrick TR and
Markus HS: Progression of MRI markers in cerebral small vessel
disease: Sample size considerations for clinical trials. J Cereb
Blood Flow Metab. 36:228–240. 2016. View Article : Google Scholar : PubMed/NCBI
|
|
2
|
Zhou A and Jia J: Different cognitive
profiles between mild cognitive impairment due to cerebral small
vessel disease and mild cognitive impairment of Alzheimer's disease
origin. J Int Neuropsychol Soc. 15:898–905. 2009. View Article : Google Scholar : PubMed/NCBI
|
|
3
|
Gould DB, Phalan FC, van Mil SE, Sundberg
JP, Vahedi K, Massin P, Bousser MG, Heutink P, Miner JH,
Tournier-Lasserve E and John SW: Role of COL4A1 in small-vessel
disease and hemorrhagic stroke. N Engl J Med. 354:1489–1496. 2006.
View Article : Google Scholar : PubMed/NCBI
|
|
4
|
Glazko GV and Emmert-Streib F: Unite and
conquer: Univariate and multivariate approaches for finding
differentially expressed gene sets. Bioinformatics. 25:2348–2354.
2009. View Article : Google Scholar : PubMed/NCBI
|
|
5
|
Li Y, Agarwal P and Rajagopalan D: A
global pathway crosstalk network. Bioinformatics. 24:1442–1447.
2008. View Article : Google Scholar : PubMed/NCBI
|
|
6
|
Khatri P, Sirota M and Butte AJ: Ten years
of pathway analysis: Current approaches and outstanding challenges.
PLoS Comput Biol. 8:e10023752012. View Article : Google Scholar : PubMed/NCBI
|
|
7
|
Xia Y, Yu H, Jansen R, Seringhaus M,
Baxter S, Greenbaum D, Zhao H and Gerstein M: Analyzing cellular
biochemistry in terms of molecular networks. Annu Rev Biochem.
73:1051–1087. 2004. View Article : Google Scholar : PubMed/NCBI
|
|
8
|
Sun SY, Liu ZP, Zeng T, Wang Y and Chen L:
Spatio-temporal analysis of type 2 diabetes mellitus based on
differential expression networks. Sci Rep. 3:22682013. View Article : Google Scholar : PubMed/NCBI
|
|
9
|
Ritz MF, Grond-Ginsbach C, Engelter S and
Lyrer P: Gene expression suggests spontaneously hypertensive rats
may have altered metabolism and reduced hypoxic tolerance. Curr
Neurovasc Res. 9:10–19. 2012. View Article : Google Scholar : PubMed/NCBI
|
|
10
|
Carvalho B: An introduction to the oligo
package. 2007.
|
|
11
|
Ma L, Robinson LN and Towle HC: ChREBP*Mlx
is the principal mediator of glucose-induced gene expression in the
liver. J Biol Chem. 281:28721–28730. 2006. View Article : Google Scholar : PubMed/NCBI
|
|
12
|
Gentleman R, Carey V, Huber W and Hahne F:
Genefilter: Methods for filtering genes from microarray
experiments. R package version. 2011.
|
|
13
|
Ahn T, Lee E, Huh N and Park T:
Personalized identification of altered pathways in cancer using
accumulated normal tissue data. Bioinformatics. 30:i422–i429. 2014.
View Article : Google Scholar : PubMed/NCBI
|
|
14
|
Myers L and Sirois MJ: Spearman
correlation coefficients, differences betweenEncyclopedia of
Statistical Sciences. John Wiley & Sons, Inc.; Hoboken, NJ:
2006, View Article : Google Scholar
|
|
15
|
Smoot ME, Ono K, Ruscheinski J, Wang PL
and Ideker T: Cytoscape 2.8: New features for data integration and
network visualization. Bioinformatics. 27:431–432. 2011. View Article : Google Scholar : PubMed/NCBI
|
|
16
|
Junker BH and Schreiber F: Analysis of
Biological Networks. John Wiley & Sons, Inc.; Hoboken, NJ:
2011
|
|
17
|
Brandes U and Erlebach T: Network
analysis: Methodological foundations. Springer; Berlin: 2005,
View Article : Google Scholar
|
|
18
|
Koschützki D and Schreiber F: Centrality
analysis methods for biological networks and their application to
gene regulatory networks. Gene Regul Syst Bio. 2:193–201.
2008.PubMed/NCBI
|
|
19
|
Choi JK, Yu U, Yoo OJ and Kim S:
Differential coexpression analysis using microarray data and its
application to human cancer. Bioinformatics. 21:4348–4355. 2005.
View Article : Google Scholar : PubMed/NCBI
|
|
20
|
Ravasz E, Somera AL, Mongru DA, Oltvai ZN
and Barabási AL: Hierarchical organization of modularity in
metabolic networks. Science. 297:1551–1555. 2002. View Article : Google Scholar : PubMed/NCBI
|
|
21
|
Mukhopadhyay A, Ray S and De M: Detecting
protein complexes in a PPI network: A gene ontology based
multi-objective evolutionary approach. Mol Biosyst. 8:3036–3048.
2012. View Article : Google Scholar : PubMed/NCBI
|
|
22
|
Wellmann A, Thieblemont C, Pittaluga S,
Sakai A, Jaffe ES, Siebert P and Raffeld M: Detection of
differentially expressed genes in lymphomas using cDNA arrays:
Identification of clusterin as a new diagnostic marker for
anaplastic large-cell lymphomas. Blood. 96:398–404. 2000.PubMed/NCBI
|
|
23
|
Bar-Joseph Z, Gerber G, Simon I, Gifford
DK and Jaakkola TS: Comparing the continuous representation of
time-series expression profiles to identify differentially
expressed genes. Proc Natl Acad Sci USA. 100:10146–10151. 2003.
View Article : Google Scholar : PubMed/NCBI
|
|
24
|
Iwamoto K, Bundo M and Kato T: Altered
expression of mitochondria-related genes in postmortem brains of
patients with bipolar disorder or schizophrenia, as revealed by
large-scale DNA microarray analysis. Hum Mol Genet. 14:241–253.
2005. View Article : Google Scholar : PubMed/NCBI
|
|
25
|
Ein-Dor L, Kela I, Getz G, Givol D and
Domany E: Outcome signature genes in breast cancer: Is there a
unique set? Bioinformatics. 21:171–178. 2005. View Article : Google Scholar : PubMed/NCBI
|
|
26
|
Choi JK, Choi JY, Kim DG, Choi DW, Kim BY,
Lee KH, Yeom YI, Yoo HS, Yoo OJ and Kim S: Integrative analysis of
multiple gene expression profiles applied to liver cancer study.
FEBS Lett. 565:93–100. 2004. View Article : Google Scholar : PubMed/NCBI
|
|
27
|
Wu Y, Jing R, Jiang L, Jiang Y, Kuang Q,
Ye L, Yang L, Li Y and Li M: Combination use of protein-protein
interaction network topological features improves the predictive
scores of deleterious non-synonymous single-nucleotide
polymorphisms. Amino Acids. 46:2025–2035. 2014. View Article : Google Scholar : PubMed/NCBI
|
|
28
|
Schulz H: Oxidation of fatty
acidsBiochemistry of Lipids, Lipoproteins and Membranes. 20. 2nd.
Elsevier Science; pp. 87–11020. 1991
|
|
29
|
Costanzo S, di Niro V, Di Castelnuovo A,
Gianfagna F, Donati MB, de Gaetano G and Iacoviello L: Prevention
of postoperative atrial fibrillation in open heart surgery patients
by preoperative supplementation of n-3 polyunsaturated fatty acids:
An updated meta-analysis. J Thorac Cardiovasc Surg. 146:906–911.
2013. View Article : Google Scholar : PubMed/NCBI
|
|
30
|
Bortz WM and Lynen F: Elevation of long
chain acyl coa derivatives in livers of fasted rats. Biochem Z.
339:77–82. 1963.PubMed/NCBI
|
|
31
|
Blondeau N, Widmann C, Lazdunski M and
Heurteaux C: Polyunsaturated fatty acids induce ischemic and
epileptic tolerance. Neuroscience. 109:231–241. 2002. View Article : Google Scholar : PubMed/NCBI
|
|
32
|
Heurteaux C, Laigle C, Blondeau N,
Jarretou G and Lazdunski M: Alpha-linolenic acid and riluzole
treatment confer cerebral protection and improve survival after
focal brain ischemia. Neuroscience. 137:241–251. 2006. View Article : Google Scholar : PubMed/NCBI
|
|
33
|
Haag M: Essential fatty acids and the
brain. Can J Psychiatry. 48:195–203. 2003. View Article : Google Scholar : PubMed/NCBI
|
|
34
|
Asano M, Nakajima T, Hazama H, Iwasawa K,
Tomaru T, Omata M, Soma M, Asakura Y, Mizutani M, Suzuki S, et al:
Influence of cellular incorporation of n-3 eicosapentaenoic acid on
intracellular Ca 2+ concentration and membrane potential
in vascular smooth muscle cells. Atherosclerosis. 138:117–127.
1998. View Article : Google Scholar : PubMed/NCBI
|
|
35
|
Meydani M: Omega-3 fatty acids alter
soluble markers of endothelial function in coronary heart disease
patients. Nutr Rev. 58:56–59. 2000. View Article : Google Scholar : PubMed/NCBI
|
|
36
|
Mano MT, Bexis S, Abeywardena MY,
McMurchie EJ, King RA, Smith RM and Head RJ: Fish oils modulate
blood pressure and vascular contractility in the rat and vascular
contractility in the primate. Blood Press. 4:177–186. 1995.
View Article : Google Scholar : PubMed/NCBI
|