Introduction
Liver cirrhosis is an end-stage complication of
chronic liver diseases (1). Ascites
is among the most common complications of cirrhosis, and >60% of
cirrhotic patients develop ascites within 10 years of the diagnosis
of cirrhosis (2). Ascites is
typically the primary sign of portal hypertension in decompensated
liver cirrhosis (3). The appearance
of ascites is associated with poor prognosis, and previous results
suggest that the 1- and 2-year mortality rate of cirrhotic patients
with ascites is 50 and 60%, respectively (4). In patients with ascites, more severe
complications, including hepatorenal syndrome and spontaneous
bacterial peritonitis, may be induced, thereby increasing the risk
of mortality (5–8).
The treatment strategy of ascites is primarily based
on the grade of ascites, according to guidelines of the
International Ascites Club (5,6). The
grade of ascites is principally based on physical examinations and
ultrasound (5). However, to the best
of our knowledge, no method for the quantification of ascites in
liver cirrhosis has previously been reported. Strategies to
determine the volume of ascites may be important for the prognostic
assessment of liver cirrhosis.
Oriuchi et al (9) developed a simple and accurate
‘five-point’ method of measuring the volume of ascites in patients
with malignant ascites, which utilized standard abdomino-pelvic
computed tomography (CT). Oriuchi et al (9) demonstrated that conventional CT might
be an alternative method for measuring the thickness of ascites,
while three-dimensional CT (3D-CT) was optimal for measuring
precise ascites volumes. Notably, a statistically significant
correlation was identified between the exact volume measured by
3D-CT and the volume estimated by the five-point method (r=0.956,
P<0.01). Subsequent studies have verified the accuracy of the
five-point method (10,11).
In the present retrospective study, the five-point
method was used to evaluate the volume of ascites and its
association with liver dysfunction severity and in-hospital
mortality rate of patients with liver cirrhosis.
Materials and methods
Patient selection
The present study was a retrospective observational
study of patients' medical records. Patients diagnosed with liver
cirrhosis at the General Hospital of Shenyang Military Region
(Shenyang, China) from June 2012 to June 2014 were eligible.
Patients who underwent abdomino-pelvic CT scans during
hospitalization were included. The exclusion criteria were as
follows: i) hepatocellular carcinoma or any other kind of
malignancy; and ii) patients' medical records or laboratory test
results were lacking. The study was approved by the Ethics
Committee of the General Hospital of Shenyang Military Region
(approval no. k/2015/41). Written informed consent was waived due
to the retrospective nature of the study.
Data collection
The volume of ascites was calculated using the
five-point method (9). Five
variables, namely total bilirubin (TBIL), albumin (ALB),
international normalized ratio (INR), hepatic encephalopathy, and
ascites were used to calculate the Child-Pugh class/score, as
previously described (12). The
model for end-stage liver disease (MELD) score was also calculated
according to the following formula: 9.57 ×
loge[creatinine (µmol/l) × 0.01] + 3.78 ×
loge[TBIL (µmol/l) × 0.05] + 11.2 × loge(INR)
+ 6.43, as previously described (13,14).
Five-point method
All CT images were reviewed by two investigators (a
resident and an attending physician) together using a PowerRIS
system version 5.0 (Mozi Healthcare Technology, Co., Ltd., Beijing,
China) at the General Hospital of Shenyang Military Region. The
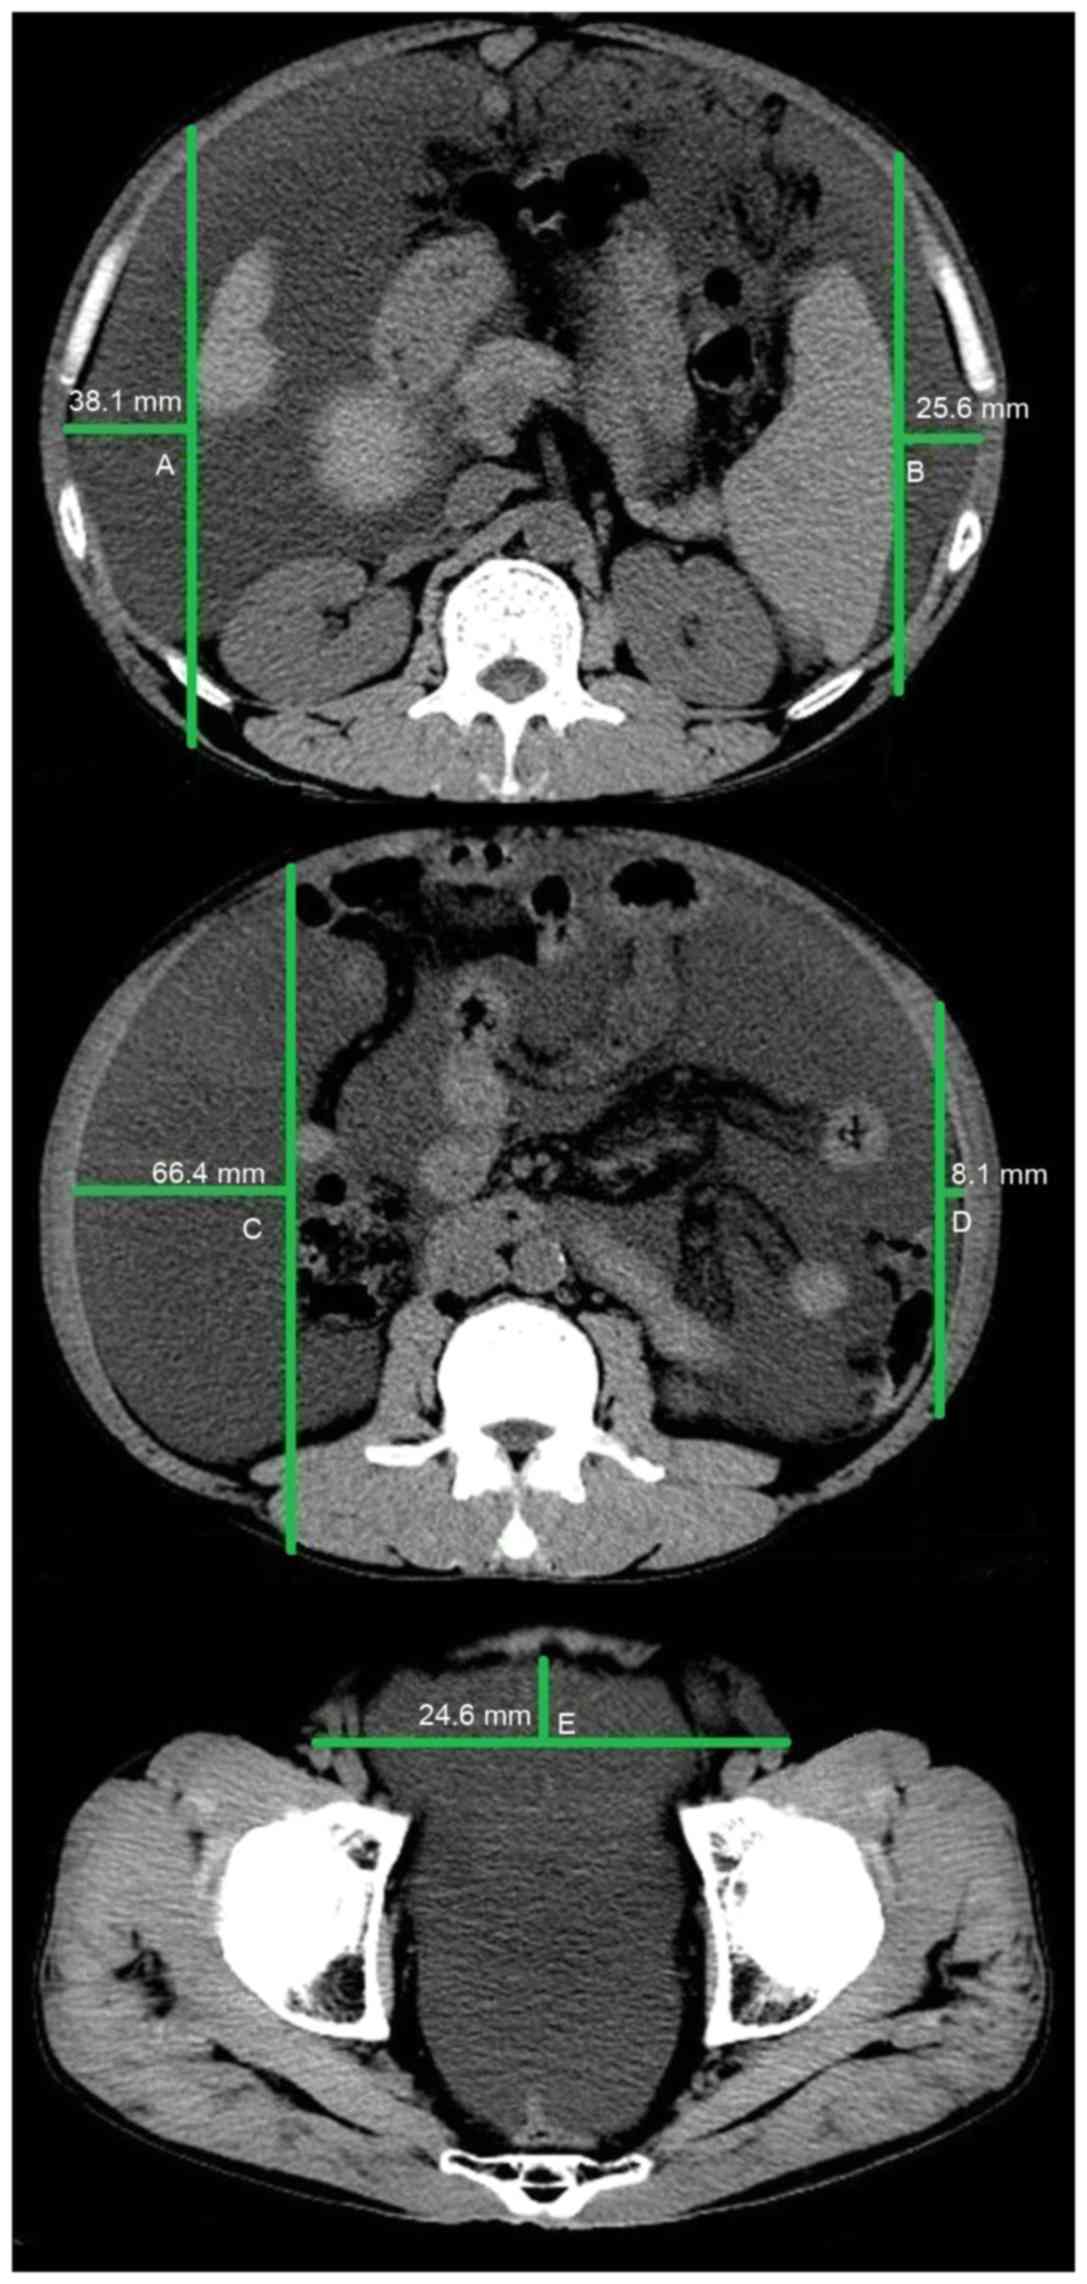
method of measuring ascites on a CT image is outlined in Fig. 1. Three specified planes were selected
to quantify the volume of ascites. The first plane was the superior
mesenteric artery branch from the abdominal aorta. The distance
between the inner surface of the right abdominal wall at
antero-posterior mid portion and the surface of the liver was
denoted as A (cm); the distance between the inner surface of the
left abdominal wall at antero-posterior mid portion and the surface
of the spleen was denoted as B (cm). If the liver was not observed
in this plane, the distance between the inner surface of the right
abdominal wall and the internal organs was denoted as A. Similarly,
if the spleen was not observed in this plane, the distance between
the inner surface of the left abdominal wall and the internal
organs was denoted as B. The second plane was the lower pole of the
left kidney. The distance between the inner surface of the right
abdominal wall at antero-posterior mid portion and the vertical
line through the posterior pole of the right ascending colon was
denoted as C (cm); the distance between the inner surface of the
left abdominal wall at antero-posterior mid portion and the
vertical line through the posterior pole of the descending colon
was denoted as D (cm). The third plane was the femoral head. The
distance between the inner surface of the anterior abdominal wall
to the line though the bilateral femoral arteries was denoted as E
(cm). The following equation was used to calculate the volume of
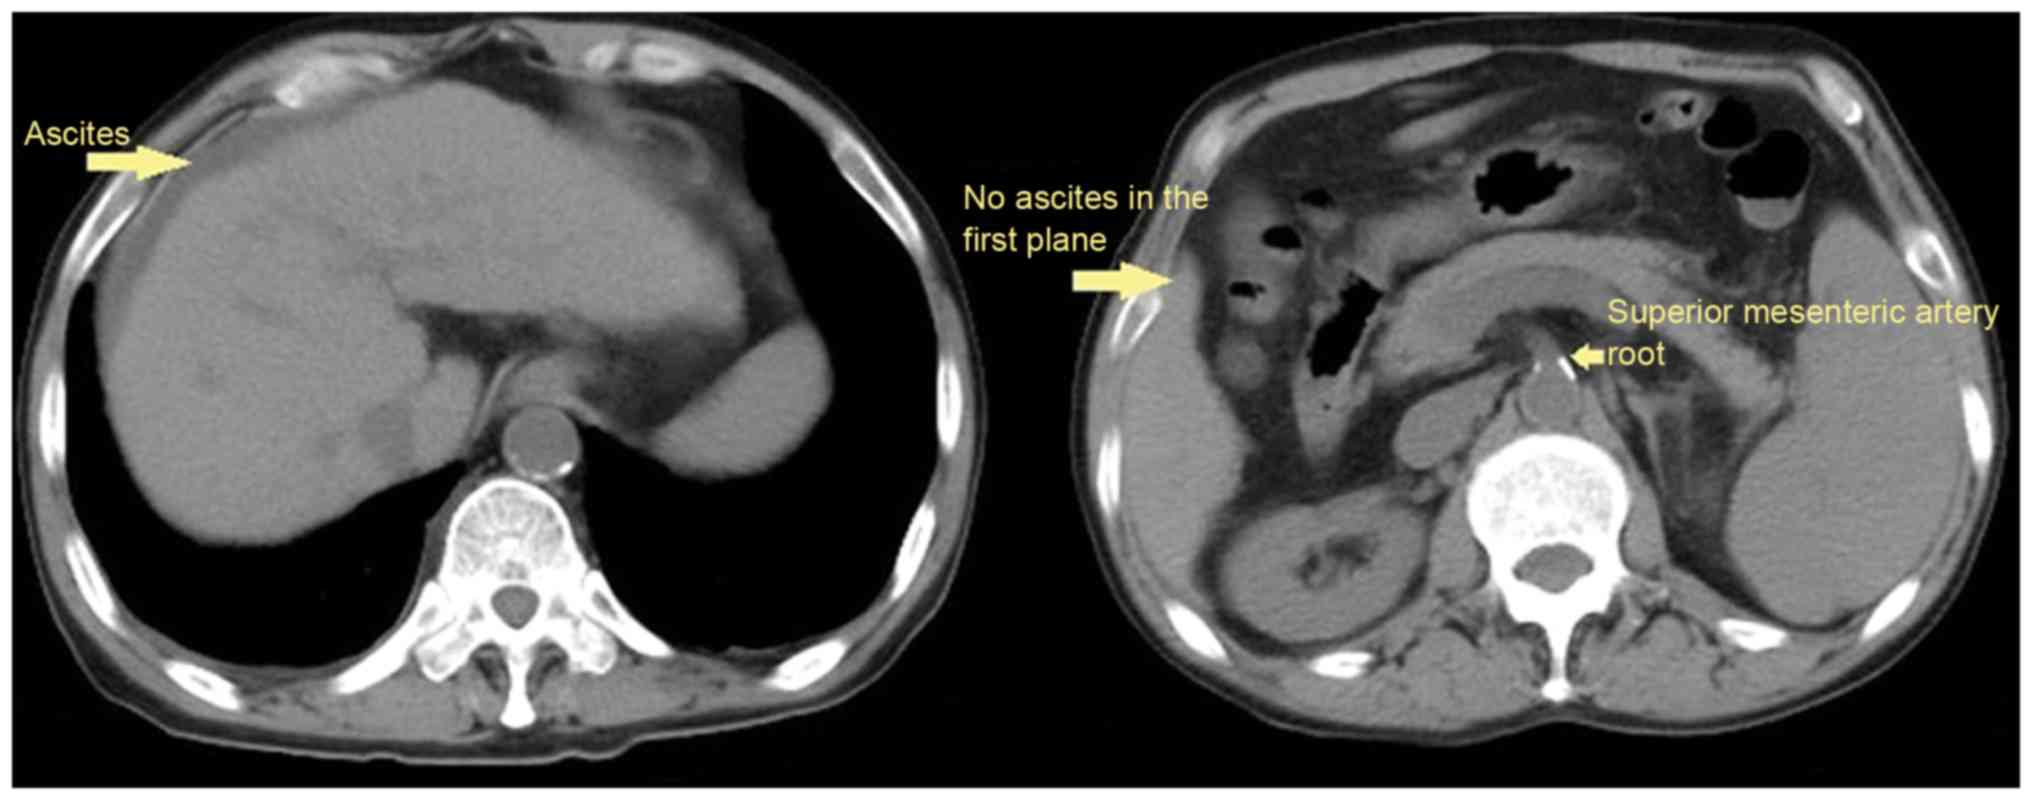
ascites: (A+B+C+D+E) × 200 ml, as previously described (9). As only a small amount of peritoneal
fluid was observed around the surface of the liver in patients with
mild ascites, the volume of ascites measured by the five-point
method was 0 ml, thus yielding a false negative for the presence of
ascites.
Statistical analysis
Continuous variables were expressed as the mean ±
standard deviation and median and range, and were compared using a
Student's t-test. Categorical variables were expressed as a
frequency (percentage) and were compared using a χ2
test. The clinical characteristics, laboratory data, Child-Pugh and
MELD scores, and in-hospital mortality were compared between
patients with and without ascites. The five-point method has a
higher accuracy in estimating the volume of ascites when the volume
of ascites is >300 ml (9).
Therefore, the clinical characteristics and outcomes were also
compared between patients with an ascites volume >300 ml and
those without ascites. Pearson correlation analysis was performed
and the correlation between in-hospital mortality and volume of
ascites was analyzed in patients with ascites >300 ml. The
diagnostic accuracy of Child-Pugh and MELD scores and ascites
volume was evaluated using area under the receiver operating
characteristic curves (AUROCs) with 95% confidence intervals (CIs).
MedCalc software version 11.4.2.0 (MedCalc Software bvba, Ostend,
Belgium) was used. P<0.05 was considered to indicate a
statistically significant difference.
Results
Patients
The data of 177 patients was reviewed in the present
study. A total of 109 (61.58%) patients were male and 68 (38.42%)
were female. The mean age of patients was 59.37±12.05 years.
Ascites was confirmed by CT scans in 117 (61.10%) patients, among
them, 27 patients presented with ascites, but the volume of ascites
could not be evaluated according to five-point method (Fig. 2); and the volume of ascites was
<300 ml in 45 patients. During hospitalization, the mortality
rate of patients was 4.5% (8/177). Hepatitis B virus and alcohol
abuse were the two major causes of cirrhosis. The patient
characteristics are presented in Table
I.
 | Table I.Baseline characteristics of
patients. |
Table I.
Baseline characteristics of
patients.
| Variables | N | Mean ± SD or
frequency (percentage) | Median (range) |
|---|
| Sex, male/female | 177 | 109 (61.58)/68
(38.42) |
|
| Age, years | 177 | 59.37±12.05 | 58.00
(27.00–87.00) |
| Causes of liver
diseases, n (%) | 177 |
|
|
| Hepatitis
B virus |
| 43 (24.29) |
|
| Hepatitis
C virus |
| 15 (8.47) |
|
| Hepatitis
B virus + hepatitis C virus |
| 3 (1.69) |
|
|
Alcohol |
| 45 (25.42) |
|
| Hepatitis
B virus + alcohol |
| 17 (9.60) |
|
| Hepatitis
C virus + alcohol |
| 1 (0.56) |
|
|
Autoimmune hepatitis |
| 10 (5.65) |
|
| Drug
induced liver disease |
| 5 (2.82) |
|
| PBC |
| 5 (2.82) |
|
|
Unknown |
| 32 (18.08) |
|
|
Autoimmune hepatitis +
PBC |
| 1 (0.56) |
|
| Laboratory tests |
|
|
|
| RBC,
1012/l | 176 | 3.14±0.80 | 3.02 (1.01–5.57) |
| Hb,
g/l | 176 | 96.51±228.58 | 96.00
(27.00–166.00) |
| WBC,
1012/l | 176 | 5.76±4.09 | 4.40
(1.00–26.00) |
| PLT,
109/l | 176 | 107.60±79.54 | 84.00
(13.00–463.00) |
| TBIL,
µmol/l | 177 | 39.69±58.63 | 20.90
(2.00–446.30) |
| ALB,
g/l | 176 | 30.58±6.19 | 30.00
(14.30–48.40) |
| ALT,
U/l | 176 | 38.44±46.29 | 27.00
(5.00–368.00) |
| AST,
U/l | 176 | 62.93±110.65 | 37.00
(8.00–1293.00) |
| ALP,
U/l | 176 | 112.71±89.62 | 86.00
(17.00–531.00) |
| GGT,
U/l | 176 | 103.20±146.83 | 48.00
(9.00–912.00) |
| BUN,
mmol/l | 175 | 8.50±7.31 | 6.11
(1.63–61.88) |
| CR,
µmol/l | 175 | 92.57±118.33 | 58.20
(27.40–857.00) |
| Serum
potassium, mmol/l | 175 | 4.11±0.70 | 4.05 (1.90–7.24) |
| Serum
sodium, mmol/l | 175 | 137.54±4.91 | 138.50
(121.00–146.40) |
| Serum
calcium, mmol/l | 106 | 2.07±0.23 | 2.12 (1.06–2.66) |
| BA,
µmol/l | 106 | 53.24±48.45 | 43.00
(9.00–415.00) |
| PT,
sec | 177 | 17.07±8.05 | 15.40
(11.30–94.60) |
| APTT,
sec | 177 | 44.46±13.66 | 42.60
(28.00–180.00) |
|
INR | 177 | 1.44±1.13 | 1.23
(0.84–13.4) |
| In-hospital
mortality | 177 | 8 (4.52) |
|
| Child-Pugh
score | 175 | 8.01±1.93 | 8.00
(5.00–14.00) |
| MELD score | 174 | 8.12±8.51 | 6.67
(−5.22–51.64) |
Clinical characteristics of patients
with and without ascites
Clinical characteristics were compared between
patients with and without ascites (Table II). Significantly increased levels
of TBIL (P=0.005), blood urea nitrogen (BUN; P<0.001),
prothrombin time (PT; P=0.006), activated partial thromboplastin
time (APTT; P=0.014), INR (P=0.014), Child-Pugh (P<0.001), and
MELD scores (P<0.001) were observed. A significant decrease in
the level of red blood cell (RBC; P<0.001), hemoglobin (Hb;
P=0.018), ALB (P<0.001), and serum sodium (P=0.002) was
associated with the presence of ascites. All patients who did not
survive during their hospitalizations presented with ascites;
however, the in-hospital mortality between patients with and
without ascites did not differ significantly (8/117 vs. 0/60,
P=0.052).
| Table II.Comparison between patients with and
without ascites. |
Table II.
Comparison between patients with and
without ascites.
|
| With ascites | Without
ascites |
|
|---|
|
|
|
|
|
|---|
| Variables | N | Mean ± SD or
frequency (percentage) | Median (range) | N | Mean ± SD or
frequency (percentage) | Median (range) | P-value |
|---|
| Sex,
male/female | 117 | 72 (61.54)/45
(38.46) |
| 60 | 37 (61.67)/23
(38.33) |
| 0.931 |
| Age, years | 117 | 59.58±12.18 | 57.00
(27.00–87.00) | 60 | 59.18±11.91 | 60.00
(34.00–84.00) | 0.756 |
| Causes of liver
diseases, n (%) | 117 |
|
| 60 |
|
|
|
|
Hepatitis B virus |
| 24 (20.51) |
|
| 19 (31.67) |
| 0.175 |
|
Hepatitis C virus |
| 12 (10.26) |
|
| 3 (5.00) |
| 0.344 |
|
Hepatitis B virus + hepatitis
C virus |
| 3 (2.56) |
|
| 0 (0.00) |
| 0.514 |
|
Alcohol |
| 29 (24.79) |
|
| 16 (26.67) |
| 0.814 |
|
Hepatitis B virus +
alcohol |
| 13 (11.11) |
|
| 4 (6.67) |
| 0.467 |
|
Hepatitis C virus +
alcohol |
| 1 (0.85) |
|
| 0 (0.00) |
| 0.743 |
|
Autoimmune hepatitis |
| 6 (5.13) |
|
| 4 (6.67) |
| 0.97 |
| Drug
induced liver disease |
| 3 (2.56) |
|
| 2 (3.33) |
| 0.832 |
|
PBC |
| 5 (4.27) |
|
| 0 (0.00) |
| 0.243 |
|
Unknown |
| 20 (17.09) |
|
| 12 (20.00) |
| 0.752 |
|
Autoimmune hepatitis +
PBC |
| 1 (0.85) |
|
| 0 (0.00) |
| 0.743 |
| Laboratory
tests |
|
|
|
|
|
|
|
| RBC,
1012/l | 116 | 3.00±0.75 | 2.98
(1.01–5.40) | 59 | 3.42±0.83 | 3.39
(1.97–5.57) | <0.001 |
| Hb,
g/l | 117 | 93.01±26.89 | 96.00
(27.00–151.00) | 59 | 103.84±30.71 | 102.00
(52.00–166.00) | 0.018 |
| WBC,
1012/l | 116 | 6.11±4.49 | 4.60
(1.30–26.00) | 59 | 4.98±3.09 | 4.20
(1.00–17.40) | 0.056 |
| PLT,
109/l | 116 | 102.01±77.59 | 74.00
(13.00–366.00) | 59 | 114.66±81.72 | 91.00
(19.00–463.00) | 0.318 |
| TBIL,
µmol/l | 117 | 46.77±69.81 | 20.65
(2.00–446.30) | 59 | 26.69±20.87 | 20.60
(4.40–91.00) | 0.005 |
| ALB,
g/l | 117 | 28.86±5.65 | 28.45
(14.30–48.40) | 59 | 34.00±5.84 | 34.80
(22.40–45.90) | <0.001 |
| ALT,
U/l | 117 | 39.85±45.66 | 27.00
(8.00–323.00) | 59 | 35.63±47.78 | 27.00
(5.00–368.00) | 0.57 |
| AST,
U/l | 117 | 69.59±127.12 | 42.00
(8.00–1293.00) | 59 | 49.73±66.04 | 29.00
(12.0–427.00) | 0.174 |
| ALP,
U/l | 117 | 118.96±94.94 | 94.50
(17.00–531.00) | 59 | 100.31±77.30 | 80.00
(20.00–518.00) | 0.194 |
| GGT,
U/l | 117 | 102.90±145.60 | 49.00
(9.00–912.00) | 59 | 103.78±150.48 | 45.00
(10.00–755.00) | 0.97 |
| BUN,
mmol/l | 115 | 9.77±8.43 | 7.30
(1.77–61.88) | 60 | 6.05±3.35 | 5.33
(1.63–21.70) | <0.001 |
| CR,
µmol/l | 115 | 110.63±141.87 | 63.00
(31.00–857.00) | 60 | 57.97±23.49 | 54.00
(27.40–164.00) | <0.001 |
| Serum
potassium, mmol/l | 117 | 4.12±0.79 | 4.02
(2.46–7.24) | 58 | 4.07±0.46 | 4.07
(3.23–5.90) | 0.611 |
| Serum
sodium, mmol/l | 117 | 136.71±5.03 | 137.90
(121.00–145.80) | 58 | 139.19±4.23 | 139.70
(125.50–146.40) | 0.002 |
| Serum
calcium, mmol/l | 76 | 2.06±0.23 | 2.10
(1.40–2.66) | 30 | 2.11±0.25 | 2.17
(1.73–2.47) | 0.283 |
| BA,
µmol/l | 77 | 56.65±53.37 | 43.50
(9.00–415.00) | 29 | 44.17±30.90 | 32.00
(9.00–107.00) | 0.139 |
| PT,
sec | 117 | 17.99±9.54 | 15.70
(11.30–94.60) | 60 | 15.28±3.07 | 14.25
(11.70–31.60) | 0.006 |
| APTT,
sec | 117 | 45.91±15.92 | 44.15
(28.00–180.00) | 60 | 41.64±6.78 | 40.20
(28.00–58.00) | 0.014 |
|
INR | 117 | 1.56±1.37 | 1.27
(0.84–13.4) | 60 | 1.22±0.34 | 1.11
(0.84–3.06) | 0.014 |
| In-hospital
mortality | 117 | 8 (6.84) |
| 60 | 0 (0.00) |
| 0.052 |
| Child-Pugh
score | 117 | 8.88±1.56 | 9.00
(6.00–14.00) | 58 | 6.22±1.28 | 6.00
(5.00–10.00) | <0.001 |
| MELD score | 115 | 10.21±9.07 | 8.54
(−5.22–51.64) | 59 | 4.03±5.34 | 3.59
(−4.83–23.23) | <0.001 |
| Ascites volume, ml
(according to five-point method) | 117 |
1,423.79±1,644.77 | 722.00
(0.00–7,070.00) |
|
|
|
|
Clinical characteristics of patients
with ascites >300 ml and those without ascites
Clinical characteristics were compared between
patients with ascites >300 ml (n=72) and those without ascites
(n=60; Table III). Significantly
increased levels of TBIL (P=0.019), BUN (P=0.0002), creatinine
(P=0.002), PT (P=0.006), APTT (P=0.016), INR (P=0.014), and
Child-Pugh (P<0.001) and MELD scores (P<0.001) were observed.
Significantly decreased levels of RBC (P=0.001), Hb (P=0.009), ALB
(P<0.001), and serum sodium (P=0.004) were also associated with
ascites >300 ml. All patients who did not survive during their
hospitalizations had ascites; however, the in-hospital mortality
rate between patients with ascites >300 ml and those without did
not differ significantly (5/72 vs. 0/60; P=0.081).
| Table III.Comparison between patients with
ascites (>300 ml) and patients without ascites. |
Table III.
Comparison between patients with
ascites (>300 ml) and patients without ascites.
|
| With ascites
(>300 ml) | Without
ascites |
|
|---|
|
|
|
|
|
|---|
| Variables | N | Mean ± SD or
frequency (percentage) | Median (range) | N | Mean ± SD or
frequency (percentage) | Median (range) | P-value |
|---|
| Sex,
male/female | 72 | 44 (61.11)/28
(38.89) |
| 60 | 37 (61.67)/23
(38.33) |
| 0.838 |
| Age, years | 72 | 58.13±12.19 | 55.50
(27.00–84.00) | 60 | 59.18±11.91 | 60.00
(34.00–84.00) | 0.686 |
| Causes of liver
diseases, n (%) | 72 |
|
| 60 |
|
| 0.961 |
| Hepatitis B
virus |
| 13 (18.06) |
|
| 19 (31.67) |
| 0.107 |
|
Hepatitis C virus |
| 10 (13.89) |
|
| 3 (5.00) |
| 0.158 |
|
Hepatitis B virus + hepatitis
C virus |
| 3 (4.17) |
|
| 0 (0.00) |
| 0.311 |
|
Alcohol |
| 18 (25.00) |
|
| 16 (26.67) |
| 0.986 |
|
Hepatitis B virus +
alcohol |
| 9 (12.50) |
|
| 4 (6.67) |
| 0.408 |
|
Autoimmune hepatitis |
| 3 (4.17) |
|
| 4 (6.67) |
| 0.804 |
| Drug
induced liver disease |
| 2 (2.78) |
|
| 2 (3.33) |
| 0.393 |
|
PBC |
| 3 (4.17) |
|
| 0 (0.00) |
| 0.311 |
|
Unknown |
| 10 (13.89) |
|
| 12 (20.00) |
| 0.482 |
|
Autoimmune hepatitis +
PBC |
| 1 (1.39) |
|
| 0 (0.00) |
| 0.338 |
| Laboratory
tests |
|
|
|
|
|
|
|
| RBC,
1012/l | 71 | 2.94±0.76 | 2.97
(1.19–5.40) | 59 | 3.42±0.83 | 3.39
(1.97–5.57) | 0.001 |
| Hb,
g/l | 71 | 90.35±27.26 | 92.00
(27.00–151.00) | 59 | 103.84±30.71 | 102.00
(52.00–166.00) | 0.009 |
| WBC,
1012/l | 71 | 5.68±4.59 | 4.40
(1.30–26.00) | 59 | 4.98±3.09 | 4.20
(1.00–17.40) | 0.311 |
| PLT,
109/l | 71 | 101.92±80.32 | 70.00
(15.00–366.00) | 59 | 114.66±81.72 | 91.00
(19.00–463.00) | 0.373 |
| TBIL,
µmol/l | 72 | 50.10±79.89 | 19.90
(2.00–446.30) | 59 | 26.69±20.87 | 20.60
(4.40–91.00) | 0.019 |
| ALB,
g/l | 72 | 28.71±5.32 | 28.30
(19.30–48.40) | 59 | 34.00±5.84 | 34.80
(22.40–45.90) | <0.0001 |
| ALT,
U/l | 72 | 34.08±41.06 | 23.50
(8.00–323.00) | 59 | 35.63±47.78 | 27.00
(5.00–368.00) | 0.842 |
| AST,
U/l | 72 | 52.64±43.96 | 39.50
(8.00–261.00) | 59 | 49.73±66.04 | 29.00
(12.00–427.00) | 0.773 |
| ALP,
U/l | 72 | 104.65±80.86 | 92.00
(17.00–517.00) | 59 | 100.31±77.30 | 80.00
(20.00–518.00) | 0.756 |
| GGT,
U/l | 72 | 86.90±128.87 | 43.00
(9.00–912.00) | 59 | 103.78±150.48 | 45.00
(10.00–755.00) | 0.49 |
| BUN,
mmol/l | 71 | 10.75±9.63 | 8.00
(1.77–61.88) | 60 | 6.05±3.35 | 5.33
(1.63–21.70) | <0.0001 |
| CR,
µmol/l | 71 | 110.74±132.21 | 64.00
(31.00–702.00) | 60 | 57.97±23.49 | 54.00
(27.40–164.00) | 0.002 |
| Serum
potassium, mmol/l | 72 | 4.04±0.73 | 3.88
(2.46–6.44) | 58 | 4.07±0.46 | 4.07
(3.23–5.90) | 0.587 |
| Serum
sodium, mmol/l | 72 | 136.82±5.08 | 137.80
(121.00–145.60) | 58 | 139.19±4.23 | 139.70
(125.50–146.40) | 0.004 |
| Serum
calcium, mmol/l | 55 | 2.06±0.21 | 2.12
(1.40–2.66) | 30 | 2.11±0.25 | 2.17
(1.73–2.47) | 0.264 |
| BA,
µmol/l | 50 | 62.20±61.63 | 44.00
(9.00–415.00) | 29 | 44.17±30.90 | 32.00
(9.00–107.00) | 0.12 |
| PT,
sec | 72 | 17.97±7.45 | 16.30
(12.50–62.80) | 60 | 15.28±3.07 | 14.25
(11.70–31.60) | 0.006 |
| APTT,
sec | 72 | 47.41±18.48 | 44.60
(28.70–180.00) | 60 | 41.64±6.78 | 40.20
(28.00–58.00) | 0.016 |
|
INR | 72 | 1.53±0.97 | 1.31
(0.93–7.96) | 60 | 1.22±0.34 | 1.11
(0.84–3.06) | 0.014 |
| In-hospital
mortality | 72 | 5 (6.94) |
| 60 | 0 (0.00) |
| 0.081 |
| Child-Pugh
score | 72 | 9.07±1.49 | 9.00
(7.00–14.00) | 58 | 6.22±1.28 | 6.00
(5.00–10.00) | <0.0001 |
| MELD score | 71 | 10.27±8.81 | 8.74
(−5.22–42.04) | 59 | 4.03±5.34 | 3.59
(−4.83–23.23) | <0.0001 |
| Ascites volume, ml
(according to five-point method) | 71 |
2,272.00±1,586.40 | 2,009.00
(436.00–7,070.00) |
|
|
|
|
Clinical characteristics of patients
with ascites >300 ml
In patients with ascites >300 ml, the volume of
ascites was positively and significantly correlated with serum
potassium (r=0.248; P=0.036), BUN (r=0.359; P=0.002), in-hospital
mortality (r=0.267; P=0.023), and blood ammonia (r=0.284; P=0.046)
but negatively and significantly correlated with serum sodium
(r=−0.336; P=0.004). The volume of ascites was not significantly
associated with Child-Pugh score, MELD score, alanine
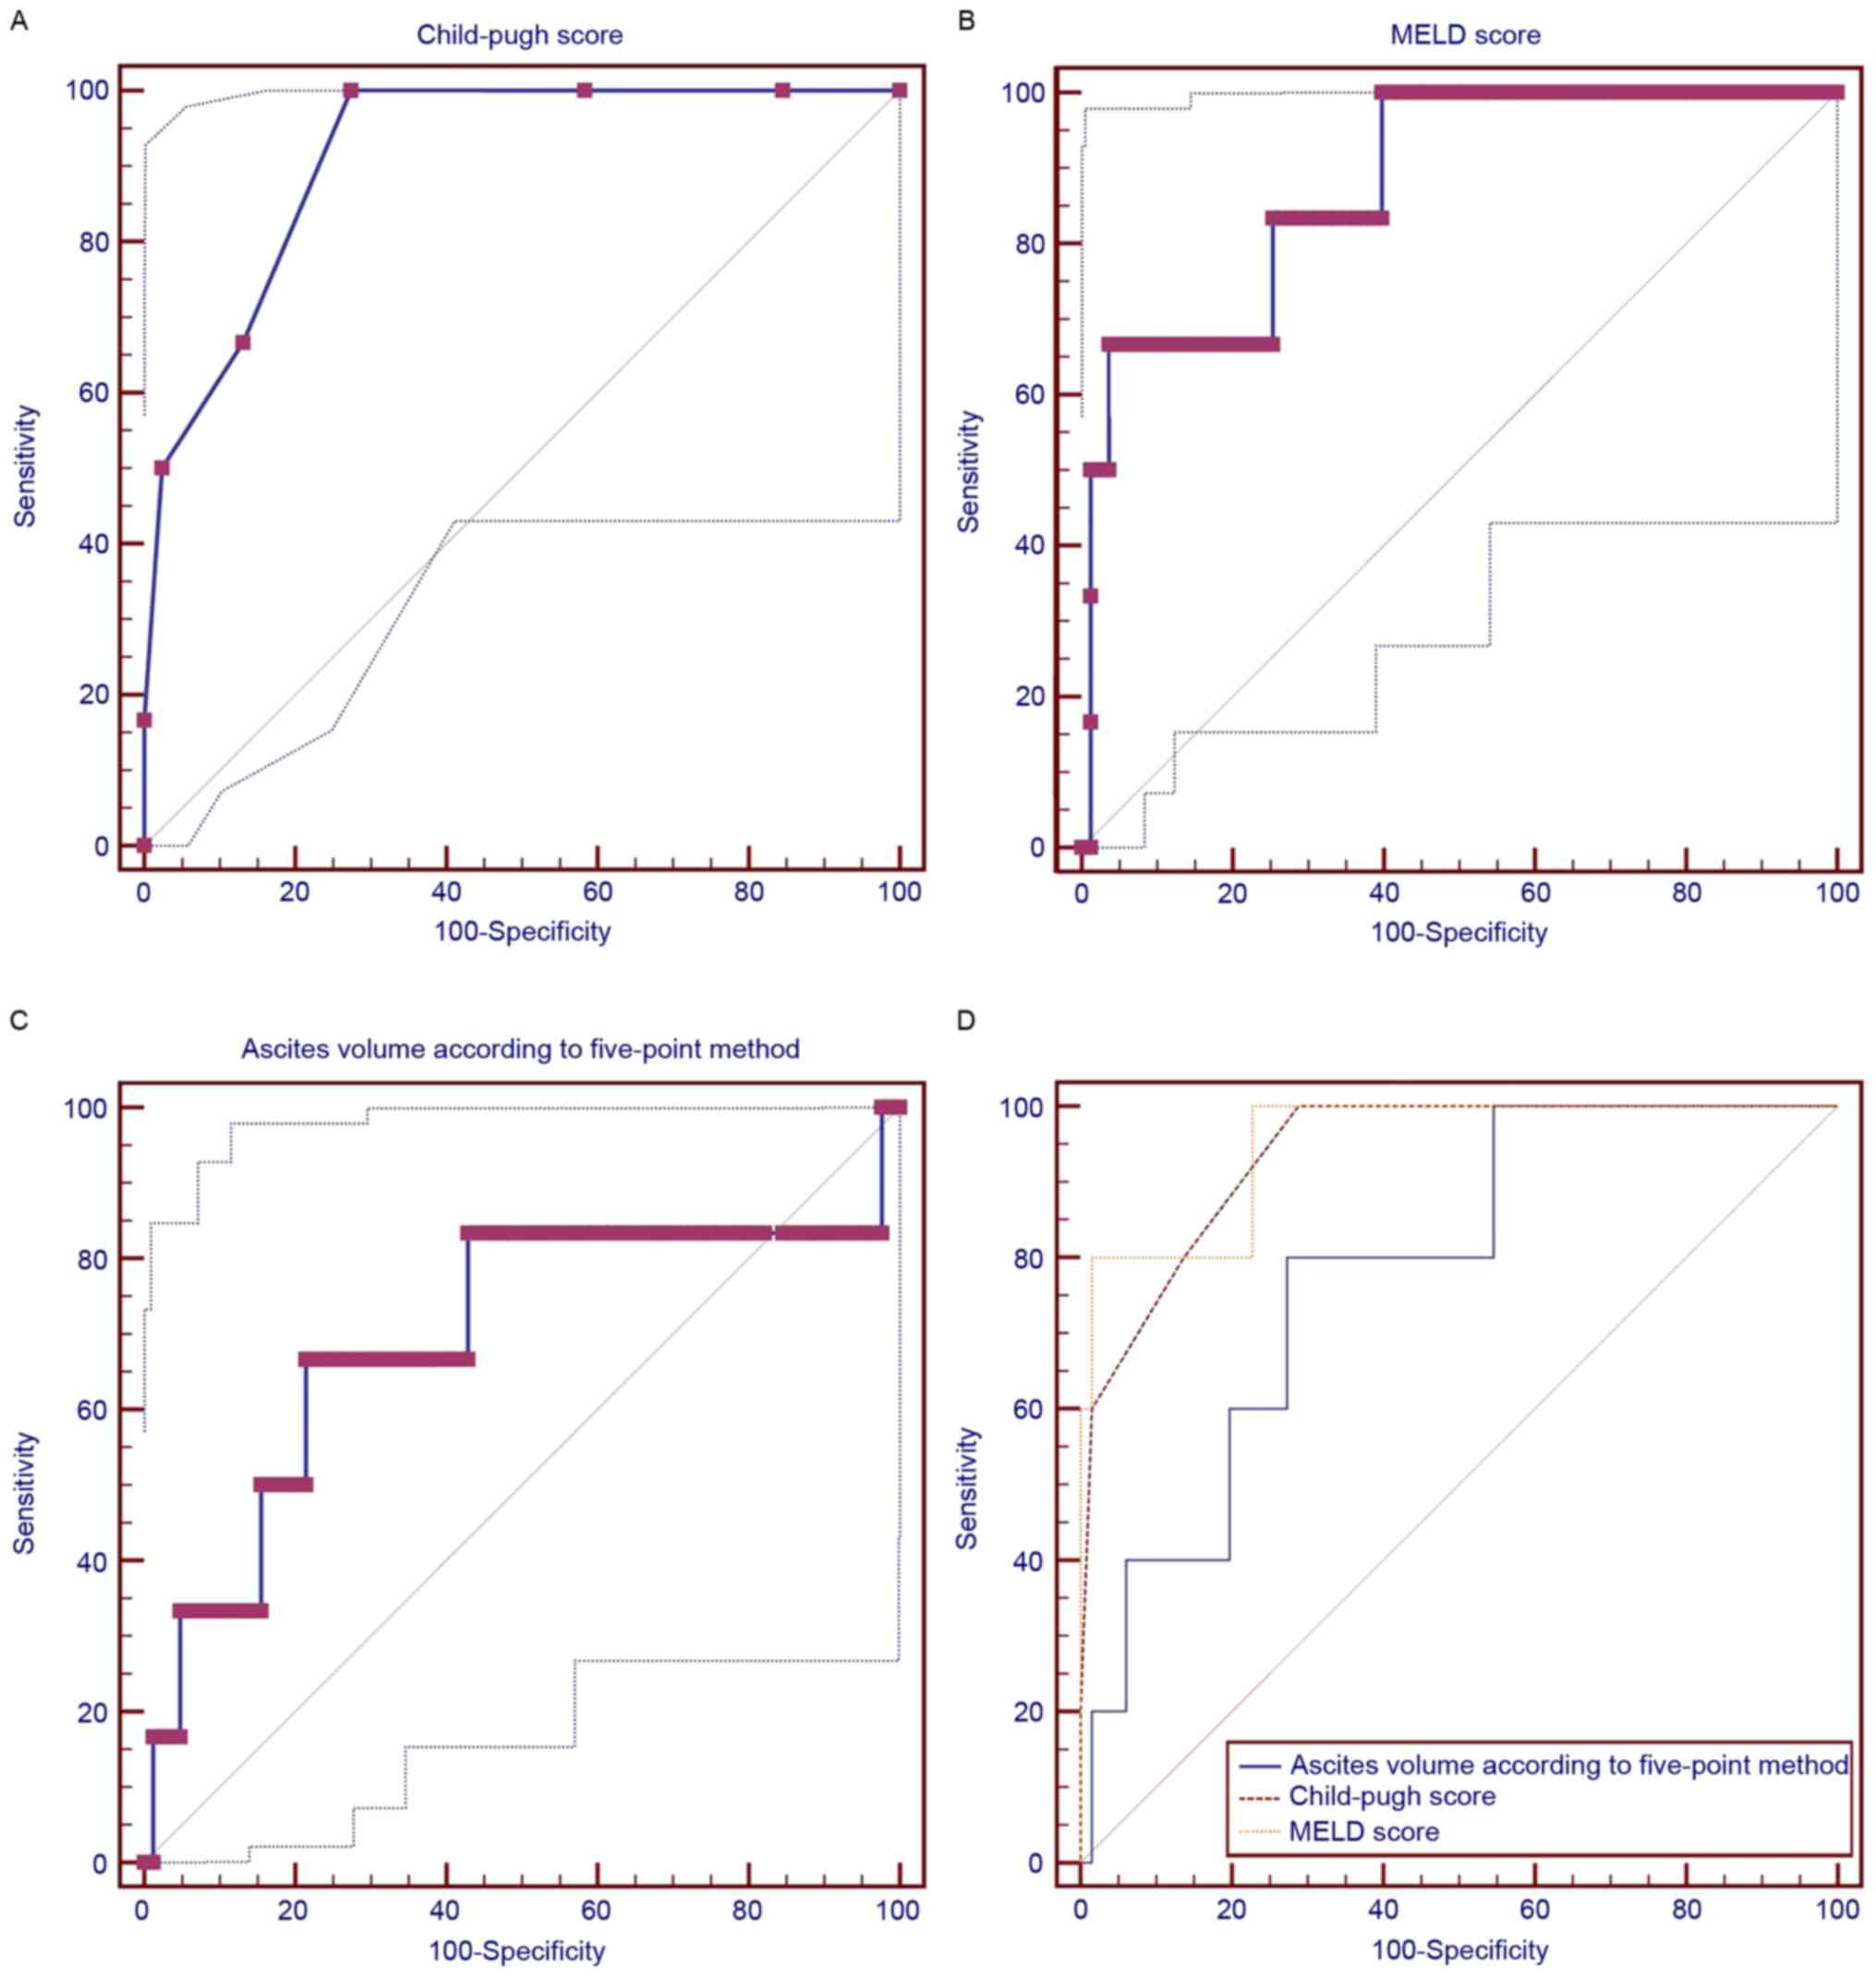
aminotransferase, or aspartate aminotransferase (Table IV). The AUROCs of the Child-Pugh and
MELD scores and ascites volume (>300 ml) for predicting the
in-hospital mortality were 0.939 (95% CI, 0.856–0982), 0.952 (95%
CI: 0.873–0.988), and 0.782 (95% CI, 0.668–0.871), respectively
(Fig. 3). There were no significant
differences among the variables (Child-Pugh vs. MELD, P=0.6281;
Child-Pugh vs. volume of ascites, P=0.2063; MELD vs. volume of
ascites, P=0.1874).
| Table IV.Correlation between different
variables and ascites volume in patients with ascites >300
ml. |
Table IV.
Correlation between different
variables and ascites volume in patients with ascites >300
ml.
| Variables | N | Correlation
coefficient, r | P-value |
|---|
| Sex,
male/female | 72 | −0.109 | 0.359 |
| Age, years | 72 | −0.014 | 0.908 |
| Causes of liver
diseases, n (%) |
|
|
|
|
Hepatitis B virus | 13 | 0.228 | 0.054 |
|
Hepatitis C virus | 10 | −0.030 | 0.799 |
|
Hepatitis B virus + hepatitis
C virus | 3 | 0.098 | 0.413 |
|
Alcohol | 18 | 0.081 | 0.497 |
|
Hepatitis B virus +
alcohol | 9 | −0.078 | 0.513 |
|
Autoimmune hepatitis | 3 | −0.126 | 0.291 |
| Drug
induced liver disease | 2 | −0.178 | 0.135 |
|
PBC | 3 | −0.175 | 0.143 |
|
Unknown | 10 | −0.062 | 0.608 |
|
Autoimmune hepatitis +
PBC | 1 | 0.039 | 0.748 |
| Laboratory
tests |
|
|
|
| RBC,
1012/l | 71 | −0.106 | 0.381 |
| Hb,
g/l | 71 | 0.001 | 0.993 |
| WBC,
1012/l | 71 | −0.026 | 0.830 |
| PLT,
109/l | 71 | −0.006 | 0.959 |
| TBIL,
µmol/l | 72 | 0.018 | 0.883 |
| ALB,
g/l | 72 | −0.078 | 0.512 |
| ALT,
U/l | 72 | −0.067 | 0.576 |
| AST,
U/l | 72 | 0.063 | 0.597 |
| ALP,
U/l | 72 | −0.019 | 0.876 |
| GGT,
U/l | 72 | 0.104 | 0.383 |
| BUN,
mmol/l | 71 | 0.359 | 0.002 |
| CR,
µmol/l | 71 | 0.232 | 0.052 |
| Serum
potassium, mmol/l | 72 | 0.248 | 0.036 |
| Serum
sodium, mmol/l | 72 | −0.336 | 0.004 |
| Serum
calcium, mmol/l | 55 | 0.037 | 0.786 |
| BA,
µmol/l | 50 | 0.284 | 0.046 |
| PT,
sec | 72 | −0.040 | 0.737 |
| APTT,
sec | 72 | −0.077 | 0.518 |
|
INR | 72 | −0.050 | 0.675 |
| In-hospital
mortality | 5 | 0.267 | 0.023 |
| Child-Pugh
score | 72 | 0.102 | 0.394 |
| MELD score | 71 | 0.225 | 0.059 |
Discussion
Ascites is associated with a poor clinical outcome
in liver cirrhosis (5). Indeed, the
present study observed that all patients who did not survive
presented with ascites, and cirrhotic patients with ascites had a
higher rate of in-hospital mortality compared with those without
ascites. However, the difference in in-hospital mortality rate
between patients with and without ascites was not statistically
significant.
To the best of our knowledge, the present study was
the first to identify a significant association between the volume
of ascites, assessed using the five-point method, and in-hospital
mortality of cirrhotic patients. In patients with ascites >300
ml, in-hospital mortality was positively correlated with the volume
of ascites. In addition, AUROC analysis indicated that ascites
volume might be a modest predictor of in-hospital mortality rate in
liver cirrhosis. Notably, the diagnostic accuracy of the volume of
ascites was comparable to that of Child-Pugh and MELD scores. Both
the Child-Pugh and MELD scores had no significant correlation with
the volume of ascites. This result suggests that the volume of
ascites may predict in-hospital mortality rate independently of
Child-Pugh and MELD scores.
In a previous retrospective study by our group, the
accuracy of Child-Pugh and MELD scores in predicting the
in-hospital mortality of cirrhotic patients with acute upper
gastrointestinal bleeding was evaluated (15). The AUROCs of Child-Pugh and MELD
scores were 0.796 and 0.810, respectively. By comparison, the
present study observed that the AUROCs of Child-Pugh and MELD
scores were higher in cirrhotic patients with ascites >300 ml
(0.939 and 0.952, respectively). Thus, it may be concluded that the
scores were more appropriate in the prognostic assessment of
patients with ascites.
The present study also observed that serum sodium
was significantly decreased and BUN was significantly increased in
patients with ascites when compared with those without. Moreover,
serum sodium was negatively correlated and BUN was positively
correlated with the volume of ascites. The correlation between
sodium and ascites is readily explained. Hyponatremia is a common
complication in patients with ascites (16,17).
Sodium retention causes the expansion of extracellular fluid volume
and eventually results in the accumulation of fluid in the
peritoneal cavity (18).
Furthermore, the occurrence of hyponatremia and increased BUN
indicates renal function impairment, thereby resulting in
ascites.
ALB, which is primarily synthesized by the liver, is
an important compartment of plasma oncotic pressure (19). In previous studies, decreased levels
of ALB suggested the presence of liver dysfunction, renal
dysfunction and/or malnutrition (20,21). The
present results indicated that patients with ascites had
significantly lower ALB levels than those without ascites. When ALB
levels are decreased, plasma oncotic pressure is reduced, thereby
leading to the accumulation of fluid in the peritoneal cavity
(19).
The present study included a number of limitations.
First, not all patients presenting with liver cirrhosis underwent
abdomino-pelvic CT scans. Some patients underwent upper abdominal
and/or mid-abdominal CT scans alone, and thus were excluded from
the study. Second, the five-point method is designed to objectively
measure the volume of ascites in patients with different types of
cancer (9). Whether or not the
method is appropriate in the evaluation of cirrhotic patients
requires further confirmation. Third, only three fixed planes were
selected for the five-point method. Thus, not all patients were
subjected to the five-point method to assess the volume of ascites.
Finally, it was difficult to accurately measure the thickness of
ascites based on CT scans.
In conclusion, the present results indicated that
the volume of ascites was positively correlated with the
in-hospital mortality rate of cirrhotic patients. Thus, ascites
volume should be considered in the prognostic assessment of
cirrhotic patients with ascites.
Glossary
Abbreviations
Abbreviations:
|
AUROC
|
area under the receiver operating
characteristic curves
|
|
ALB
|
albumin
|
|
APTT
|
activated partial thromboplastin
time
|
|
BUN
|
blood urea nitrogen
|
|
CI
|
confidence intervals
|
|
CT
|
computed tomography
|
|
Hb
|
hemoglobin
|
|
INR
|
international normalized ratio
|
|
MELD
|
model for end-stage liver disease
|
|
PT
|
prothrombin time
|
|
RBC
|
red blood cell
|
|
TBIL
|
total bilirubin
|
|
3D-CT
|
three-dimensional computed
tomography
|
References
|
1
|
Philip G and Runyon BA: Treatment of
patients with cirrhosis. N Engl J Med. 375:767–777. 2016.
View Article : Google Scholar : PubMed/NCBI
|
|
2
|
Gines P, Quintero E, Arroyo V, Terés J,
Bruguera M, Rimola A, Caballería J, Rodés J and Rozman C:
Compensated cirrhosis: Natural history and prognostic factors.
Hepatology. 7:122–128. 1987. View Article : Google Scholar : PubMed/NCBI
|
|
3
|
D'Amico G, Garcia-Tsao G and Pagliaro L:
Natural history and prognostic indicators of survival in cirrhosis:
A systematic review of 118 studies. J Hepatol. 44:217–231. 2006.
View Article : Google Scholar : PubMed/NCBI
|
|
4
|
Ripoll C, Groszmann R, Garcia-Tsao G,
Grace N, Burroughs A, Planas R, Escorsell A, Garcia-Pagan JC,
Makuch R, Patch D, et al: Hepatic venous pressure gradient predicts
clinical decompensation in patients with compensated cirrhosis.
Gastroenterology. 133:481–488. 2007. View Article : Google Scholar : PubMed/NCBI
|
|
5
|
European Association for the Study of the
Liver: EASL clinical practice guidelines on the management of
ascites, spontaneous bacterial peritonitis, and hepatorenal
syndrome in cirrhosis. J Hepatol. 53:397–417. 2010. View Article : Google Scholar : PubMed/NCBI
|
|
6
|
Moore KP, Wong F, Gines P, Bernardi M,
Ochs A, Salerno F, Angeli P, Porayko M, Moreau R, Garcia-Tsao G, et
al: The management of ascites in cirrhosis: Report on the consensus
conference of the International Ascites Club. Hepatology.
38:258–266. 2003. View Article : Google Scholar : PubMed/NCBI
|
|
7
|
Salerno F, Borroni G, Moser P, Badalamenti
S, Cassarà L, Maggi A, Fusini M and Cesana B: Survival and
prognostic factors of cirrhotic patients with ascites: A study of
134 outpatients. Am J Gastroenterol. 88:514–519. 1993.PubMed/NCBI
|
|
8
|
Pedersen JS, Bendtsen F and Møller S:
Management of cirrhotic ascites. Ther Adv Chronic Dis. 6:124–137.
2015. View Article : Google Scholar : PubMed/NCBI
|
|
9
|
Oriuchi N, Nakajima T, Mochiki E,
Takeyoshi I, Kanuma T, Endo K and Sakamoto J: A new, accurate and
conventional five-point method for quantitative evaluation of
ascites using plain computed tomography in cancer patients. Jpn J
Clin Oncol. 35:386–390. 2005. View Article : Google Scholar : PubMed/NCBI
|
|
10
|
Imamoto H, Oba K, Sakamoto J, Iishi H,
Narahara H, Yumiba T, Morimoto T, Nakamura M, Oriuchi N, Kakutani
C, et al: Assessing clinical benefit response in the treatment of
gastric malignant ascites with non-measurable lesions: A
multicenter phase II trial of paclitaxel for malignant ascites
secondary to advanced/recurrent gastric cancer. Gastric Cancer.
14:81–90. 2011. View Article : Google Scholar : PubMed/NCBI
|
|
11
|
Ishiguro T, Kumagai Y, Baba H, Tajima Y,
Imaizumi H, Suzuki O, Kuwabara K, Matsuzawa T, Sobajima J, Fukuchi
M, et al: Predicting the amount of intraperitoneal fluid
accumulation by computed tomography and its clinical use in
patients with perforated peptic ulcer. Int Surg. 99:824–829. 2014.
View Article : Google Scholar : PubMed/NCBI
|
|
12
|
Pugh RN, Murray-Lyon IM, Dawson JL,
Pietroni MC and Williams R: Transection of the oesophagus for
bleeding oesophageal varices. Br J Surg. 60:646–649. 1973.
View Article : Google Scholar : PubMed/NCBI
|
|
13
|
Kamath PS, Wiesner RH, Malinchoc M,
Kremers W, Therneau TM, Kosberg CL, D'Amico G, Dickson ER and Kim
WR: A model to predict survival in patients with end-stage liver
disease. Hepatology. 33:464–470. 2001. View Article : Google Scholar : PubMed/NCBI
|
|
14
|
Kamath PS and Kim WR: Advanced Liver
Disease Study Group: The model for end-stage liver disease (MELD).
Hepatology. 45:797–805. 2007. View Article : Google Scholar : PubMed/NCBI
|
|
15
|
Peng Y, Qi X, Dai J, Li H and Guo X:
Child-Pugh versus MELD score for predicting the in-hospital
mortality of acute upper gastrointestinal bleeding in liver
cirrhosis. Int J Clin Exp Med. 8:751–757. 2015.PubMed/NCBI
|
|
16
|
Barakat AA, Metwaly AA, Nasr FM,
El-Ghannam M, El-Talkawy MD and Taleb HA: Impact of hyponatremia on
frequency of complications in patients with decompensated liver
cirrhosis. Electron Physician. 7:1349–1358. 2015.PubMed/NCBI
|
|
17
|
Kim WR, Biggins SW, Kremers WK, Wiesner
RH, Kamath PS, Benson JT, Edwards E and Therneau TM: Hyponatremia
and mortality among patients on the liver-transplant waiting list.
N Engl J Med. 359:1018–1026. 2008. View Article : Google Scholar : PubMed/NCBI
|
|
18
|
Maeda H, Kobayashi M and Sakamoto J:
Evaluation and treatment of malignant ascites secondary to gastric
cancer. World J Gastroenterol. 21:10936–10947. 2015. View Article : Google Scholar : PubMed/NCBI
|
|
19
|
Italian Association for the Study of the
Liver (AISF); Italian Society of Transfusion Medicine and
Immunohaematology (SIMTI): AISF-SIMTI position paper: The
appropriate use of albumin in patients with liver cirrhosis. Dig
Liver Dis. 48:4–15. 2016. View Article : Google Scholar : PubMed/NCBI
|
|
20
|
Campillo B, Richardet JP, Scherman E and
Bories PN: Evaluation of nutritional practice in hospitalized
cirrhotic patients: Results of a prospective study. Nutrition.
19:515–521. 2003. View Article : Google Scholar : PubMed/NCBI
|
|
21
|
Garcia-Martinez R, Caraceni P, Bernardi M,
Gines P, Arroyo V and Jalan R: Albumin: Pathophysiologic basis of
its role in the treatment of cirrhosis and its complications.
Hepatology. 58:1836–1846. 2013. View Article : Google Scholar : PubMed/NCBI
|