Introduction
Prostate cancer (PCa) is one of the most common
types of cancer and the second leading cause of cancer related
mortality in males in the United States (1). The incidence of PCa in China is
increasing due to the ageing population and western culture
(2).
Current PCa screening tools used, include the
detection of increased levels of serum prostate specific antigen
and digital rectal examination, however, the two methods are
limited in accuracy in diagnosing PCa and the evaluation of
aggressiveness (3). To date, the
most effective technique for localizing and staging prostate cancer
is magnetic resonance imaging (MRI). MRI provides excellent
high-contrast and high-resolution morphological images of the human
prostate (3). The guidelines for
routine diagnosis and treatment of prostate disease outlined by the
European Society of Urogenital Radiology currently recommend
examination by prostate multi-parametric MRI, including the uses of
T1-weighted imaging (T1WI), T2-weighted imaging (T2WI) and
diffusion-weighted imaging (DWI) (4,5).
Preoperative evaluation of PCa aggressiveness is a prerequisite to
offer personalized treatment options. The Gleason score acquired
from biopsy or surgery on the prostate is important for the
evaluation of PCa aggressiveness, selection of clinical treatment
options and assessment of prognosis (6). Several studies have investigated the
correlation between the apparent diffusion coefficient (ADC) value
obtained from the DWI sequence and Gleason score noninvasively,
however a consensus is yet to be reached on this (7–9).
Diffusion tensor imaging (DTI) is a novel and
promising technique with wide clinical applications, especially in
neuro-and musculoskeletal imaging. DTI can provide ADC and
fractional anisotropy (FA) values and diffusion tensor tractography
(DTT), which may reflect physiological features and pathological
changes at microscopic level (10).
The clinical application of DTI of the prostate has been confirmed
by several studies (11,12).
The present study aimed to explore the correlation
of ADC and FA values, and DTT, with the Gleason score for the
prediction of PCa pathological grading, in order to improve
selection of an appropriate treatment and assessment of patient
prognosis.
Materials and methods
Clinical data
A retrospective analysis of 50 patients with PCa,
diagnosed by biopsy or surgical pathology diagnosis between June
2013 and December 2015 at Taizhou People's Hospital (Taizhou,
China) was conducted. Patients were 43–88 years old (72.8±7.98
years), with 1.74–169.35 ng/ml prostate-specific antigen (normal
reference range, 0–4 ng/ml). The symptoms of these patients
included dysuria, hematuria and hematospermia. The inclusion
criteria for patients in the current study were as follows: i)
Conventional MRI and DTI scanning was performed without puncture,
cryotherapy, radiotherapy and chemotherapy or endocrine therapy;
and ii) transrectal ultrasound guide biopsy or surgical resection
was conducted within 2 weeks of MRI examination. Written informed
consent was obtained from all participants prior to the
investigation.
Inspection methods
At 1 day before examination, low residue diet and
oral laxatives were administered in the evening in order to clean
the intestinal track and allow for adequate bladder filling. Axis
T1WI, T2WI-fat suppression (FS) and DTI scans regarding the
prostate were performed using a 3.0 T MRI scanner (Siemens AG,
Munich, Germany) with 8-channel phased array coil.
The axial T1WI scanning parameters were as follows:
Repetition time (TR), 140 msec; echo time (TE), 2.46 msec; field of
view (FOV), 230×230 mm; matrix, 288×320; layer thickness, 3.0 mm;
no spacing; number of layers, 20; flip angle, 70°; acquisition
time, 29 sec. The axial T2WI-FS scanning parameters were as
follows: TR, 3540 msec; TE, 124 msec; FOV, 230×230 mm; matrix,
230×288; layer thickness, 3.0 mm; no spacing; number of layers, 20;
flip angle, 150°; signal-to-noise ratio (SNR), 1; averages, 3;
acquisition time, 177 sec.
DTI was performed with a single-shot EPI technique
using the following parameters: TR, 3,000 msec; TE, 93 msec; FOV,
230×230 mm; matrix, 230×128 mm; slice thickness, 3.0 mm; no
spacing, number of layers, 20. The diffusion gradients were applied
in 12 directions with two b values of 0 and 800 s/mm2.
The acquisition time of DTI was approximately 4 min 5 sec. Axial
T2WI-FS images were used as anatomical and morphological
orientation for DTI analysis.
Data analysis and image
processing
Following data acquisition, all of the images were
transmitted to the digital workstation [Syngo MultiModality
Workplace (SMMW); Siemens AG, Munich, Germany]. The DWI map is auto
obtained following scanning. The calculation of the FA and ADC
values and DTT image processing were performed using Neuro 3D
software included in the SMMW. The region of interest (ROI) was
drawn in the area of PCa on T2WI-FS confirmed by biopsy or surgery.
The ROIs on T2WI-FS were automatically transferred onto the
co-registered FA and ADC maps constructed from DTI. Two
radiologists with extensive experience in MRI diagnosis drew all of
the ROIs. While drawing ROI's, great care was taken to include the
entire lesion and exclude bleeding and calcification. Each ROI was
scanned three times, and the average value was used as the final FA
and ADC value.
Gleason score analysis
Gleason score analysis was used to evaluate the
prognosis of patients with prostate cancer using samples from a
prostate biopsy or surgery based on the microscopic appearance. A
total score was calculated based on how cells looked under a
microscope, with half the score based on the appearance of the most
common cell morphology (scored 1–5) and the other half based on the
appearance of the second most common cell morphology (scored 1–5).
These two numbers were then combined to produce a total score for
the cancer. Gleason scores ranged from 2–10, with higher numbers
indicating higher aggression and poorer prognosis (6).
Statistical analysis
An IBM SPSS 19.0 (IBM Corp, Armonk, NY, USA)
software package was used for data processing and statistical
analysis. Pearson correlation analysis was conducted in order to
determine whether there was a correlation of the FA and ADC values
of PCa with the Gleason scores of the lesions. Measurement data are
presented as the mean ± standard deviation. P<0.05 was
determined to indicate statistically significant difference.
Results
Features of FA, ADC, DWI and DTT map
of PCa at different disease grades
Among the 50 cases of PCa, 26 cases presented with
Gleason scores of ≤6, 13 cases presented with a Gleason score of 7
and 11 cases had Gleason scores of ≥8; these patients were grouped
into low-, intermediate- and high-grade groups, respectively. The
T2WI-FS image presented the clearest anatomical information,
revealing that the lesion was confined to the outer peripheral area
of the prostate in 8 cases, confined to the central gland area in 5
cases, located through the prostate capsule in 32 cases and
simultaneously involved the peripheral and central gland region in
5 cases. In addition, 15 cases of lymph node and bone metastasis
were observed. PCa lesions in the FA maps were presented as a mixed
signal, a low signal in the ADC maps and a high signal in the DWI
maps. According to the DTT maps, the PCa fiber bundle was
interrupted in 6 cases of the high-grade group, but not interrupted
in the low-grade and intermediate-grade groups. The characteristic
features of the different groups according to the FA, ADC, DWI and
DTT maps are presented in Table I
and Figs. 1–3.
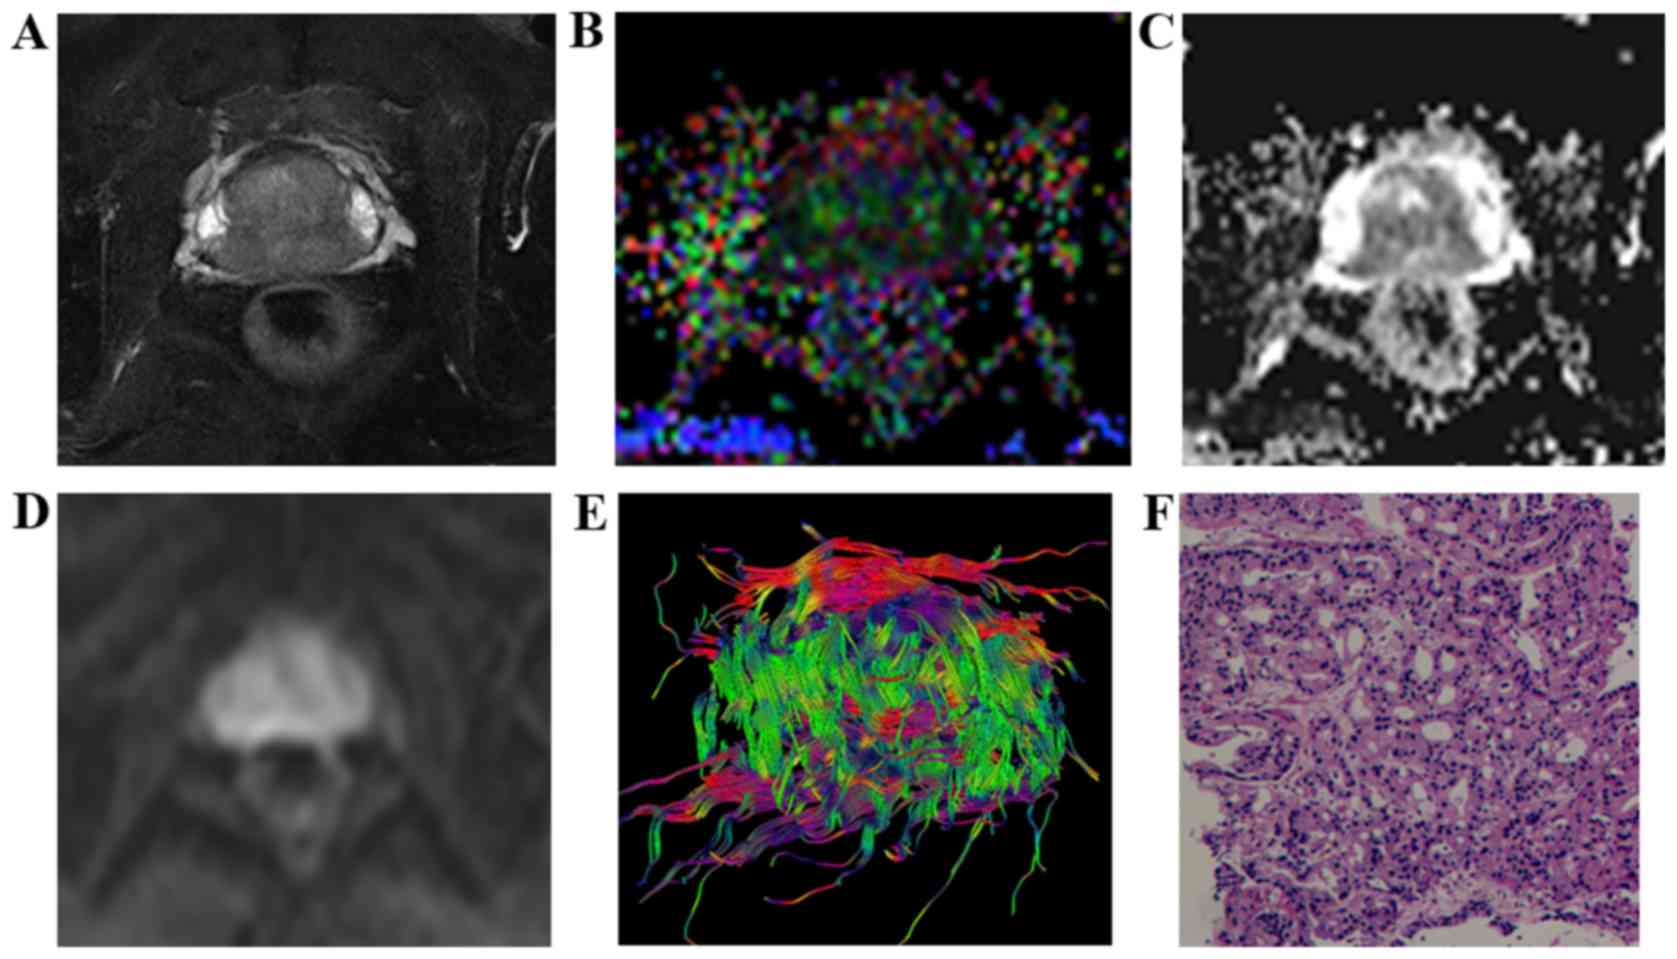 | Figure 1.Characteristic signs and pathological
comparison of T2WI-FS, FA, ADC, DWI and DTT maps in the low-grade
group in a 65-year-old patient (prostate-specific antigen level,
27.33 ng/ml). (A) T2WI-FS indicated that the prostatic central
gland zones and the rear part of the surrounding area exhibited a
low signal. (B) FA map indicated lesions with mixed high signal (FA
value, 0.269). (C) ADC map indicating lesions under homogeneous low
signal (ADC value, 1.032×10⁻³ mm2/sec). (D)
DWI revealed lesions with a slightly high signal. (E) DTT
demonstrated that the fiber bundle was dense, orderly arranged and
had no evident disruption. (F) Pathologic analysis indicated
presence of prostate cancer (hematoxylin and eosin staining;
magnification, ×100; Gleason score, 3+3=6). T2WI, T2-weighted
imaging; FA, fractional anisotropy; ADC, apparent diffusion
coefficient; DWI, diffusion-weighted imaging; DTT, diffusion tensor
tractography. |
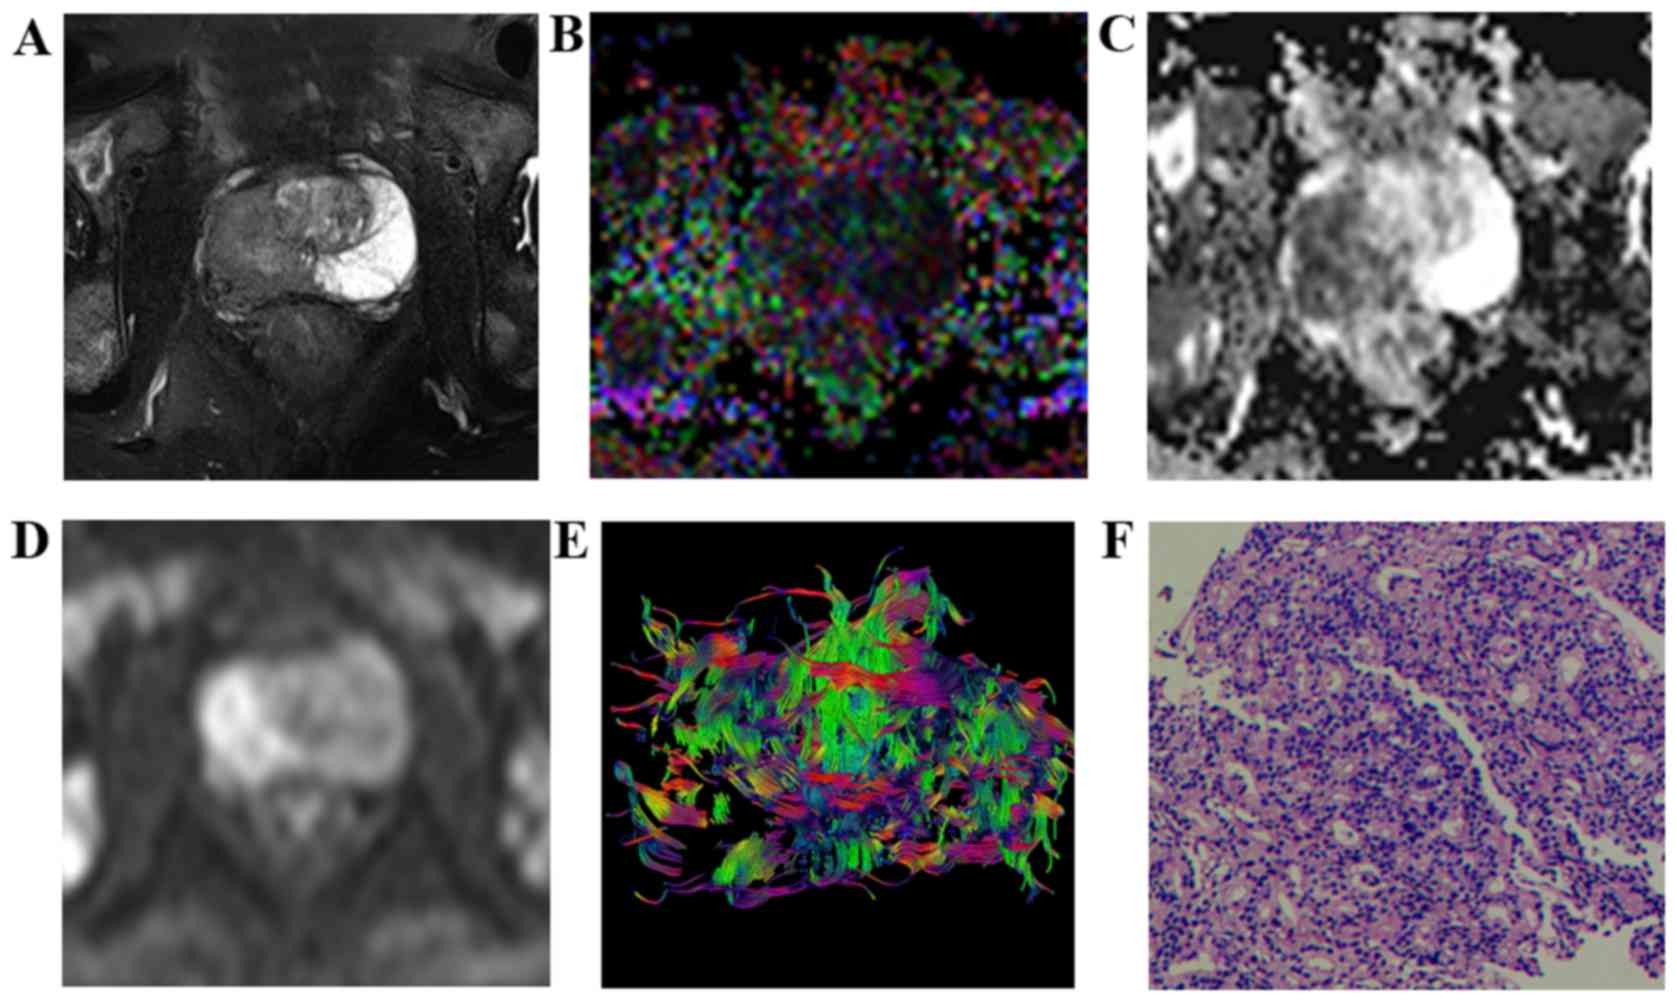 | Figure 3.Characteristic signs and pathological
comparison of T2WI-FS, FA, ADC, DWI, and DTT maps in the high-grade
group in a 73-year-old patient (prostate-specific antigen, 70.59
ng/ml). (A) T2WI-FS indicated a tumor on the right side of the
prostate peripheral zone with a lower signal compared with the
contralateral, and bilateral acetabulum bone metastasis. (B) FA map
indicated a lesion area with a mixed high signal (FA value, 0.338).
(C) ADC map indicated lesions with a low signal (ADC value,
0.776×10⁻³ mm2/sec. (D) DWI indicated lesions
with a high signal. (E) DTT map displays disorder, interruption and
deletion in the cancer foci area fiber bundles. (F) Pathological
analysis indicated prostate cancer (hematoxylin and eosin;
magnification, ×100; Gleason score, 4+5=9). T2WI, T2-weighted
imaging; FA, fractional anisotropy; ADC, apparent diffusion
coefficient; DWI, diffusion-weighted imaging; DTT, diffusion tensor
tractography. |
 | Table I.Features of FA, ADC, DWI and DTT maps
of prostate cancer at different grades of the disease. |
Table I.
Features of FA, ADC, DWI and DTT maps
of prostate cancer at different grades of the disease.
| Group | FA | ADC | DWI | DTT |
|---|
| Low grade | Hybrid high
signal | Low signal | Slightly high
signal | Fiber bundles in the
cancer region were densely arranged and without interruption. |
| Intermediate
grade | Hybrid high
signal | Low signal | Medium high
signal | Fibrous bundle
arrangement disorder, sparse |
| High grade | Hybrid high
signal | Low signal | High signal | Fiber bundle
disruption and deletion in cancer foci |
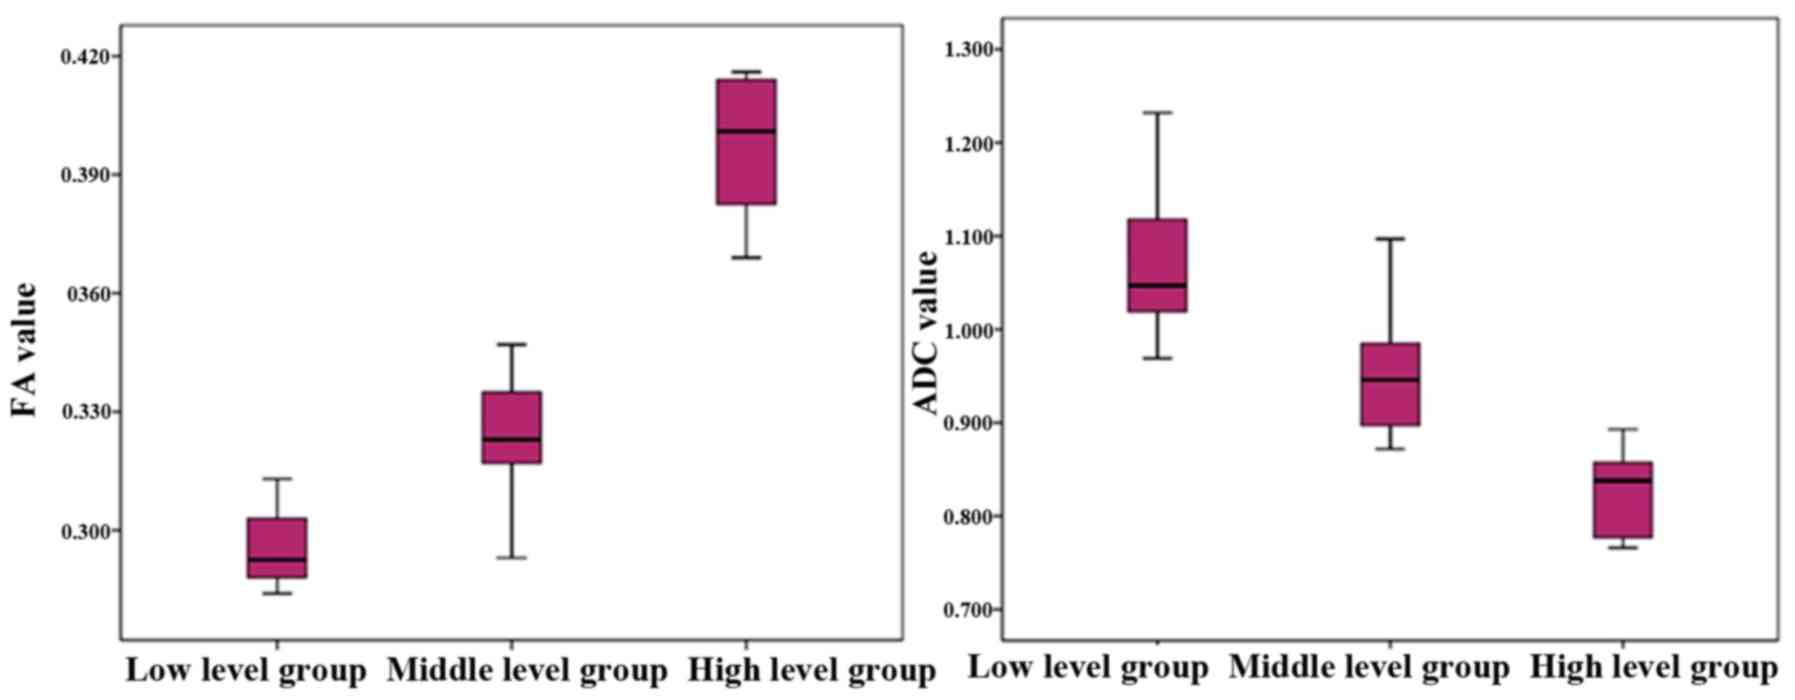
Association of FA and ADC values with
the Gleason score in different groups
The FA and ADC values of the different groups are
presented in Table II. FA values of
the low-, intermediate- and high-grade groups were 0.284±0.313,
0.293±0.347 and 0.369±0.347. Differences between the groups were
statistically significant (F=234.533; P<0.05). In addition, the
FA value was positively correlated with Gleason classification
(r=0.884; P<0.05), suggesting that the FA value increased with
an increasing disease grade and Gleason score (Fig. 4).
| Table II.FA and ADC values of prostate cancer
in the different groups (×10−3 mm2/sec). |
Table II.
FA and ADC values of prostate cancer
in the different groups (×10−3 mm2/sec).
| Group | FA value | ADC value |
|---|
| Low grade | 0.284±0.313 | 1.070±0.072 |
| Intermediate
grade | 0.293±0.347 | 0.961±0.081 |
| High grade | 0.369±0.347 | 0.821±0.048 |
| F-value | 234.533 | 49.987 |
| P-value | <0.05a,b,c | <0.05a,b,c |
ADC values of the low-, intermediate- and high-grade
groups were 1.070±0.072×10⁻³,
0.961±0.081×10⁻³ and 0.821±0.048×10⁻³,
respectively, and the differences between the three groups were
statistically significant (F=49.987; P<0.05); Furthermore, the
ADC value was negatively correlated with the Gleason grading
(r=−0.810; P<0.05), indicating that the ADC value decreased when
the cancer grade increased (Fig.
4).
Discussion
DTI is a type of DWI based on a novel functional MRI
technique, which accurately describes the diffusion path of water
molecules in the three-dimensional space, and facilitates the
quantitative evaluation, at the cellular and molecular levels, of
the pathological and physiological changes occurring in tissues
(13,14). This technique is widely used for
imaging in the central nervous system and skeletal muscle system
(15,16); however, the use of DTI for the
diagnosis, classification and evaluation of PCa remains unknown
(17–19).
With the increase of Gleason score of the lesion,
decreased differentiation of tumor cells is observed and tumors
with a higher score have closely arranged cells (6). In the current study, PCa foci in the
T2WI-FS images presented as low signal, whereas tumors in 15 cases
from the low-grade group exhibited the phenomenon of a local high
signal as the remnants of a few glandular structures mixed in with
the low signal background. In the high-grade group, this phenomenon
was not observed. FA maps revealed a mixed blue/green signal and
there were no evident differences between the groups. ADC values
and DWI are used to determine the grades of PCa foci (19). The findings of the present study
suggested that, with an increase in the Gleason score of the tumor,
the ADC value gradually decreased and the DWI map signal gradually
increased. These changes may be due to the increasingly dense
arrangement of cells in higher grade tumors, as well as the
decrease of the extracellular space. In the DTT map, the fiber
tracts in the low-grade and intermediate-grade groups demonstrated
sparse and irregular distribution, with no marked disruption, while
6 cases in the high-grade group presented with marked disruption of
the fiber bundle. Thus, it can be inferred that the low and
intermediate grades of PCa exhibit low aggression and the high
grade of PCa may invade adjacent tissue. Takayama et al
(20) observed that the fiber
bundles of PCa were deformed but with no evident disruption.
Gleason score serves an important role in predicting
the extent of tumor invasion, lymph node and distant metastasis and
patient outcomes (8). Currently,
clinical Gleason scoring is performed in PCa specimens obtained by
surgical resection or biopsy. Furthermore, the correlation between
DTI and Gleason scores has been explored by measuring FA and ADC
values, which may be beneficial in predicting the malignant degree
of the tumor (20).
Previous study by Woodfield et al (21) revealed that there was a significant
negative correlation of ADC value with Gleason score in PCa; namely
with increasing Gleason score, ADC values gradually decreased. In
addition, Li et al (22)
reported that for PCa Gleason scores ≤3+3, 3+4, 4+3 and ≥4+4, ADC
values were 1.11±0.16×10⁻³, 0.98±0.14×10⁻³,
0.91±0.13×10⁻³ and 0.84±0.131×10⁻³
mm2/sec, respectively, indicating a gradual reduction.
The results of the present study were consistent with these
aforementioned findings. So far, few studies have investigated the
correlation between FA value of PCa and Gleason score. The results
of Li et al (22) for Gleason
scores of PCa of 3+3, 3+4, 4+3 and 4+4 indicated FA values of
0.26±0.04, 0.29±0.03, 0.30±0.03 and 0.33±0.04, respectively; thus,
FA values were found to be positively associated with Gleason
scores. In addition, Gong et al (23) and Wang et al (24) indicated that FA values and Gleason
scores were negatively correlated, suggesting that an increase in
Gleason scores would cause a gradual reduction in FA value. The
main factors affecting the FA values are as follows: i) Following
an increase in Gleason scores, the proliferation of mesenchymal
structure of fibers and more closely arranged cells are observed,
resulting in higher FA values; and ii) following an increase in
Gleason score, the cell carcinoma is poorly differentiated, atypia
increases and erosion of the fibrous tissue structure is enhanced,
resulting in fiber breakage, as well as disorganized and restricted
water diffusion, thus leading to decreased FA values. The
aforementioned studies (23,24) demonstrated that the second factor
served a leading role, thus reducing the FA value. However, the
results of the present study were consistent with those from Li
et al (22). We hypothesize
that the first factor affecting the FA value had a greater impact;
the freedom of movement of water molecules was restricted and
although prostate inherent normal fiber bundles were destroyed,
this led to more freedom of movement of water molecules, but very
little impact, therefore, higher FA values were observed in
patients with higher Gleason grades. Although studies have reported
that the ADC and FA values of PCa tumors are correlated with the
Gleason grade, conflicting results exist. The use of ADC and FA
values to predict the malignancy degree of the tumor requires
further investigation in large-scale studies (22–24).
The present study had some limitations. The
application of DTT for the diagnosis of PCa was conducted at
different research institutions with the use of equipment produced
by different companies and different scanning parameters, which may
affect the consistency of the results. Therefore, it is critical
that the method used for DTT for diagnosis is standardized. DTT
only provides visual information; quantitative measurements and
statistical analyses are not available. Thus, it is not possible to
accurately judge the reasons for fiber bundle damage, such as
direct tumor invasion, tumor compression or vasogenic edema. DTT
maps mainly present the interstitial structure, not the glandular
and glandular tube structure, resulting in limitations in the use
of this technique.
In conclusion, the present study combined
quantitative parameter values (FA and ADC values) and parametric
diagrams (FA, ADC, DWI and DTT maps), which fully revealed the
correlation of FA and ADC values with the Gleason score of PCa.
These values may be used to assess PCa invasiveness and prognosis,
allowing the development of a clinical individualized treatment
plan.
Acknowledgements
The present study was supported by grants from the
Scientific Research Project of Jiangsu Provincial Commission of
Health (grant no. H201262), the Suzhou Science and Technology
Development Plan (grant no. SS201534) and Clinical Special Disease
Diagnosis and Treatment Technology in Suzhou (grant no.
LCZX201406).
References
|
1
|
Siegel RL, Miller KD and Jemal A: Cancer
statistics, 2017, CA Cancer J Clin. 67:1–30. 2017.
|
|
2
|
Wang YJ, Fu ZX, Wang J, et al: Incidence
and mortality of prostate cancer among residents in Luwan district
of Shanghai, 2004–2011. Chin Cancer. 26:438–441. 2017.
|
|
3
|
Heidenreich A, Bastian PJ, Bellmunt J,
Bolla M, Joniau S, van der Kwast T, Mason M, Matveev V, Wiegel T,
Zattoni F, et al: EAU guidelines on prostate cancer Part 1
Screening, diagnosis, and local treatment with curative intent
update 2013. Eur Urol. 65:124–137. 2014. View Article : Google Scholar : PubMed/NCBI
|
|
4
|
Chinese Journal of Radiology in the
diagnosis of prostatic diseases, Chinese Journal of Radiology,
editorial board of the Chinese Journal of radiology: MR examination
and diagnosis of prostate cancer. Chin J Radiol. 48:531–534.
2014.
|
|
5
|
Bazot M, Bharwani N, Huchon C, Kinkel K,
Cunha TM, Guerra A, Manganaro L, Buñesch L, Kido A, Togashi K, et
al: European society of urogenital radiology (ESUR) guidelines: MR
imaging of pelvic endometriosis. Eur Radiol. 27:2765–2775. 2017.
View Article : Google Scholar : PubMed/NCBI
|
|
6
|
Liao LH, Wang SH and Shen JH: The
formation, development and application of Gleason grading system
for prostate cancer. J Diag Pathol. 19:309–312. 2012.
|
|
7
|
Kagebayashi Y, Nakai Y, Matsumoto Y, Samma
S, Miyasaka T and Nakagawa H: Utility of diffusion-weighted
magnetic resonance imaging and apparent diffusion coefficient in
detection of prostate cancer and prediction of pathological Gleason
score. Hinyokika Kiyo. 58:405–408. 2012.(In Japanese). PubMed/NCBI
|
|
8
|
Wu CJ, Wang Q, Li H, Wang XN, Liu XS, Shi
HB and Zhang YD: DWI-associated entire-tumor histogram analysis for
the differentiation of low-grade prostate cancer from
intermediate-high-grade prostate cancer. Abdom Imag. 40:3214–3221.
2015. View Article : Google Scholar
|
|
9
|
Caivano R, Rabasco P, Lotumolo A, Cirillo
P, D'Antuono F, Zandolino A, Villonio A, Macarini L, Salvatore M
and Cammarota A: Comparison between Gleason score and apparent
diffusion coefficient obtained from diffusion-weighted imaging of
prostate cancer patients. Cancer Invest. 31:625–629. 2013.
View Article : Google Scholar : PubMed/NCBI
|
|
10
|
Bammer R, Acar B and Moseley ME: In vivo
MR tractography using diffusion imaging. Eur J Radiol. 45:223–234.
2003. View Article : Google Scholar : PubMed/NCBI
|
|
11
|
Sinha S and Sinha U: In vivo diffusion
tensor imaging of the human prostate. Magn Reson Med. 52:530–537.
2004. View Article : Google Scholar : PubMed/NCBI
|
|
12
|
Gibbs P, Pickles MD and Turnbull LW:
Diffusion imaging of the prostate at 3.0 tesla. Invest Radiol.
41:185–188. 2006. View Article : Google Scholar : PubMed/NCBI
|
|
13
|
Basser PJ, Mattiello J and LeBihan D: MR
diffusion tensor spectroscopy and imaging. Biophys J. 66:259–267.
1994. View Article : Google Scholar : PubMed/NCBI
|
|
14
|
Le Bihan D, Mangin JF, Poupon C, Clark CA,
Pappata S, Molko N and Chabriat H: Diffusion tensor imaging:
Concepts and applications. J Magn Reson Imaging. 13:534–546. 2001.
View Article : Google Scholar : PubMed/NCBI
|
|
15
|
Wang S, Kim SJ, Poptani H, Woo JH, Mohan
S, Jin R, Voluck MR, O'Rourke DM, Wolf RL, Melhem ER and Kim S:
Diagnostic utility of diffusion tensor imaging in differentiating
glioblastomas from brain metastases. AJNR Am J Neuroradiol.
35:928–934. 2014. View Article : Google Scholar : PubMed/NCBI
|
|
16
|
Schenk P, Siebert T, Hiepe P, Güllmar D,
Reichenbach JR, Wick C, Blickhan R and Böl M: Determination of
three-dimensional muscle architectures: Validation of the DTI-based
fiber tractography method by manual digitization. J Anat.
223:61–68. 2013. View Article : Google Scholar : PubMed/NCBI
|
|
17
|
Gürses B, Tasdelen N, Yencilek F,
Kılıckesmez NO, Alp T, Fırat Z, Albayrak MS, Uluğ AM and Gürmen AN:
Diagnostic utility of DTI in prostate cancer. Eur J Radiol.
79:172–176. 2011. View Article : Google Scholar : PubMed/NCBI
|
|
18
|
Gürses B, Kabakci N, Kovanlikaya A, Firat
Z, Bayram A, Uluğ AM and Kovanlikaya I: Diffusion tensor imaging of
the normal prostate at 3 Tesla. Eur Radiol. 18:716–721. 2008.
View Article : Google Scholar : PubMed/NCBI
|
|
19
|
Xia G, Gong H, Zeng X, et al: MR diffusion
tensor imaging in the diagnosis of prostate cancer. Chin J Radiol.
46:526–528. 2012.
|
|
20
|
Takayama Y, Kishimoto R, Hanaoka S, Nonaka
H, Kandatsu S, Tsuji H, Tsujii H, Ikehira H and Obata T: ADC value
and diffusion tensor imaging of prostate cancer: Changes in
carbon-ion radiotherapy. J Magne Resonance Imag. 27:1331–1335.
2008. View Article : Google Scholar
|
|
21
|
Woodfield CA, Tung GA, Grand DJ, Pezzullo
JA, Machan JT and Renzulli JF II: Diffusion-weighted MRI of
peripheral zone prostate cancer: Comparison of tumor apparent
diffusion coefficient with Gleason score and percentage of tumor on
core biopsy. AJR Am J Roentgenol. 194:W316–W322. 2010. View Article : Google Scholar : PubMed/NCBI
|
|
22
|
Li L, Margolis DJ, Deng M, Cai J, Yuan L,
Feng Z, Min X, Hu Z, Hu D, Liu J and Wang L: Correlation of gleason
scores with magnetic resonance diffusion tensor imaging in
peripheral zone prostate cancer. J Magn Reson Imaging. 42:460–467.
2015. View Article : Google Scholar : PubMed/NCBI
|
|
23
|
Gong T, Yuan SH, Li LL, et al: Study on
the correlation between prostate cancer DTI parameters and Gleason
score. Med Imag J. 24:574–577. 2014.
|
|
24
|
Wang Q, Gong T and Wang XZ: 3.0T diffusion
tensor imaging in the evaluation of prostate cancer Gleason score
value. J Clin Radiol. 34:581–585. 2015.
|