Introduction
Hepatocellular carcinoma (HCC) is one of the most
challenging malignant tumors, with a high morbidity and mortality
in China (1,2). Although progress has been made in
surgery (transplant, embolization or resection); radiation therapy,
chemotherapy and ablation, tumor recurrence and metastasis remain
difficult to treat (3). Therefore,
investigations into the molecular mechanism of recurrence and
metastasis of HCC, and less invasive but more effective therapeutic
methods for clinical HCC treatment are required.
Immunotherapy has been applied in the treatment of
HCC in early clinical trials due to its characteristics: Systemic,
nontoxic and long-lived anti-tumor activity (4). Previous studies have demonstrated that
the tumor microenvironment may be established by the regulation of
lymphocytes, and then serves a vital role in the progression of
tumors through immunity and inflammation (5,6). It is
well known that cluster of differentiation
(CD)4+CD25+ regulatory T cells (Tregs)
contribute to the growth of malignant tumors through suppressing
immune surveillance (7). Forkhead
family transcription factor P3 (Foxp3) is specifically expressed in
Tregs and serves an important role in the negative immunoregulatory
function of Tregs in mice and humans (8,9). A
previous study has indicated that in murine tumor models,
downregulated Foxp3 inhibits the tumor growth of
CD4+CD25+ Tregs, as observed in leukemia
(10). Other studies have
demonstrated an increased expression of
CD4+CD25+ Tregs in patients with HCC
(11,12). However, the effects of a Foxp3
knockdown on the function of CD4+CD25+ Tregs
and the development of HCC remain to be elucidated.
Currently, the application of ultrasound-targeted
microbubble destruction (UTMD) for gene delivery has become a focus
of research due to its low immunogenic, non-invasive, targeted and
high-efficiency characteristics (13,14).
UTMD has been demonstrated to efficiently deliver genes to cells,
myocardium and solid tumors (15–17). In
the present study, the expression of Foxp3 was downregulated
through UTMD-mediated delivery of Foxp3-microRNA (miRNA) and
Foxp3-short hairpin RNA (shRNA) in CD4+CD25+
Tregs to a HCC mice model, respectively. Whether Foxp3 knockdown
was able to inhibit the negatively immunoregulatory function of
CD4+CD25+ Tregs and suppress the tumor growth
of HCC through improving the immune microenvironment was then
assessed.
Materials and methods
Patients
The current study recruited a total of 50 patients
(28–76 years; male/female, 41/9; 63.77–83.25 kg) with HCC at The
First Affiliated Hospital of Harbin Medical University (Harbin,
China) from October 2013 to May 2014. The inclusion criteria were
as follows: i) All patients were newly diagnosed with TNM stage
I–II cancer (18) and did not accept
any treatment; ii) patients had no other organic disease with the
exception of hepatic pathological changes; and iii) patients had
elevated levels of alphafetoprotein and aminotransferase
(diagnostic indicators for hepatocellular carcinoma). Approval from
the Ethics Committee of The First Affiliated Hospital of Harbin
Medical University was obtained and written informed consent was
received from all patients.
Separation of peripheral blood
mononuclear cells, CD4+ CD25+ Tregs and
CD4+CD25− T cells
Initially, venous blood (40–60 ml) was collected
aseptically from patients with HCC, and diluted with the same
volume of phosphate buffered saline. The diluted blood samples were
slowly added on the liquid surface of lymphocyte isolation medium
(Shaanxi Haoyang Biological Technology Co., Ltd., Xi'an, China) at
a ratio of 1:1, and peripheral blood mononuclear cells (PBMCs) were
separated by centrifugation (700 × g for 25 min at 25°C).
Subsequently, CD4+CD25+ Tregs and
CD4+CD25− T cells were sorted from PBMCs
using CD4+CD25+ Tregs magnetic bead
separation kit (Miltenyi Biotec GmbH, Bergisch Gladbach, Germany)
following the manufacturer's protocol. The sorted
CD4+CD25+ Tregs or
CD4+CD25− T cells (1×10⁷/ml, 0.1
ml) were co-stained with anti-CD4 fluorescein isothiocyanate
(FITC)-conjugated and anti-CD25 phycoerythrin (PE)-conjugated
antibodies (10 µg/ml; cat. nos. 555346 and 555432; BD Biosciences,
Franklin Lakes, NJ, USA) for 30–40 min at room temperature away
from light. Cells were washed with PBS, and samples were fixed in
1% formaldehyde solution at 4°C for 1 h and detected by FACSCria
(BD Biosciences). Finally, the data were analyzed by FACSDiva
software (version 4.1; BD Biosciences), and the purity of the
CD4+CD25+ Tregs and
CD4+CD25− T cells was detected at
>90%.
Construction of Foxp3-miRNA and
Foxp3-shRNA expression plasmids
A specific miRNA sequence targeted to human Foxp3
(GenBank Accession No. NM_50943; https://www.ncbi.nlm.nih.gov/gene/?term=50943) and a
control miRNA sequence (Table I)
were designed and chemically synthesized by Invitrogen (Thermo
Fisher Scientific, Inc., Waltham, MA, USA). Double-stranded DNA
oligonucleotides corresponding to miRNA were obtained by the
annealing of two corresponding oligomeric single-strand DNA at 95°C
for 5 min and inserted into pcDNA6.2-GW/EmGFP-miR vector
(Invitrogen; Thermo Fisher Scientific, Inc.). A specific shRNA
sequence targeted to mouse Foxp3 (Table
I) was designed by Shanghai GenePharma Co., Ltd. (Shanghai,
China) and cloned into the pGPU6/GFP/Neo vector (Invitrogen; Thermo
Fisher Scientific, Inc.). Ultimately, the recombinant plasmid
Foxp3-miRNA and Foxp3-shRNA were successfully constructed.
 | Table I.miRNA and shRNA sequences of
Foxp3. |
Table I.
miRNA and shRNA sequences of
Foxp3.
| RNA type | Sequence
(5′-3′) |
|---|
| miRNA-Foxp3 | F:
TGCTGCACAGATGAAGCCTTGGTCAGGTTTTGGCCACTGACTGACCTGACCAACTTCATCTGTG |
|
| R:
CCTGCACAGATGAAGTTGGTCAGGTCAGTCAGTGGCCAAAACCTGACCAAGGCTTCATCTGTGC |
| miRNA-Foxp3-NC | F:
TGCTGAAATGTACTGCGCGTGGAGACGTTTTGGCCACTGACTGACGTCTCCACGCAGTACATTT |
|
| R:
CCTGAAATGTACTGCGTGGAGACGTCAGTCAGTGGCCAAAACGTCTCCACGCGCAGTACATTTC |
| shRNA-Foxp3 | F:
CACCGAGGCAGAGGACACTCAATGATTCAAGAGATCATTGAGTGTCCTCTGCCTCTTTTTTG |
|
| R:
AATTCAAAAAAGAGGCAGAGGACACTCAATGATCTCTTGAATCATTGAGTGTCCTCTGCCTCG |
| shRNA-Foxp3-NC | F:
CACCGTTCTCCGAACGTGTCACGTCAAGAGATTACGTGACACGTTCGGAGAATTTTTTG |
|
| R:
AATTCAAAAAAGTTCTCCGAACGTGTCACGCTCTTGAATTACGTGACACGTTCGGAGAACG |
Preparation of microbubble
SonoVue powder (Bracco, Milan, Italy) was dissolved
in 5 ml normal saline. Following 5 min oscillation, microbubbles
were evenly distributed. Microbubbles with a density of
2×10⁸-5×10⁸/ml, diameter of 2.5–6.0 µm and
concentration of 5 mg/ml were observed under a light microscope
(Olympus Corporation, Tokyo, Japan).
Cell transfection and grouping
Tregs with a concentration of 1×10⁶/ml
were resuspended in serum-free RPMI-1640 medium (Gibco; Thermo
Fisher Scientific, Inc.), and 1.5–2×10⁵ cells were
seeded into each well of a 96-well plate (Corning Incorporated,
Corning, NY, USA). Then, the cells were divided into 7 groups as
follows: i) Control group, 90 µl medium + 10 µl control plasmid;
ii) SonoVue microbubbles + Foxp3-miRNA plasmid (MB + P) group, 80
µl medium + 20 µl mixture of microbubbles and Foxp3-miRNA plasmid
(1:1); iii) ultrasound + Foxp3-miRNA plasmid (US + P) group, 90 µl
medium + 10 µl Foxp3-miRNA plasmid with ultrasonic irradiation; iv)
ultrasound + SonoVue microbubbles + Foxp3-miRNA plasmid (US + MB +
P) group, 80 µl medium + 20 µl mixture of microbubbles and
Foxp3-miRNA plasmid (1:1) with ultrasonic irradiation; v)
Lipofectamine® 2000 (Invitrogen; Thermo Fisher
Scientific, Inc.) + Foxp3-miRNA plasmid (L + P) group, 90 µl medium
+ 10 µl Foxp3-miRNA plasmid + 1 µl Lipofectamine® 2000;
vi) Ultrasound + Lipofectamine2000 + Foxp3-miRNA plasmid (US + L +
P) group, 90 µl medium + 10 µl Foxp3-miRNA plasmid + 1 µl
Lipofectamine2000 with ultrasonic irradiation; vii) Ultrasound +
SonoVue microbubbles + Lipofectamine 2000 + Foxp3-miRNA plasmid (US
+ MB + L + P) group, 80 µl medium + 20 µl mixture of microbubbles
and Foxp3-miRNA plasmid (1:1) + 1 µl Lipofectamine® 2000
with ultrasonic irradiation. The groups with ultrasonic irradiation
were exposed to irradiation conditions with (MI=1.4; exposure
time=150 sec) using IU22 ultrasonic equipment (Philips Healthcare,
DA Best, The Netherlands). Following transfection for 24 h, the
transfection efficiency was observed under fluorescence microscope
(Olympus Corporation) and detected by FACSCalibur flow cytometer
(BD Biosciences) as previously described (19). Results were analyzed using FACSComp
(version5.1) software (BD Biosciences).
Detection of Tregs activity
Following 24 h transfection, 10 µl Cell Counting Kit
(CCK)8 (Dojindo Molecular Technologies, Inc., Kumamoto, Japan) was
added into each well and cultured at 37°C for 4 h. Then, the
absorbance was read at 460 nm using a microplate reader (Molecular
Devices LLC, Sunnyvale, CA, USA). The cell survival rate was
calculated as optical density (OD)test group-blank
group/ODcontrol group-blank group.
Inhibition effect of Tregs on
CD4+CD25− T cells
Two healthy volunteers (one 40-year-old male
weighing 75 kg and one 45-year-old female weighing 63 kg) were
recruited at The First Affiliated Hospital of Harbin Medical
University in May 2014. Written informed consent was received from
healthy volunteers and fasting peripheral blood samples were
collected. PBMCs were separated from the peripheral blood. Tregs in
the control group (90 µl medium + 10 µl control plasmid) and
optimal transfection group (US + MB + L + P) were collected and
co-cultured with CD4+CD25− T cells and PBMCs.
CD4+CD25− T cell activity was detected using
the CCK8 assay according to the manufacturer's protocol. The
proliferation-inhibition ratio of CD4+CD25− T
cells was calculated as ODcells without Tregs-cells with
Tregs/ODcells without Tregs. Supernatant was
collected to detect the contents of interferon-γ (IFN-γ) and
interleukin-2 (IL-2) secreted by CD4+CD25− T
cells in addition to IL-10 and transforming growth factor-β (TGF-β)
secreted by Tregs using the corresponding ELISA kits (IFN-γ,
E0110345; IL-2, E0110308; IL-10, E0110023; TGF-β, E01T0058;
Shanghai BlueGene Biotech Co., Ltd., Shanghai, China) according to
the manufacturer's protocol.
Animal model and grouping
Ethical approval was obtained from the Ethics
Committee of the Animal Laboratory Center of the First Affiliated
Hospital of Harbin Medical University. A total of 21 healthy male
C57BL/6 mice (8 weeks old; 18–22 g) were purchased from the Animal
Laboratory Center of the first affiliated hospital of Harbin
medical university, and acclimatized to a 12 h light/dark cycle at
21°C with 60–70% relative humidity and given free access to food
and water for a week prior to the trial. For the HCC mice model,
200 µl Hepa1-6 cells (5×10⁷/ml; Shanghai Cell Bank of
Chinese Academy of Sciences, Shanghai, China) were transplanted
subcutaneously into the right flanks of mice in the model group
(n=18). The other 3 mice were treated with normal saline as a
control. Following 7 days, the 18 mice in the model group were
randomly and equally assigned to 2 groups (n=9): HCC and treatment
groups. Mice in the treatment group were treated with microbubbles
and Foxp3-shRNA plasmid, 200 µl intravenously and 300 µl directly
into tumors. Mice in HCC group were injected with an equal dose of
normal saline in the same method. Following injection, tumors were
immediately irradiated by ultrasound for 300 sec. The treatment was
repeated every 3 days, for 21 days, a total of 7 times.
Detection index
Prior to each treatment, the long diameters (a) and
short diameters (b) of the tumor were detected and tumor volume was
calculated as follows: 1/6πa2b. Tumor growth curves were
constructed according to the tumor volume. Following 1 week of
treatment, all mice were sacrificed using 1.5% pentobarbital
(Sigma-Aldrich; Merck KGaA, Darmstadt, Germany) with a dose of 375
mg/kg and the tumors were weighed. The tumor inhibition rate=(mean
tumor weight in control group-mean tumor weight in experimental
group)/mean tumor weight in control group. In addition, following
treatment for 1 week, blood samples were collected. The content of
CD4+ and CD25+ T cells were detected by
staining with CD4-FITC and CD25-Allophycocyanin conjugated
antibodies (1:50; cat. nos. 553047 and 557192; BD Biosciences),
respectively, using FACSCria (BD Biosciences). Briefly, the cells
(1×10⁷ cells/ml, 0.1 ml) were stained with CD4-FITC or
CD25-Allophycocyanin conjugated antibodies for 30–40 min at room
temperature in the dark. Cells were washed with PBS and samples
were fixed in 1% formaldehyde solution at 4°C for 1 h and detected
by FACSCria (BD Biosciences). Finally, the data were analyzed by
FACSDiVa software (version 4.1; BD Biosciences). The content of
vascular endothelial growth factor (VEGF), IL-10, TGF-β, IFN-γ and
IL-2 in serum was detected by the corresponding ELISA kits (VEGF,
E03V0010; IFN-γ, E03I0345; IL-2, E03I0308; IL-10, E03I0023; TGF-β,
E03T0058; Shanghai BlueGene Biotech Co. Ltd.) according to the
manufacturer's protocol.
Western blot analysis
Cells and HCC tissue were collected and homogenized
in pre-cooled RIPA lysis buffer. Supernatant was acquired by
centrifugation at 11,347 × g for 15 min at 4°C. Subsequently; the
protein concentration was detected by the BCA Protein Quantitative
Assay (Sangon Shanghai Biotech Co., Ltd., Shanghai, China). A total
of 40 µg protein per lane sample was separated by 10% SDS-PAGE and
transferred onto polyvinylidene fluoride membranes, which were
blocked in 5% non-fat milk for 1 h at room temperature. The
membranes were incubated with mouse anti-human and rabbit
anti-mouse GAPDH antibodies (1:1,000; cat. nos. ab10901 and
ab37168; Abcam, Cambridge, MA, USA), mouse anti-human (1:1,000;
cat. no. ab10901, Abcam) and rabbit anti-mouse (1:1,000; cat. no.
TA346949; Beijing Zhongshan Jingqiao Biotechnology Co., Beijing,
China) Foxp3 polyclonal antibody overnight at 4°C and subsequently
incubated with goat anti-mouse immunoglobulin G (IgG)-horseradish
peroxidase (HRP) or goat anti-rabbit IgG-HRP (1:5,000; cat. nos.
ZB-2305 and ZB-2301; Zhongshan Jingqiao Biotechnology Co.) for 2 h
at room temperature. Ultimately, proteins were detected with
enhanced chemiluminescence reagent (EMD Millipore, Billerica, MA,
USA).
Statistical analysis
Statistical analysis was performed by SPSS 12.0
statistical analysis software (SPSS, Inc., Chicago, IL, USA). Data
were expressed as the mean ± standard deviation and analyzed by
one-way analysis of variance followed by a least significance
differences test. P<0.05 was considered to indicate
statistically significant differences.
Results
Comparison of transfection efficiency
between groups
Following 24 h of transfection, fluorescence
measurements indicated that no green fluorescent cells were present
in the control group, whereas different numbers of green
fluorescent cells were observed in the other six groups. US + MB +
L + P group had more green fluorescent cells than the other five
groups (Fig. 1A). In addition, flow
cytometry analysis demonstrated that transfection efficiency was 0,
2.17±0.57, 3.34±0.43, 10.39±1.65, 24.58±2.48, 27.61±3.40 and
46.59±4.10% in the MB + P, US + P, US + MB + P, L + P, US + L + P,
and US + MB + L + P groups, respectively (Fig. 1B), which were consistent with
fluorescence measurements. In addition, western blot analysis
demonstrated that the expression of Foxp3 was inhibited following
transfection with the Foxp3-miRNA plasmid (Fig. 1B). Compared with the control group,
following transfection with Foxp3-miRNA plasmid for 24 h, the
survival rate of Tregs was significantly inhibited in the other
groups (P<0.01, Table II) with
the exception of the US + P group. All these results suggested that
UTMD or Lipofectamine® 2000 may effectively transfect
Foxp3-miRNA into Tregs, and the combination of UTMD with
Lipofectamine® 2000 enhanced the transfection
efficiency.
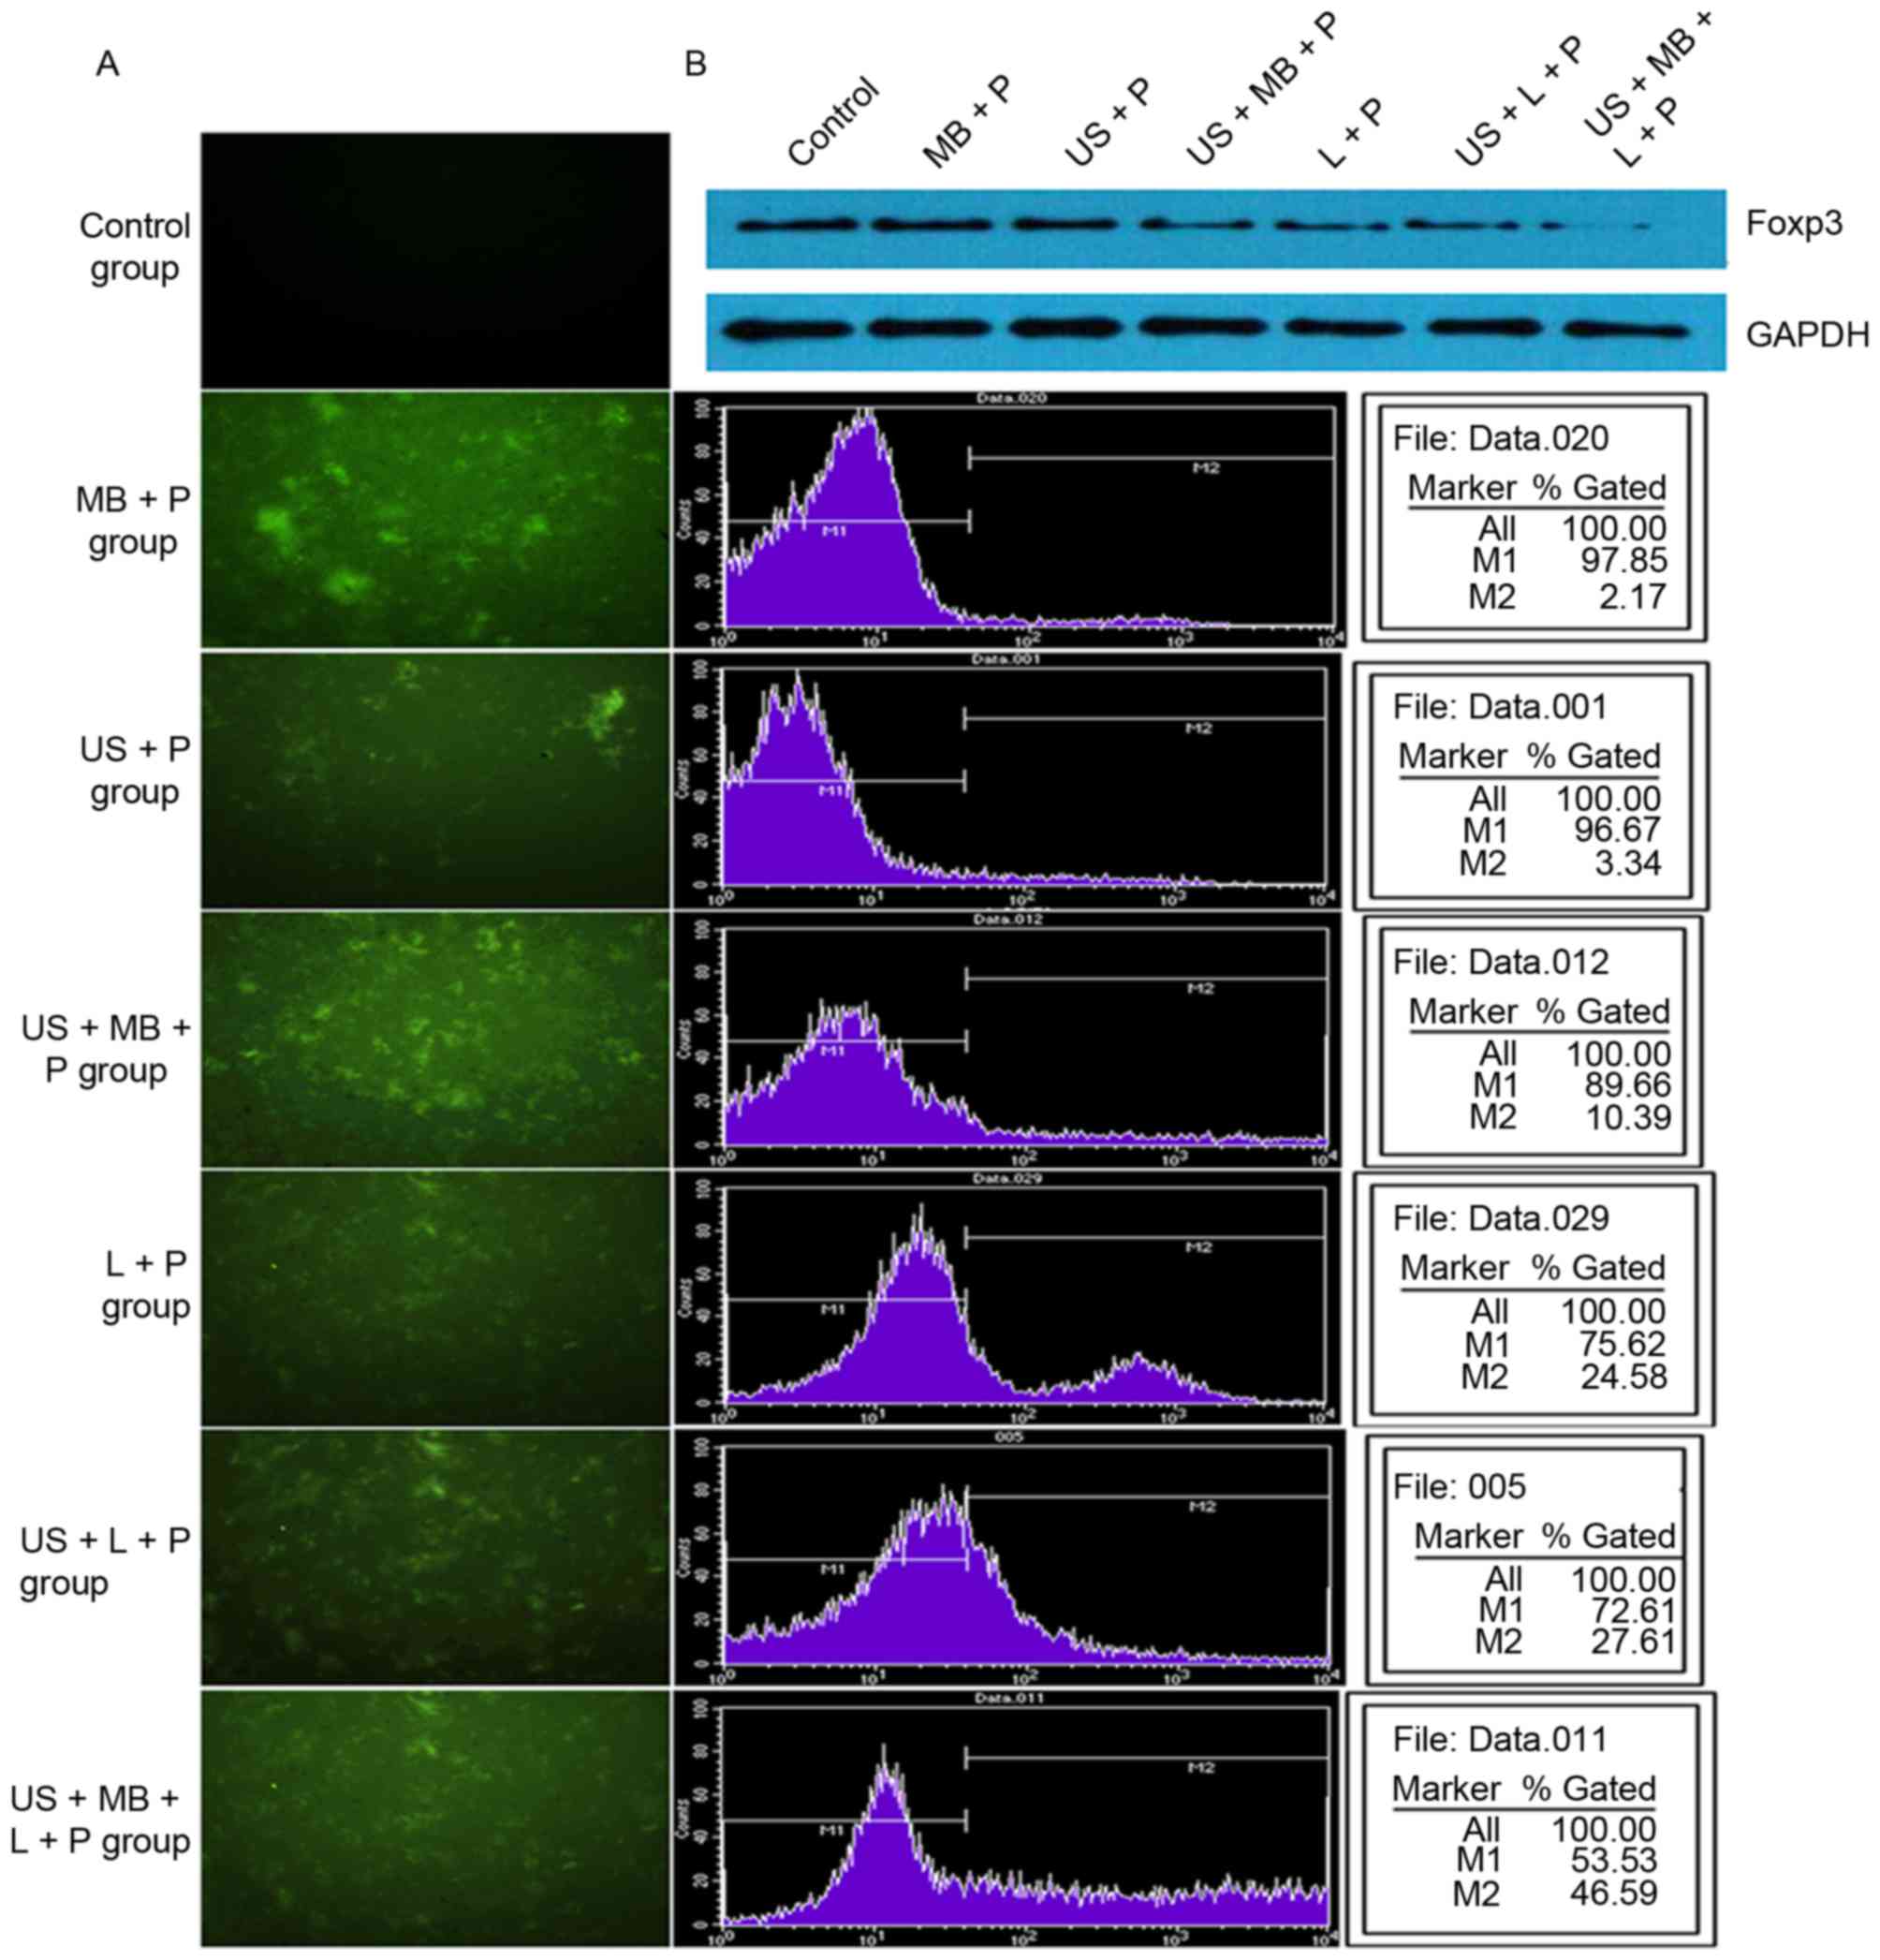 | Figure 1.Transfection efficiency in different
treatment groups. (A) Fluorescence measurements and flow cytometry
analysis indicated that the transfection efficiency was gradually
increased in the control, MB + P, US + P, US + MB + P, L + P, US +
L + P and US + MB + L + P groups and the (B) western blot analysis
demonstrated a gradual decrease in Foxp3 expression. Foxp3,
forkhead family transcription factor P3; MB, SonoVue microbubbles;
P, Foxp3-microRNA plasmid; US, ultrasound; L,
Lipofectamine® 2000. |
| Table II.Survival rate of Tregs in treatment
groups. |
Table II.
Survival rate of Tregs in treatment
groups.
| Group | Survival rate,
% |
|---|
| Control | 100 |
| MB + P |
88.610±2.864a |
| US + P | 96.552±2.330 |
| US + MB + P |
82.772±5.256a |
| L + P |
77.510±2.661a |
| US + L + P |
86.548±3.208a |
| US + MB + L +
P |
80.026±1.264a |
Effect of UTMD-mediated Foxp3-miRNA on
the function of Tregs
The present study demonstrated that when
CD4+CD25− T cells were co-cultured with PBMCs
and Tregs without Foxp3-miRNA (Foxp3+Tregs), the
proliferation-inhibition ratio of CD4+CD25− T
cells was significantly decreased (P<0.01; Table III) compared with cells co-cultured
with PBMCs and Tregs with Foxp3-miRNA (Foxp3−Tregs),
suggesting that Foxp3−Tregs may influence the inhibition
effect of Foxp3+Tregs on CD4+CD25−
T cells proliferation.
| Table III.Effect of Tregs with or without
Foxp3-miRNA on the proliferation of CD4+CD25−
T cells. |
Table III.
Effect of Tregs with or without
Foxp3-miRNA on the proliferation of CD4+CD25−
T cells.
| Index |
CD4+CD25− T cells
group |
CD4+CD25− T cells +
PBMCs group |
CD4+CD25− T cells +
PBMCs + Foxp3+Tregs group |
CD4+CD25− T cells +
PBMCs + Foxp3+Tregs group |
|---|
| OD value | 0.870±0.095 |
1.544±0.138a |
0.976±0.119b |
1.254±0.114c |
| Proliferation rate,
% | – | 77.806±5.770 |
12.114±3.360b |
44.606±8.974c |
|
Proliferation-inhibition ratio, % | – | – |
36.870±3.385 |
18.608±5.643c |
Effect of UTMD-mediated Foxp3-miRNA on
the levels of IFN-γ, IL-2, IL-10 and TGF-β in vitro
ELISA analysis indicated that the contents of IFN-γ
and IL-2 secreted by CD4+CD25− T cells
significantly increased (P<0.01), whereas the content of IL-10
and TGF-β secreted by Tregs significantly decreased in the
co-cultured system of Foxp3−Tregs compared with the
co-cultured system of Foxp3+Tregs (P<0.01; Table IV). These results suggested that
Foxp3−Tregs influenced the levels of IFN-γ and IL-2
secreted by CD4+CD25− T cells in addition to
the level of IL-10 and TGF-β secreted by Tregs.
| Table IV.The effect of Tregs with or without
Foxp3-miRNA on the levels of IFN-γ, IL-2, IL-10 and TGF-β. |
Table IV.
The effect of Tregs with or without
Foxp3-miRNA on the levels of IFN-γ, IL-2, IL-10 and TGF-β.
| Index |
CD4+CD25− T cells +
PBMCs + Foxp3+Tregs group |
CD4+CD25− T cells +
PBMCs + Foxp3+Tregs group |
|---|
|
CD4+CD25− T cells,
pg/ml |
| Level
of IFN-γ |
163.99±15.43 |
276.38±16.83a |
| Level
of IL-2 |
88.57±7.57 |
151.88±11.06a |
| Tregs, pg/ml |
| Level
of IL-10 |
124.25±11.33 |
82.24±10.42a |
| Level
of TGF-β |
159.93±9.19 |
97.79±12.08a |
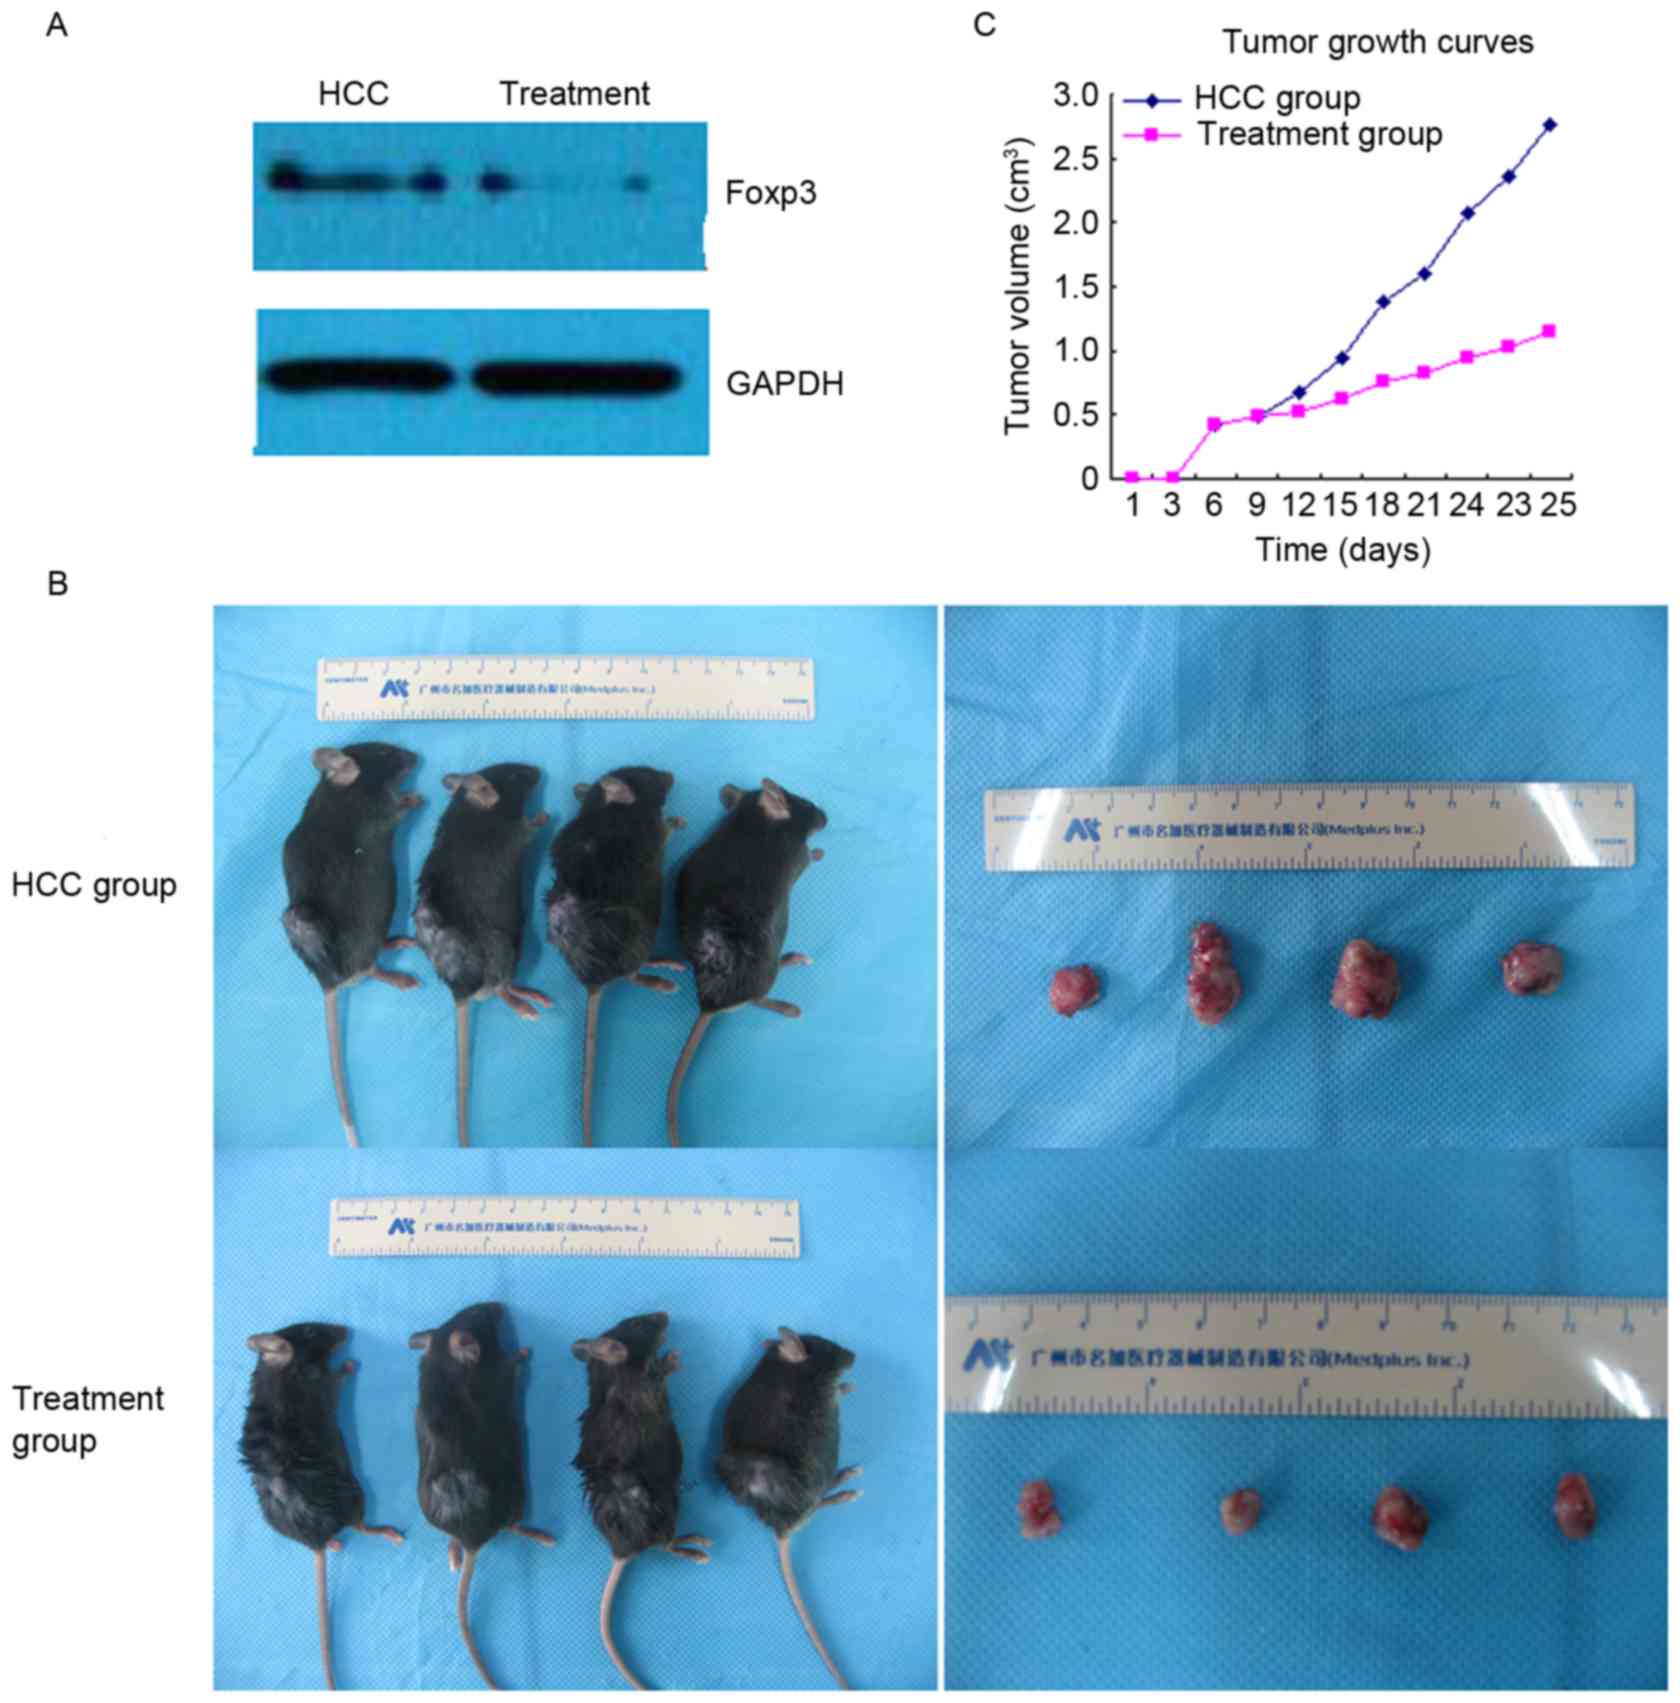
Effect of UTMD-mediated Foxp3-shRNA on
the tumor growth in HCC model of mice
Western blot analysis indicated that the expression
of Foxp3 was reduced in the treatment group compared with the HCC
group (Fig. 2A). In addition, the
present study demonstrated that the mean tumor volume and tumor
weight were markedly lower in the treatment group compared with the
HCC group (1.251±0.244 vs. 2.742±0.221 cm3 and
1.328±0.163 vs. 3.086±0.227 g; P<0.01; data not shown). Tumor
growth curves also indicated that the average tumor volume was
markedly inhibited by UTMD-mediated Foxp3-shRNA (Fig. 2B and C).
Effect of UTMD-mediated Foxp3-shRNA on
Tregs and CD4+ T cells in HCC model of mice
Flow cytometry analysis (Fig. 3) indicated that compared with the
control group, the ratio of Tregs/CD4+ T cells was
increased in the HCC group (4.89±0.81 vs. 3.11±0.65%; P<0.05;
data not shown); however, once treated with Foxp3-shRNA, the ratio
of Tregs/CD4+ T cells decreased, to below the HCC group
(3.28±0.75 vs. 4.89±0.81%; P<0.05; data not shown).
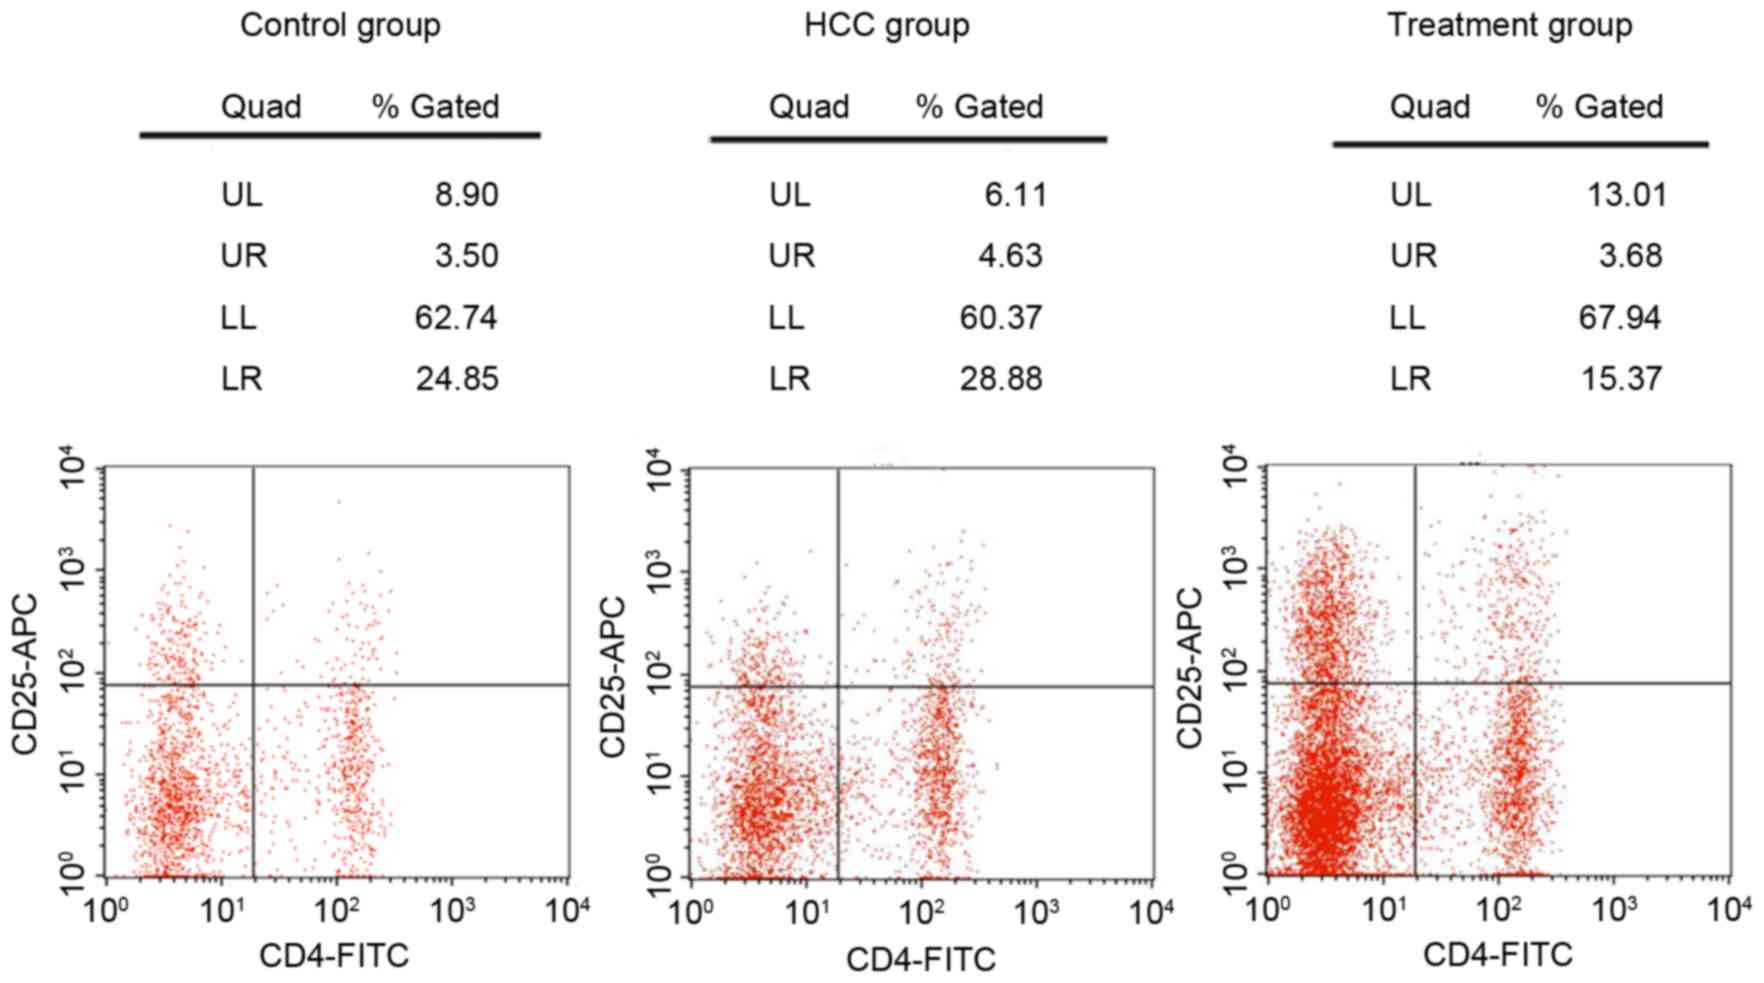 | Figure 3.Content of regulatory T cells and
CD4+ T cells in the blood of mice, by flow cytometry
analysis for the control, HCC and treatment group. CD, cluster of
differentiation; HCC, hepatocellular carcinoma; FITC, fluorescein
isothiocyanate; APC, allophycocyanin; UL, upper left; UR, upper
right; LL, lower left; LR, lower right. |
Effect of UTMD-mediated Foxp3-shRNA on
the levels of IL-10, TGF-β, IFN-γ, IL-2 and VEGF in serum of HCC
mouse model
ELISA analysis demonstrated that the level of IL-10,
TGF-β and VEGF increased, whereas the levels of IFN-γ and IL-2
decreased in HCC group, compared with the control group (P<0.05;
Table V). However, compared with the
HCC group, the level of IL-10, TGF-β and VEGF decreased, while the
level of IFN-γ and IL-2 increased in the treatment group
(P<0.05; Table V).
| Table V.Effect of Foxp3 knockdown on the
level of IL-10, TGF-β, IFN-γ, IL-2 and VEGF in serum in
vivo. |
Table V.
Effect of Foxp3 knockdown on the
level of IL-10, TGF-β, IFN-γ, IL-2 and VEGF in serum in
vivo.
| Factor, pg/ml | Control group
(n=3) | HCC group
(n=9) | Treatment group
(n=9) |
|---|
| IL-10 |
111.09±6.19 |
132.99±7.15b |
102.39±4.82d |
| TGF-β |
124.06±8.12 |
159.68±7.88b |
124.26±5.99d |
| IFN-γ |
46.18±8.85 |
21.78±3.56a |
45.25±10.36c |
| IL-2 |
61.25±6.62 |
37.88±4.88b |
59.09±4.96d |
| VEGF |
48.88±8.11 |
68.35±4.69a |
44.11±5.79d |
Discussion
UTMD-mediated gene therapy has been applied both
in vitro and in vivo (17). In contrast with UTMD,
Lipofectamine® 2000 is a common non-viral vector
characterized by a low immunogenicity and high safety but low
efficiency, non-targeting and increased cytotoxicity (20,21). The
present study demonstrated that UTMD or Lipofectamine®
2000 may effectively transfect Foxp3-miRNA into Tregs, with maximum
transfection efficiency observed in the US + MA + L + P group.
These results suggested that the combination of UTMD with
Lipofectamine® 2000 may enhance transfection
efficiency.
Tregs was a major factor in the suppression of the
tumor-specific immune response in patients with HCC, and the
elimination or suppression of Tregs function may effectively
enhance the antitumor immune response (22). Foxp3 has been demonstrated to
regulate the immunosuppressive function of Tregs (23). Previous studies have indicated that
the immune responses induced by CD4+CD25− T
cells may be inhibited by CD4+CD25+ Tregs
in vitro through cytokine-independent mechanisms (24,25).
Liyanage et al (26)
demonstrated that Tregs from patients with pancreas or breast
adenocarcinoma secreted IL-10 and TGF-β; however, when Tregs were
co-cultured with CD4+25− T cells, Tregs were
able to inhibit the proliferation in addition to the secretion of
IFN-γ and IL-2 in CD4+25− T cells.
Furthermore, Foxp3 is able to suppress the production of IFN-γ and
IL-2 secreted by effector T cells, while upregulating the level of
IL-10 and TGF-β secreted by Tregs (27). Furthermore, Foxp3+Tregs is
able to suppress the activation of T cells and inhibit the
proliferation of effector CD4+ T cells (28). Notably, Foxp3 knockdown may enhance
tumor immunity (29). Consistently,
the current study demonstrated that Foxp3−Tregs reduced
the inhibition effect of Foxp3+Tregs from patients with
HCC on the proliferation of CD4+CD25− T
cells. In addition, Foxp3−Tregs may also increase the
level of IFN-γ and IL-2 secreted by CD4+CD25−
T cells but decrease the level of IL-10 and TGF-β secreted by
Tregs. These results indicate that the downregulation of Foxp3 may
mitigate the immunosuppressive function of Tregs.
It has been suggested that the immunosuppressive
function of Tregs, at least partially, contributed to the
proliferation of tumor cells (30).
A previous study indicated that a depletion of Tregs may enhance
tumor immunity and inhibit tumor growth in patients with HCC
(12). Notably, the present study
revealed that UTMD-mediated Foxp3-shRNA inhibited the tumor growth
in HCC model mice, suggesting that UTMD-mediated Foxp3-shRNA may
inhibit the function of Tregs. In addition, the current study also
indicates that the downregulation of Foxp3 reduced the ratio of
Tregs/CD4+ T cells. Following treatment with
Foxp3-shRNA, the level of IL-10 and TGF-β decreased, while the
level of IFN-γ and IL-2 increased, in the current study. These
results indicate that the downregulation of Foxp3 enhanced the
immunologic function and anti-tumor effect. Furthermore, the
present study also demonstrated that UTMD-mediated Foxp3-shRNA
reduced the level of VEGF. It has been demonstrated that VEGF
promotes the formation of tumor angiogenesis and inhibits the
apoptosis of tumor cells (31).
These results indicate that UTMD-mediated Foxp3-shRNA may partially
inhibit the tumor growth in HCC mice through suppressing the
production of VEGF.
In conclusion, the current study demonstrated that
the combination of UTMD with Lipofectamine® 2000 may be
the optimal choice to enhance the transfection efficiency in gene
therapy. Furthermore, UTMD-mediated Foxp3-miRNA/shRNA may relieve
the immunosuppressive function of Tregs in patients with HCC in
vitro, and partially inhibit the tumor growth in HCC mice
through enhancing immunologic function and suppressing the
production of VEGF. The present study is not without limitations;
the long-term effects of UTMD-mediated Foxp3-miRNA/shRNA on
immunologic function and tumor growth remain unclear. Therefore,
the safety and efficacy of UTMD-mediated Foxp3-miRNA/shRNA should
be further investigated in the future.
Acknowledgements
The present study was supported by General Projects
of National Natural Science Foundation of China (grant no.
81171346), the Research Foundation Of The Talent Of Scientific And
Technical Innovation of Harbin City (grant no. 2016RAQXJ148),
General Projects of Heilongjiang Province Natural Science
Foundation of China (grant no. H2017026) and the Scientific
Research Innovation Fund of The First Affiliated Hospital of Harbin
Medical University.
References
|
1
|
Han KH, Kudo M, Ye SL, Choi JY, Poon RP,
Seong J, Park JW, Ichida T, Chung JW, Chow P and Cheng AL: Asian
consensus workshop report: Expert consensus guideline for the
management of intermediate and advanced hepatocellular carcinoma in
Asia. Oncology. 81 Suppl 1:S158–S164. 2011. View Article : Google Scholar
|
|
2
|
Jemal A, Bray F, Center MM, Ferlay J, Ward
E and Forman D: Global cancer statistics. CA Cancer J Clin.
61:69–90. 2011. View Article : Google Scholar : PubMed/NCBI
|
|
3
|
Maluccio M and Covey A: Recent progress in
understanding, diagnosing, and treating hepatocellular carcinoma.
CA Cancer J Clin. 62:394–399. 2012. View Article : Google Scholar : PubMed/NCBI
|
|
4
|
Pardee AD and Butterfield LH:
Immunotherapy of hepatocellular carcinoma: Unique challenges and
clinical opportunities. Oncoimmunology. 1:48–55. 2012. View Article : Google Scholar : PubMed/NCBI
|
|
5
|
Ganss R and Hanahan D: Tumor
microenvironment can restrict the effectiveness of activated
antitumor lymphocytes. Cancer Res. 58:4673–4681. 1998.PubMed/NCBI
|
|
6
|
Coussens LM and Werb Z: Inflammation and
cancer. Nature. 420:860–867. 2002. View Article : Google Scholar : PubMed/NCBI
|
|
7
|
Linehan DC and Goedegebuure PS: CD25+ CD4+
regulatory T-cells in cancer. Immunol Res. 32:155–168. 2005.
View Article : Google Scholar : PubMed/NCBI
|
|
8
|
von Boehmer H: Mechanisms of suppression
by suppressor T cells. Nat Immunol. 6:338–344. 2005. View Article : Google Scholar : PubMed/NCBI
|
|
9
|
Fontenot JD and Rudensky AY: A well
adapted regulatory contrivance: Rregulatory T cell development and
the forkhead family transcription factor Foxp3. Nat Immunol.
6:331–337. 2005. View
Article : Google Scholar : PubMed/NCBI
|
|
10
|
Tsai BY, Suen JL and Chiang BL:
Lentiviral-mediated Foxp3 RNAi suppresses tumor growth of
regulatory T cell-like leukemia in a murine tumor model. Gene Ther.
17:972–979. 2010. View Article : Google Scholar : PubMed/NCBI
|
|
11
|
Ormandy LA, Hillemann T, Wedemeyer H,
Manns MP, Greten TF and Korangy F: Increased populations of
regulatory T cells in peripheral blood of patients with
hepatocellular carcinoma. Cancer Res. 65:2457–2464. 2005.
View Article : Google Scholar : PubMed/NCBI
|
|
12
|
Yang XH, Yamagiwa S, Ichida T, Matsuda Y,
Sugahara S, Watanabe H, Sato Y, Abo T, Horwitz DA and Aoyagi Y:
Increase of CD4+ CD25+ regulatory T-cells in the liver of patients
with hepatocellular carcinoma. J Hepatol. 45:254–262. 2006.
View Article : Google Scholar : PubMed/NCBI
|
|
13
|
Walton CB, Anderson CD, Boulay R and
Shohet RV: Introduction to the ultrasound targeted microbubble
destruction technique. J Vis Exp. 52:e29632011.
|
|
14
|
Geis NA, Katus HA and Bekeredjian R:
Microbubbles as a vehicle for gene and drug delivery: Current
clinical implications and future perspectives. Curr Pharm Design.
18:2166–2183. 2012. View Article : Google Scholar
|
|
15
|
Li YS, Davidson E, Reid CN and McHale AP:
Optimising ultrasound-mediated gene transfer (sonoporation) in
vitro and prolonged expression of a transgene in vivo: Potential
applications for gene therapy of cancer. Cancer Lett. 273:62–69.
2009. View Article : Google Scholar : PubMed/NCBI
|
|
16
|
Fujii H, Sun Z, Li SH, Wu J, Fazel S,
Weisel RD, Rakowski H, Lindner J and Li RK: Ultrasound-targeted
gene delivery induces angiogenesis after a myocardial infarction in
mice. JACC Cardiovasc Imaging. 2:869–879. 2009. View Article : Google Scholar : PubMed/NCBI
|
|
17
|
Carson AR, McTiernan CF, Lavery L, Hodnick
A, Grata M, Leng X, Wang J, Chen X, Modzelewski RA and Villanueva
FS: Gene therapy of carcinoma using ultrasound-targeted microbubble
destruction. Ultrasound Med Biol. 37:393–402. 2011. View Article : Google Scholar : PubMed/NCBI
|
|
18
|
Kee KM, Wang JH, Lin CY, Wang CC, Cheng YF
and Lu SN: Validation of the 7th edition TNM staging system for
hepatocellular carcinoma: An analysis of 8,828 patients in a single
medical center. Dig Dis Sci. 58:2721–2728. 2013. View Article : Google Scholar : PubMed/NCBI
|
|
19
|
Saayman SM, Lazar DC, Scott TA, Hart JR,
Takahashi M, Burnett JC, Planelles V, Morris KV and Weinberg MS:
Potent and targeted activation of latent HIV-1 using the
CRISPR/dCas9 activator complex. Mol Ther. 24:488–498. 2016.
View Article : Google Scholar : PubMed/NCBI
|
|
20
|
Ewert KK, Ahmad A, Bouxsein NF, Evans HM
and Safinya CR: Non-viral gene delivery with cationic liposome-DNA
complexesGene Therapy Protocols. Springer; New York, NY: pp.
159–175. 2008, View Article : Google Scholar
|
|
21
|
Karmali PP and Chaudhuri A: Cationic
liposomes as non-viral carriers of gene medicines: Resolved issues,
open questions, and future promises. Med Res Rev. 27:696–722. 2007.
View Article : Google Scholar : PubMed/NCBI
|
|
22
|
Zhang HH, Mei MH, Fei R, Liao WJ, Wang XY,
Qin LL, Wang JH, Wei L and Chen HS: Regulatory T cell depletion
enhances tumor specific CD8 T-cell responses, elicited by tumor
antigen NY-ESO-1b in hepatocellular carcinoma patients, in vitro.
Int J Oncol. 36:841–848. 2010.PubMed/NCBI
|
|
23
|
Fontenot JD, Rasmussen JP, Williams LM,
Dooley JL, Farr AG and Rudensky AY: Regulatory T cell lineage
specification by the forkhead transcription factor foxp3. Immunity.
22:329–341. 2005. View Article : Google Scholar : PubMed/NCBI
|
|
24
|
Dieckmann D, Plottner H, Berchtold S,
Berger T and Schuler G: Ex vivo isolation and characterization of
CD4(+) CD25(+) T cells with regulatory properties from human blood.
J Exp Med. 193:1303–1310. 2001. View Article : Google Scholar : PubMed/NCBI
|
|
25
|
Shevach EM: CD4+ CD25+ suppressor T cells:
More questions than answers. Nature Rev Immunol. 2:389–400.
2002.
|
|
26
|
Liyanage UK, Moore TT, Joo HG, Tanaka Y,
Herrmann V, Doherty G, Drebin JA, Strasberg SM, Eberlein TJ,
Goedegebuure PS and Linehan DC: Prevalence of regulatory T cells is
increased in peripheral blood and tumor microenvironment of
patients with pancreas or breast adenocarcinoma. J Immunol.
169:2756–2761. 2002. View Article : Google Scholar : PubMed/NCBI
|
|
27
|
Ono M, Yaguchi H, Ohkura N, Kitabayashi I,
Nagamura Y, Nomura T, Miyachi Y, Tsukada T and Sakaguchi S: Foxp3
controls regulatory T-cell function by interacting with AML1/Runx1.
Nature. 446:685–689. 2007. View Article : Google Scholar : PubMed/NCBI
|
|
28
|
Pandiyan P, Zheng L, Ishihara S, Reed J
and Lenardo MJ: CD4+ CD25+ Foxp3+ regulatory T cells induce
cytokine deprivation-mediated apoptosis of effector CD4+ T cells.
Nat Immunol. 8:1353–1362. 2007. View
Article : Google Scholar : PubMed/NCBI
|
|
29
|
Nair S, Boczkowski D, Fassnacht M,
Pisetsky D and Gilboa E: Vaccination against the forkhead family
transcription factor Foxp3 enhances tumor immunity. Cancer Res.
67:371–380. 2007. View Article : Google Scholar : PubMed/NCBI
|
|
30
|
Nishikawa H and Sakaguchi S: Regulatory T
cells in tumor immunity. Int J Cancer. 127:759–767. 2010.PubMed/NCBI
|
|
31
|
Kim KJ, Li B, Winer J, Armanini M, Gillett
N, Phillips HS and Ferrara N: Inhibition of vascular endothelial
growth factor-induced angiogenesis suppresses tumour growth in
vivo. Nature. 362:841–844. 1993. View Article : Google Scholar : PubMed/NCBI
|