Introduction
Type 1 diabetes is an autoimmune disease
characterized by the T cell-mediated destruction of
insulin-producing β-cells in the islets of Langerhans (1). Type 1 diabetes is one of the most
common chronic diseases of childhood (2), particularly in boys (3). Despite recent broad organisational,
intellectual and fiscal investments, there is no valid method to
prevent or cure type 1 diabetes. Therefore, elucidating the
mechanisms of type 1 diabetes is critical for the clinical
diagnosis and treatment for type 1 diabetes. Thus the aim of the
present study was to explore molecular mechanisms of type 1
diabetes.
Determinants of diabetes pathology are complex,
including environment factors and genetic factors. It is generally
accepted that environmental agents initiated the pathologic process
in type 1 diabetes, as many cases are diagnosed in autumn and
winter (4). Birth during spring is
also associated with a higher chance of having type 1 diabetes
(5). Efforts have been made on
modules to describe the influence of environment on type 1
diabetes, including the gut microbiome (6) and hygiene hypothesis (3). However, no specific agents have been
identified with an unequivocal influence on pathogenesis. Type 1
diabetes is clearly a polygenic disorder, with 50 susceptibility
regions having been identified (3),
of which the human leukocyte antigen (7) region on chromosome 6 potentially
provides half of the genetic susceptibility, especially HLA class
II alleles (3). Most of the
associated loci are thought to be involved in immune responses
(8). According to the literature
(3), the associated SNPs are
localized to enhancer sequences active in thymus, T and B cells,
and CD34+ stem cells.
Although there has been considerable research on
type 1 diabetes progression, the data are huge and complex. A
network-based approach was suggested as a powerful tool for
studying the complex behavior of biological systems (3). To elucidate the molecular mechanisms of
type 1 diabetes, we introduced a new method to screen differential
modules between the disease and normal groups. We downloaded gene
expression data of type 1 diabetes from the Array Express database.
By combining gene expression data and protein-protein interactions
(PPI) data, we constructed target networks. Local entropy and
global entropy of network were calculated to screen differential
modules between diabetes and normal group.
Materials and methods
Gene expression data
Microarray data of E-GEOD-10586 (3), along with its annotation files, was
downloaded from the Array Express database. The data included 12
diabetes patients and 15 healthy controls. The platform in the
present study was A-AFFY-44-Affymetrix GeneChip Human Genome U133
Plus 2.0 [HG-U133_Plus_2].
Data preprocessing
Microarray data were preprocessed as follows. To
eliminate the influences of non-specific hybridization, background
was corrected with robust multichip average (RMA) (3). After data were normalized with
‘quantiles (9), perfect match
(3)/mismatch (MM) correction was
conducted using the MAS method (10), and median polish was conducted for
summarizing data (11). Microarray
data were then transformed into an expression set. According to the
gene ID and symbol in the annotation file of the platform, the gene
ID was changed to its probe ID. Finally, the expression profiles
with 20,545 genes were obtained.
PPI networks construction
Human-associated PPI data were downloaded from
Search Tool for the Retrieval of Interacting Genes/Proteins
(STRING) database (12), including
16,730 genes and 1,048,576 pairs of interactions. Protein ID was
converted to a gene symbol. Self-loops and proteins without
expression value were removed. The combine-score was used to
examine the relationship between two genes. To selected PPIs with
closer relationship, we set the criteria of combined score ≥0.8,
generating a new PPI network, including 8,590 nodes and 53,975
edges.
Gene interactions in the PPI network were reweighed
using the Pearsons correlation coefficient. The absolute value of
each interaction was considered as the interactive-score. Finally,
PPI networks of the normal and diabetes group were calculated using
the interactive-scores.
Comparison and identification of
modules
To construct networks in the disease and normal
groups, we applied a module-identification algorithm, which is
based on clique-merging according to Srihari and Ragan (13).
The algorithm calculations included two steps:
Firstly, it finds all maximal cliques from the PPI networks of the
normal and diabetes groups. Maximal cliques (26,580) were found in
both groups and ranked in non-increasing order of their weighted
interaction densities. Secondly, the cliques were ranked according
to their weighted interaction density (3) and merged or removed highly overlapping
cliques The score of a clique C was defined as its weighted
interaction density,
score(C)=∑i,j∈cω(i,j)|C|*(|C|–1)
where ω (i, j) indicates the weight of the
interaction between i and j calculated using fast depth-first
method (14).
In total 8,002 maximal cliques were identified in a
PPI network, and the overlapped cliques should be removed. The
inter-connectivity between two cliques was used to determine
whether two overlapped cliques should be merged together. The
inter-connectivity between the non-overlapping proteins of C1 and
C2 was calculated as
inter–score,C1,C2.=,–,,u∈(C1–C2)––,v∈C2––w(u,v)..–,C1–C2.·,C2..·,,u∈(C2–C1)––,v∈C1––w(u,v)..–,C2–C1.·,C1…
Given a set of cliques ranked in descending order of
their score, denoted as {C1, C2,…, Ck}, clustering based on the
maximal cliques (CMC) algorithm was removed and merged highly
overlapped cliques as follows. For every clique Ci, if there
existed a clique Cj such that Cj had a lower score than Ci and
|Ci∩Cj|/|Cj|≥overlap_threshold(to),
where overlap-threshold was a predefined threshold
for overlapping. Subsequently, the weighted interconnecting score
of different nodes in the two cliques was calculated. If such Cj
existed, then the interconnectivity score between Ci and Cj was
used to decide whether to remove Cj or merge Cj with Ci. If
inter-score (Ci, Cj) and merge-threshold (tm) existed,
then Cj was merged with Ci to form a module; otherwise, Cj was
removed. In this study, the overlap-threshold was set to 0.5 and
merge-threshold was set to 0.25.
Identification of differential
modules
To identify differential modules between disease
group and normal group, we constructed target networks and
performed Wilcoxon rank sum test (15).
Comparing modules across
condition
To search for similar or the same modules between
the normal and diabetes groups, module correlation densities for
modules were calculated. Let S = {S1, S2, …,
Sn} and T = {T1, T2, …,
Tm} be the sets of modules identified from the normal
and disease networks, respectively. For each Si Є S, module
correlation densities were calculated as:
dcc(Si)=∑p,q∈siPCC((p,q),N)(|si|2)
where (p,q) is a protein pair, PCC((p,q), N) is the
Pearsons correlation of (p,q) under normal conditions, and
Si is the i-th modules identified from networks.
The correlation densities for disease modules were
calculated similarly.
After all the modules were examined, 69 pairs of
similar or identical modules were identified.
Construction of target network
Shared genes and interactions in the normal and
disease modules were reserved, generating a new network, designated
as target network. Finally, 24 target networks were identified.
To compare the network features of the target
networks, network entropy was conducted in this study (16).
The local network entropy of a node i, denoted
Si, is defined as
Si=1logki∑j∈Nipi,jlogpi,j
where ki is the degree of node i, N(i) is
the set of neighbor nodes of node i and pij defines a
stochastic probability matrix on the network, which is defined
by
pij|cij|∑k∈Nicik
where cij is the Pearsons correlation
coefficient (PCC) between protein i and protein j.
The global network entropy, denoted S, was defined
as follows:
S=∑i=1nCiSi
where n is the total number of nodes in the network,
and Ci is the degree centrality of node i.
Ci=kin–1
The differential network entropy was defined as
follows:
ΔSi=SiI–SiN
where SIi
SNi is the local network entropy of node i in
the disease and normal networks, respectively.
Significant test
To determine whether the distributions of local
network entropy of the disease and normal networks were
significantly different, we performed the non-parametric one-tailed
Wilcoxon rank sum test (15).
The disease sample labels were permuted and global
entropy of networks in the disease and normal groups were
recalculated. This process was repeated L times. P-value of the
test was used as a measure of the degree of difference between the
values in the two networks. P-value was calculated as:
{#l|SlI≤Sobs'Nforl=1,…,L}/L
P<0.05 was considered to indicate a
statistically significant difference.
Results
Gene expression data
After data preprocessing, 20,545 genes were
obtained. Proteins from PPI networks were transformed to a gene
symbol. Based on the criteria of combined score ≥0.8, 53,975
interactions and 8,590 nodes were obtained. The interactions
between genes and PPI networks were investigated. The interactions
existing in the PPI and gene expression data were reserved. In
total, 48,778 new PPI interactions, including 7,953 genes were
obtained.
Identifying dysregulated module
Modules constituted shared genes in the disease and
normal groups were regarded as target networks. In total, 24
networks were obtained. Global entropy of networks was calculated
from local entropy of nodes. After significance test, P-values of
networks were obtained. Two significant differential modules were
identified with P<0.05 (Table I).
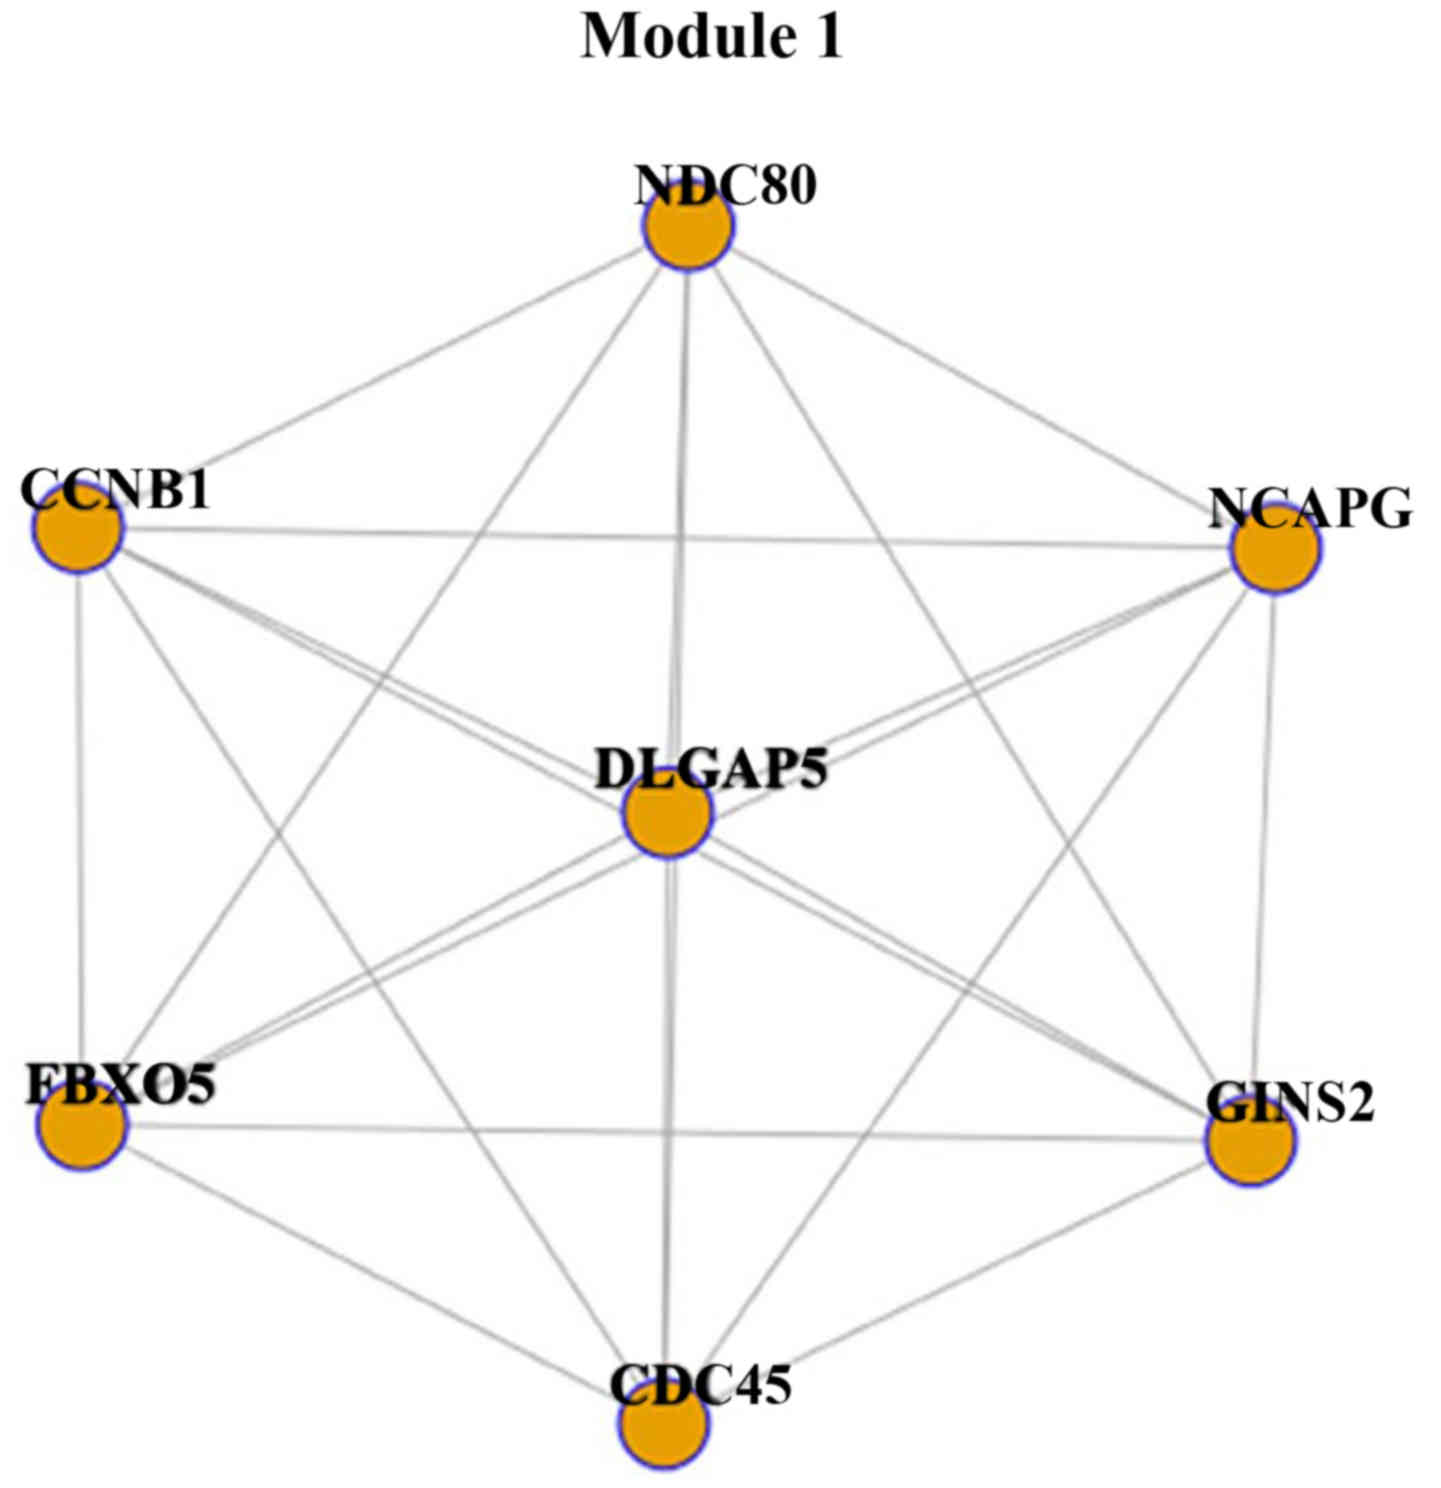
Module 1 was constructed with 7 genes and 21 interactions (Fig. 1). Each gene interacted with other
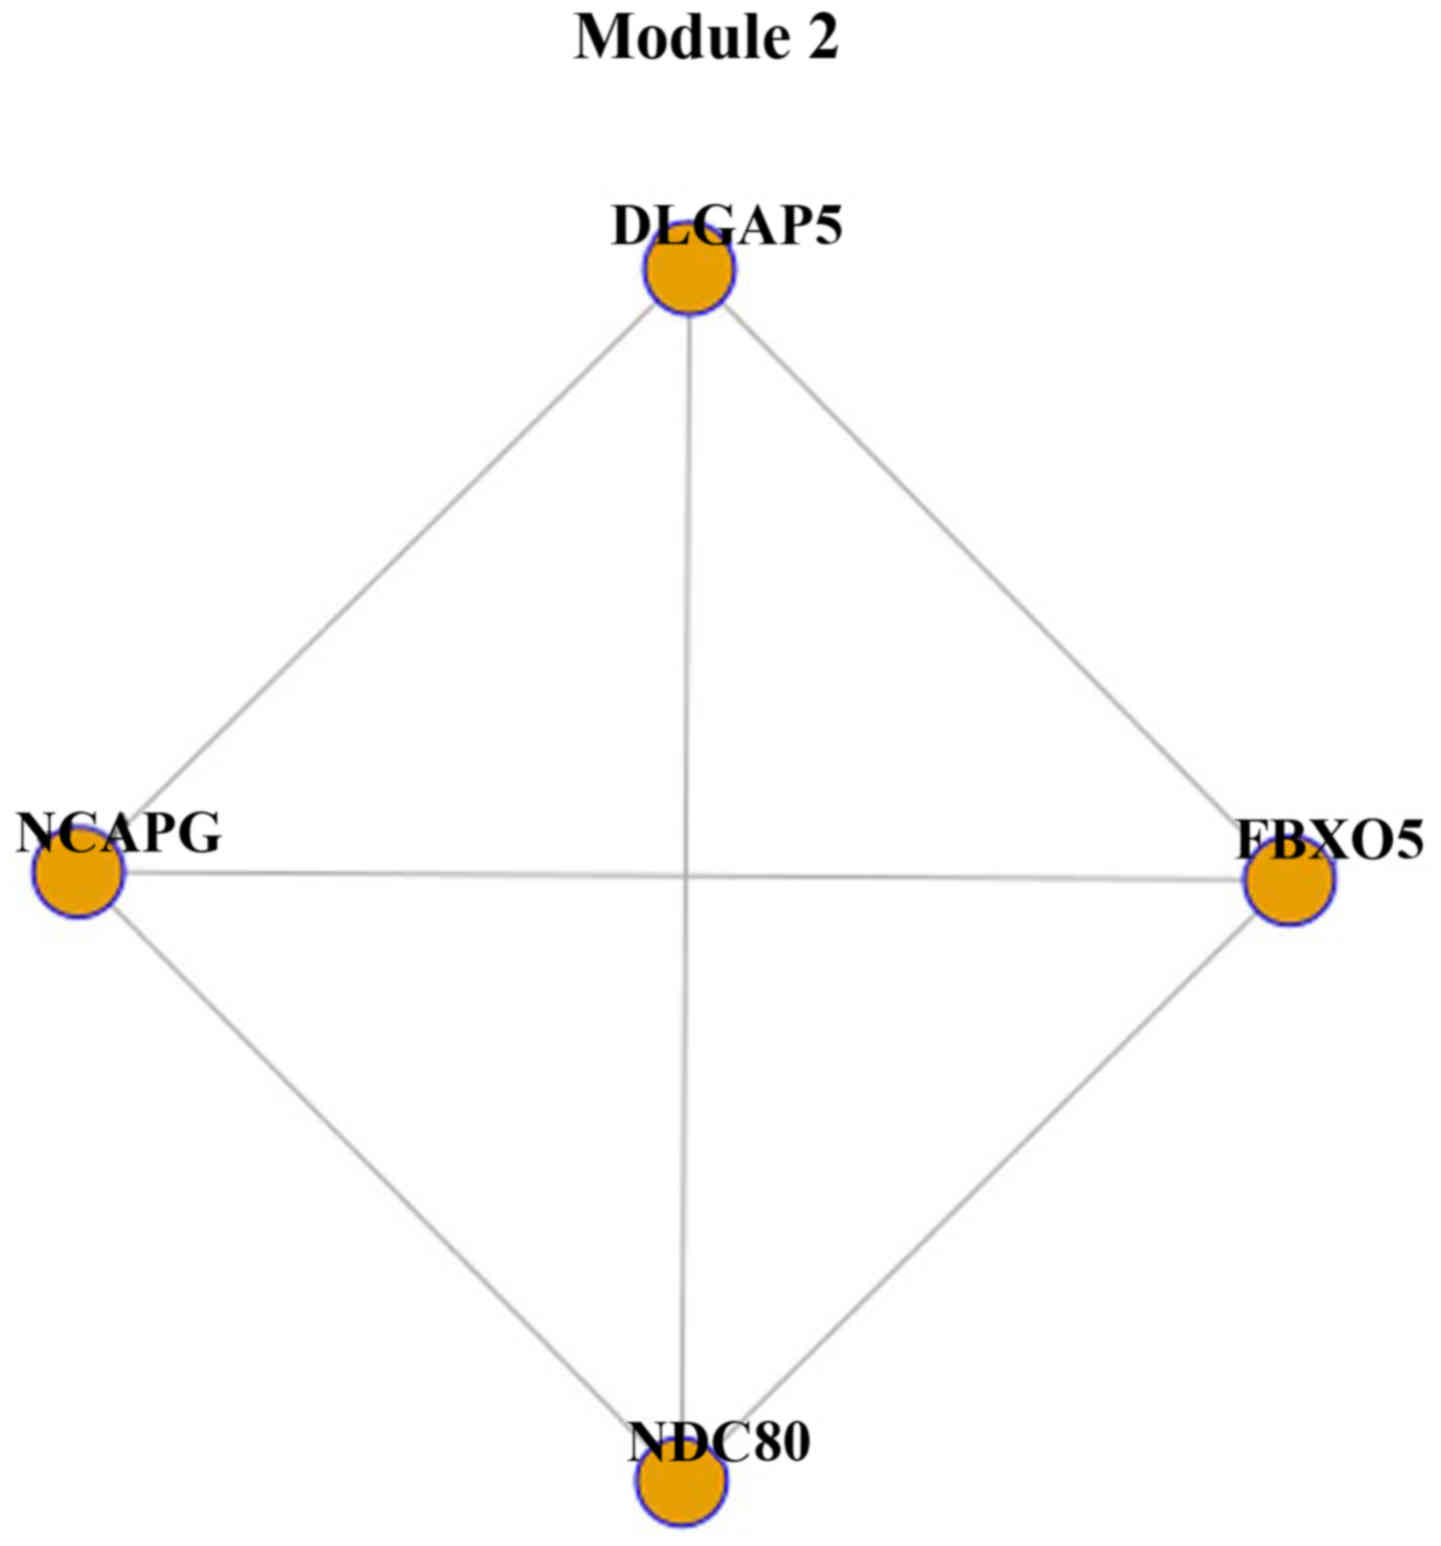
genes. Module 2 was constructed with 4 genes and 6 interactions
(Fig. 2). Module 2 was part of
module 1, as the 4 genes, NDC80, FBXO5, NCAPG and
DLGAP5, were identified in module 1.
 | Table I.Two modules with P<0.05 were
identified. |
Table I.
Two modules with P<0.05 were
identified.
| Module | ΔS | P-value |
|---|
| 1 | 0.2429241 | 0.043 |
| 2 | 0.1019656 | 0.025 |
Discussion
In this study, by integrating gene expression data
and PPI, we identified 48,778 new PPI interactions, including 7,953
genes. In the network analysis, 24 target modules were identified.
In the entropy analysis, two differential modules between type 1
diabetes group and normal group were obtained, and module 2 was
part of module 1. Therefore, module 1 which was constructed with 7
genes, including CCNB1, CDC45, GINS2, NDC80, FBXO5, NCAPG
and DLGAP5 was the most significant module. It was suggested
to help understanding the mechanism of type 1 diabetes.
This method is based on network entropy, which
performs better than other network metrics in characterizing the
inflammatory network as proposed by Jin et al (16).
CCNB1 is a gene expressing a regulatory
protein, cyclin B1, which forms a complex with p34 (Cdk1) to form
the maturation-promoting factor (MPF). Once activated by
dephosphorylation by the phosphatase Cdc25, the complex promotes
several events of early mitosis (18). It has been found that CCNB1
was significantly upregulated in non-obese diabetic mesenchymal
stem cells and proposed that genetic variants in CCNB1 were
associated with increased reporter gene expression through binding
of transcription factors nuclear factor-Y, which elevated fasting
plasma glucose in humans (3). By
contrast, in the non-obese diabetic mouse study, NDC80, CCNB1,
FBXO5, NCAPG and CDC45 (19) were involved in cell cycle, which
promoted the development of type 1 diabetes mellitus (3).
Although no evidence showed that GINS2 was
correlated with diabetes, its expression was downregulated by high
glucose in retinal pigment epithelial cell lines (3).
NDC80 encodes a component of the NDC80
kinetochore complex, which functions to organize and stabilize
microtubule-kinetochore interactions and is required for proper
chromosome segregation (NCBI Gene Database). It was presented that
the NUF2 gene, which also encodes a component of the NDC80
kinetochore complex, was upregulated in diabetes HUVEC compared
with normal HUVEC (3). Thus
NDC80 may play a similar role in diabetes.
FBXO5 encodes a member of the F-box protein
family. FBXO5 was detected to duplicate in chromosome
observed from 15 patients with Mayer-Rokitansky-Kuster-Hauser
syndrome (3). By contrast, diabetes
has been reported to cause malformations of Mullerian ducts in
females (20). Therefore, we
suggested that FBXO5 may also function in diabetes.
NCAPG encodes a component of condensin I,
which is a large protein complex involved in chromosome
condensation. Several single nucleotide polymorphisms (SNPs) near
the gene of NCAPG were associated with type 2 diabetes
(3). However, whether the gene plays
a key role in type 1 diabetes still needs further study.
DLGAP5 encodes a kinetochore protein that
stabilizes microtubules in the vicinity of chromosomes. In
adrenocortical tumors, DLGAP5 was identified as a diagnostic marker
since it was differentially expressed between recurring and
non-recurring adrenocortical tumors (3). However, in diabetes, no studies have
shown the functions of DLGAP5.
In conclusion, one dysregulated module was
identified using the network-based entropy analysis, which was
considered to play a key role in type 1 diabetes progression. It is
suggested that this module may function as a therapeutic indicator
for type 1 diabetes. Nevertheless, there are limitations to the
present study. The sample size was not large enough to affect the
conclusions to some degree. Additionally, the results need more
clinical evidence for further validation.
Competing interests
The authors declare that they have no competing
interests.
References
|
1
|
Roep BO and Peakman M: Diabetogenic T
lymphocytes in human type 1 diabetes. Curr Opin Immunol.
23:746–753. 2011. View Article : Google Scholar : PubMed/NCBI
|
|
2
|
Gale EA: Type 1 diabetes in the young: The
harvest of sorrow goes on. Diabetologia. 48:1435–1438. 2005.
View Article : Google Scholar : PubMed/NCBI
|
|
3
|
Baidal DA, Ricordi C, Garcia-Contreras M,
Sonnino A and Fabbri A: Combination high-dose omega-3 fatty acids
and high-dose cholecalciferol in new onset type 1 diabetes: A
potential role in preservation of beta-cell mass. Eur Rev Med
Pharmacol Sci. 20:3313–3318. 2016.PubMed/NCBI
|
|
4
|
Kalliora MI, Vazeou A, Delis D, Bozas E,
Thymelli I and Bartsocas CS: Seasonal variation of type 1 diabetes
mellitus diagnosis in Greek children. Hormones (Athens). 10:67–71.
2011. View Article : Google Scholar : PubMed/NCBI
|
|
5
|
Atkinson MA, Eisenbarth GS and Michels AW:
Type 1 diabetes. Lancet. 383:69–82. 2014. View Article : Google Scholar : PubMed/NCBI
|
|
6
|
Boerner BP and Sarvetnick NE: Type 1
diabetes: Role of intestinal microbiome in humans and mice. Ann NY
Acad Sci. 1243:103–118. 2011. View Article : Google Scholar : PubMed/NCBI
|
|
7
|
Carlsson P and Mahlapuu M: Forkhead
transcription factors: Key players in development and metabolism.
Dev Biol. 250:1–23. 2002. View Article : Google Scholar : PubMed/NCBI
|
|
8
|
Concannon P, Rich SS and Nepom GT:
Genetics of type 1A diabetes. N Engl J Med. 360:1646–1654. 2009.
View Article : Google Scholar : PubMed/NCBI
|
|
9
|
Rifai N and Ridker PM: Proposed
cardiovascular risk assessment algorithm using high-sensitivity
C-reactive protein and lipid screening. Clin Chem. 47:28–30.
2001.PubMed/NCBI
|
|
10
|
Bolstad BM, Irizarry RA, Astrand M and
Speed TP: A comparison of normalization methods for high density
oligonucleotide array data based on variance and bias.
Bioinformatics. 19:185–193. 2003. View Article : Google Scholar : PubMed/NCBI
|
|
11
|
Irizarry RA, Bolstad BM, Collin F, Cope
LM, Hobbs B and Speed TP: Summaries of Affymetrix GeneChip probe
level data. Nucleic Acids Res. 31:e152003. View Article : Google Scholar : PubMed/NCBI
|
|
12
|
Szklarczyk D, Franceschini A, Kuhn M,
Simonovic M, Roth A, Minguez P, Doerks T, Stark M, Muller J, Bork
P, et al: The STRING database in 2011: Functional interaction
networks of proteins, globally integrated and scored. Nucleic Acids
Res. 39:D561–D568. 2011. View Article : Google Scholar : PubMed/NCBI
|
|
13
|
Srihari S and Ragan MA: Systematic
tracking of dysregulated modules identifies novel genes in cancer.
Bioinformatics. 29:1553–1561. 2013. View Article : Google Scholar : PubMed/NCBI
|
|
14
|
Tomita E, Tanaka A and Takahashi H: The
worst-case time complexity for generating all maximal cliques and
computational experiments. Theor Comput Sci. 363:28–42. 2006.
View Article : Google Scholar
|
|
15
|
Rosner B, Glynn RJ and Lee ML:
Incorporation of clustering effects for the Wilcoxon rank sum test:
A large-sample approach. Biometrics. 59:1089–1098. 2003. View Article : Google Scholar : PubMed/NCBI
|
|
16
|
Jin S, Li Y, Pan R and Zou X:
Characterizing and controlling the inflammatory network during
influenza A virus infection. Sci Rep. 4:37992014. View Article : Google Scholar : PubMed/NCBI
|
|
17
|
Ma H, Hostuttler M, Wei H, Rexroad CE III
and Yao J: Characterization of the rainbow trout egg microRNA
transcriptome. PLoS One. 7:e396492012. View Article : Google Scholar : PubMed/NCBI
|
|
18
|
Berry LD and Gould KL: Regulation of Cdc2
activity by phosphorylation at T14/Y15. Prog Cell Cycle Res.
2:99–105. 1996. View Article : Google Scholar : PubMed/NCBI
|
|
19
|
Pollok S, Bauerschmidt C, Sänger J,
Nasheuer HP and Grosse F: Human Cdc45 is a proliferation-associated
antigen. FEBS J. 274:3669–3684. 2007. View Article : Google Scholar : PubMed/NCBI
|
|
20
|
Iwasaki N, Okabe I, Momoi MY, Ohashi H,
Ogata M and Iwamoto Y: Splice site mutation in the hepatocyte
nuclear factor-1 beta gene, IVS2nt + 1G>A, associated with
maturity-onset diabetes of the young, renal dysplasia and
bicornuate uterus. Diabetologia. 44:387–388. 2001. View Article : Google Scholar : PubMed/NCBI
|