Introduction
Saccharum Alhagi is a type of granulated sugar that
is condensed from the secreted fluid of the leaves of Alhagi
pseudalhagi Desv. Alhagi pseudalhagi Desv. is a
deciduous shrub of leguminous plants and has prickly branches, oval
shaped leaves, pink flowers and pods (1). Furthermore, it has honey glands both
inside and outside the flowers. The glands outside the flowers
secrete fluids that condense into granulated Saccharum Alhagi that
has a round shape, light yellow color and sweet taste. Saccharum
Alhagi is harvested from July to September every year and may be
used as medicine immediately (1). In
Xinjiang, it is often used as a Uyghur medicine for the treatment
of pediatric cold (2).
Polysaccharides are natural macromolecular compounds. In recent
years, polysaccharides have been used as broad spectrum immune
promoters for immune regulation (3).
In addition, polysaccharides have exhibited a broad range of
pharmacological activities against infection, hyperglycemia,
hyperlipidemia, oxidization and tumors (4). Studies have demonstrated that
polysaccharides are able to activate T and B lymphocytes,
macrophages and natural killer cells, stimulate the generation of
cytokines and antibodies, and regulate immune functions of the body
(5,6).
Macrophages are immune effector cells with defensive
and regulatory functions, which actively phagocytose foreign
antigens or pathogenic microorganisms, and trigger an immune
response (7,8). A previous study demonstrated that the
main components of Saccharum Alhagi are polysaccharides with
antioxidant activities and in vivo immune activities
(9,10). Saccharum Alhagi polysaccharides (SAP)
are products that are obtained by water extraction and alcohol
precipitation, and are subjected to alcohol precipitation with
different gradients (11). The
product SAP-1 is obtained by 50% alcohol precipitation, and SAP-2
is obtained by 80% alcohol precipitation (11). Although in vitro immune
activities of SAP have been studied, the specific effects of SAP-1
and SAP-2 have not been elucidated. Therefore, the present study
investigated the in vitro immune activities of SAP-1 and
SAP-2, and their effects on immune cells, immunocytokines and the
regulation of the expression of associated genes.
Materials and methods
Cells
Mouse RAW264.7 mononuclear macrophages were
purchased from Boster Biological Technology, Ltd. (Wuhan, China)
and cultured in Dulbecco's modified Eagle's medium (NAE1388; GE
Healthcare Life Sciences, Little Chalfont, UK) supplemented with
10% fetal bovine serum (NZJ1221; Thermo Fisher Scientific, Inc.,
Waltham, MA, USA). SAP were obtained by water extraction and
alcohol precipitation, and subjected to alcohol precipitation with
different gradients as described previously (11). SAP-1 was prepared using 50% alcohol
precipitation, and SAP-2 was obtained using 80% alcohol
precipitation as described previously (11). The cells were adjusted to a density
of 5×10⁴ cells/ml, and cultured in Dulbecco's Modified
Eagle Medium supplemented with 10% fetal bovine serum, 0.5%
penicillin and 0.5% streptomycin (all from Thermo Fisher
Scientific, Inc., Waltham, MA, USA) at 37°C for 5 days. Then, 150
mg/l (low), 300 mg/l (medium) or 600 mg/l (high) concentrations of
SAP-1 or SAP-2, or 10 mg/l lipopolysaccharide (LPS; L2880;
Biosharp, Inc., Hefei, China) were added. Cells that were not
treated with SAP or LPS were used as negative control.
MTT assay
An MTT assay was performed to investigate the
proliferation of the cells (cat. no. 150206; Shanghai Regal
Biotechnology, Inc., Shanghai, China), and the cells were observed
under a fluorescent inverted microscope (Zeiss Axio Observer Z1;
Carl Zeiss AG, Jena, Germany) according to previous reports
(12,13). Dimethyl sulfoxide was used to
dissolve purple formazan and 490 nm was used to measure the levels
of formazan. Each concentration was tested in triplicate. The
stimulation index (SI) was calculated as follows: SI=(optical
density of experimental group-optical density of non-cell blank
control group)/(optical density of negative control group-optical
density of non-cell blank control group). Cells that were not
treated were used as negative control. The non-cell blank control
group had medium but not any cells in the container.
Hoechst 33528 staining
The cells (5×10⁴/ml; 100 µl) were
cultured at 37°C for 24 h in an atmosphere containing 5%
CO2, and different concentrations (150, 300, and 600
mg/l) of SAP-1 and SAP-2 were added. After 24 h of incubation,
paraformaldehyde was added for fixation at 37°C for 15 min.
Following staining using Hoechst 33528 fluorescent dye at 37°C for
15 min, the samples were washed with PBS and observed under a
fluorescence inverted microscope (Leica DMI6000B; Leica
Microsystems GmbH, Wetzlar, Germany).
Griess test
The cells were cultured at 37°C in an atmosphere
containing 5% CO2, and different concentrations (150,
300, and 600 mg/l) of SAP-1 and SAP-2 were added. The Griess method
was performed to determine the levels of nitric oxide (NO)
according to the protocol described in a previous study (14), and the absorbance was read at 540 nm
using a microplate reader (Benchmark Plus; Bio-Rad Laboratories,
Inc., Hercules, CA, USA).
Neutral red uptake assay
The cells were cultured at 37°C in an atmosphere
containing 5% CO2, and different concentrations (150,
300, and 600 mg/l) of SAP-1 and SAP-2 were added. Following
incubation for 24 h, the cells were washed with PBS twice prior to
the addition of neutral red saline solution. Following incubation
at 37°C for 30 min, the supernatant was discarded and the cells
were washed with PBS twice. Following the addition of 100 µl cell
lysis solution (ethanol:glacial acetic acid, 1:1), the cells were
incubated at 37°C for 4 h. Finally, the optical density was
measured at 540 nm.
ELISA
The cells were cultured at 37°C in an atmosphere
containing 5% CO2, and different concentrations (150,
300, and 600 mg/l) of SAP-1 and SAP-2 were added. After incubation
for 24 h, the supernatants were collected for ELISAs of interleukin
(IL)-2, IL-1β and tumor necrosis factor-α (TNF-α) using respective
kits (cat nos. SBJ003780, SBJ003780 and SBJ003780, respectively;
Nanjing Senbeijia Biological Technology Co., Ltd., Nanjing, China)
as previously reported (15–17).
Reverse transcription-quantitative
polymerase chain reaction (RT-qPCR)
The cells were cultured at 37°C in an atmosphere
containing 5% CO2, and different concentrations (150,
300, and 600 mg/l) of SAP-1 and SAP-2 were added prior to
incubation for another 24 h. Next, the cells were trypsinized,
centrifuged at 1,000 × g (25°C) for 20 min and lysed in 1 ml TRIzol
(Thermo Fisher Scientific, Inc.). Following lysis, the supernatant
was collected and mixed with chloroform. Following centrifugation
at 5,000 × g (−4°C) for 15 min, the supernatant was mixed with
isopropanol. The sample was centrifuged at 5,000 × g (−4°C) for 10
min, and the supernatant discarded. The residue was washed with 75%
ethanol, and the total RNA was eluted with diethyl pyrocarbonate
water (18–21). The purity of RNA was determined from
the A260/A280 ratio using ultraviolet spectrophotometry (Nanodrop
ND1000; Thermo Fisher Scientific, Inc.). Next, cDNA was obtained by
reverse transcription (High-Capacity cDNA Reverse Transcription
Kit, cat. no. 4368813; Thermo Fisher Scientific, Inc.) from 1 µg
RNA and stored at −20°C. The reverse transcription protocol was
42°C for 60 min, followed by 70°C for 5 min. To measure the mRNA
expression, qPCR was performed (DyNAmo Flash SYBR Green qPCR Kit,
cat. no. F415S; Thermo Fisher Scientific, Inc.) using β-actin as an
internal reference. The primer sequences are listed in Table I (Sangon Biotech Co., Ltd., Shanghai,
China). The reaction system (20 µl) contained 2 µl cDNA, 10 µl mix,
1 µl upstream and 1 µl downstream primer and 6 µl ddH2O.
The PCR protocol used was as follows: Initial denaturation at 95°C
for 3 min; 40 cycles of denaturation at 95°C for 10 sec, followed
by annealing at 57°C for interferon (IFN)-γ, TNF-α and inducible
nitric oxide synthase (iNOS), 55°C for IL-1β, 58°C for nuclear
factor-κB (NF-κB) and 56°C for β-actin for 30 sec, and elongation
at 72°C for 10 sec (iQ5; Bio-Rad Laboratories, Inc.). The
2−ΔΔCq method (22) was
used to calculate the relative expression of mRNA (21).
 | Table I.Primer sequences of target genes and
the internal reference gene. |
Table I.
Primer sequences of target genes and
the internal reference gene.
| Genes | Primer sequences |
|---|
| IFN-γ | Forward:
5′-CACAGCCCTCTCCATCAACT-3′ |
|
| Reverse:
5′-GCATCTTCTCCGTCATCTCC-3′ |
| TNF-α | Forward:
5′-AGGCACTCCCCCAAAAGAT-3′ |
|
| Reverse:
5′-CAGTAGACAGAAGAGCGTGGTG-3′ |
| NF-κB | Forward:
5′-TGGTGGAGAACTTTGAGCCT-3′ |
|
| Reverse:
5′-GGAATTTCCAGCAGTTTGC-3′ |
| IL-1β | Forward:
5′-TTGACAGTGATGAGAATGACCTG-3′ |
|
| Reverse:
5′-GCTCTTGTTGATGTGGTGCTGCT-3′ |
| iNOS | Forward:
5′-AGGGAATCTTGGAGCGAGTT-3′ |
|
| Reverse:
5′-GCAGCCTCTTGTCTTTGACC-3′ |
| β-actin | Forward:
5′-GCCGTCCTCTCTCTGTATGC-3′ |
|
| Reverse:
5′-GGGGACAGTGTGGCTGAC-3′ |
Statistical analysis
The results were analyzed using SPSS v17.0
statistical software (IBM Corp., Armonk, NY, USA). Data are
expressed as the mean ± standard deviation. Each test was performed
in triplicate. One-way analysis of variance and Dunnett's T3 method
were used to analyze the data. P<0.05 was considered to indicate
a statistically significant result.
Results
SAP is not cytotoxic and promotes the
proliferation of RAW264.7 cells
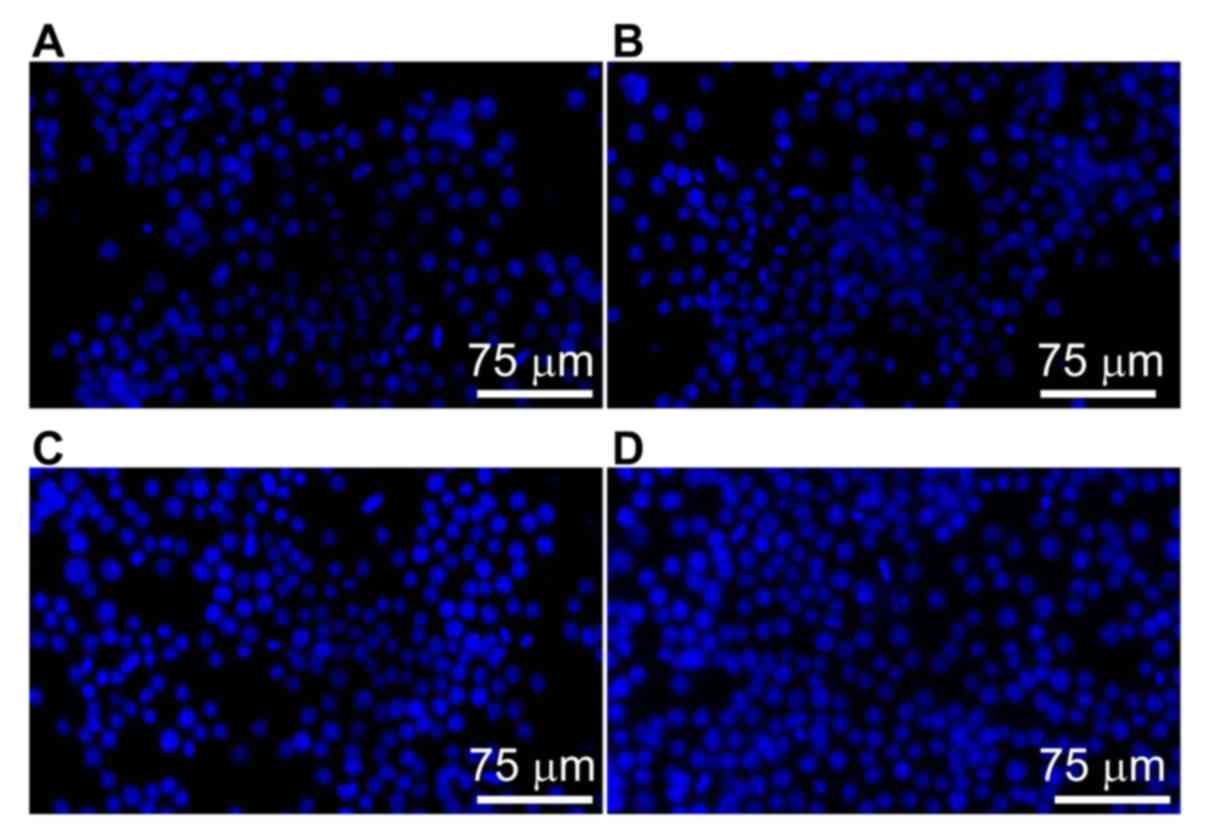
To visualize the nuclei of the RAW264.7 cells,
Hoechst 33528 staining was performed. RAW264.7 cells in the control
group exhibited evenly dispersed blue fluorescence, and the nuclei
were not aggregated (Fig. 1A).
Following treatment with low or medium concentrations of SAP
mixture, the number of blue nuclei was increased (Fig. 1B and C). Following treatment with a
high concentration of SAP, the nuclear aggregation became more
evident, and most of the blue nuclei were intact (Fig. 1D). These observations indicate that
SAP exhibited no cytotoxicity and promoted the proliferation of
RAW264.7 cells.
SAP increases the proliferative
activity of RAW264.7 cells and activates their immune function
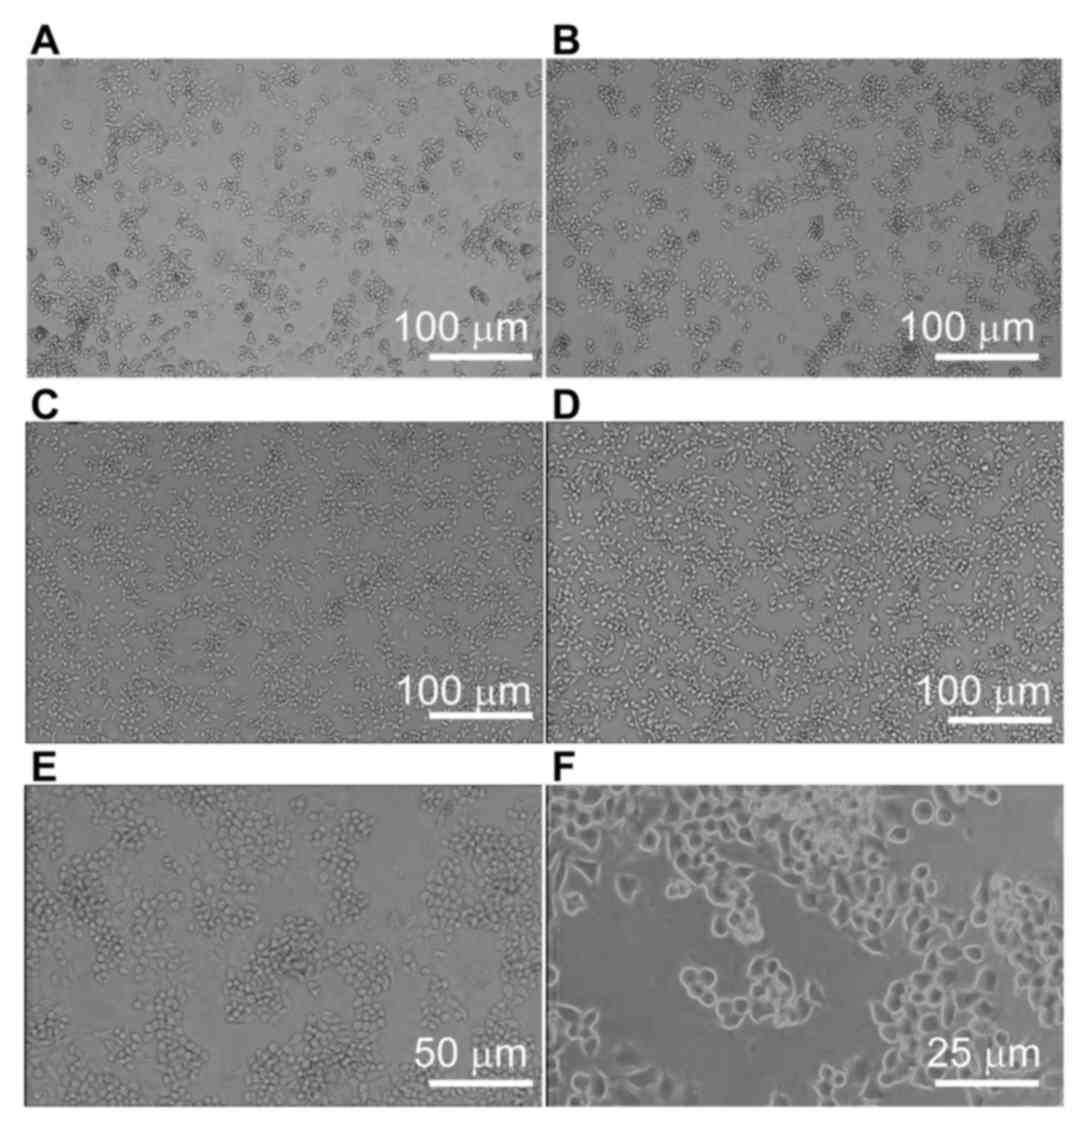
To observe the effect of SAP on the morphology of
RAW264.7 cells, the cells were observed under a fluorescence
inverted microscope. In the control group, the RAW264.7 cells were
loosely distributed (Fig. 2A).
Following treatment with a low concentration of SAP, the number of
RAW264.7 cells was increased (Fig.
2B). Following treatment with medium or high concentrations of
SAP, the number of RAW264.7 cells was further increased (Fig. 2C and D). Furthermore, when viewed
under a microscope at a higher magnification (×100), the
morphologies of the RAW264.7 cells following treatment with a high
concentration of SAP were round, reniform or oval, and the cells
were dispersed (Fig. 2E). Under an
even higher magnification (×200), RAW264.7 cells following
treatment with high concentration of SAP developed pseudopodia,
where the cells became irregular ellipses, and aggregated together
in certain dense areas (Fig. 2F).
These observations indicate that SAP increased the proliferative
activity of RAW264.7 cells, and activated their immune
function.
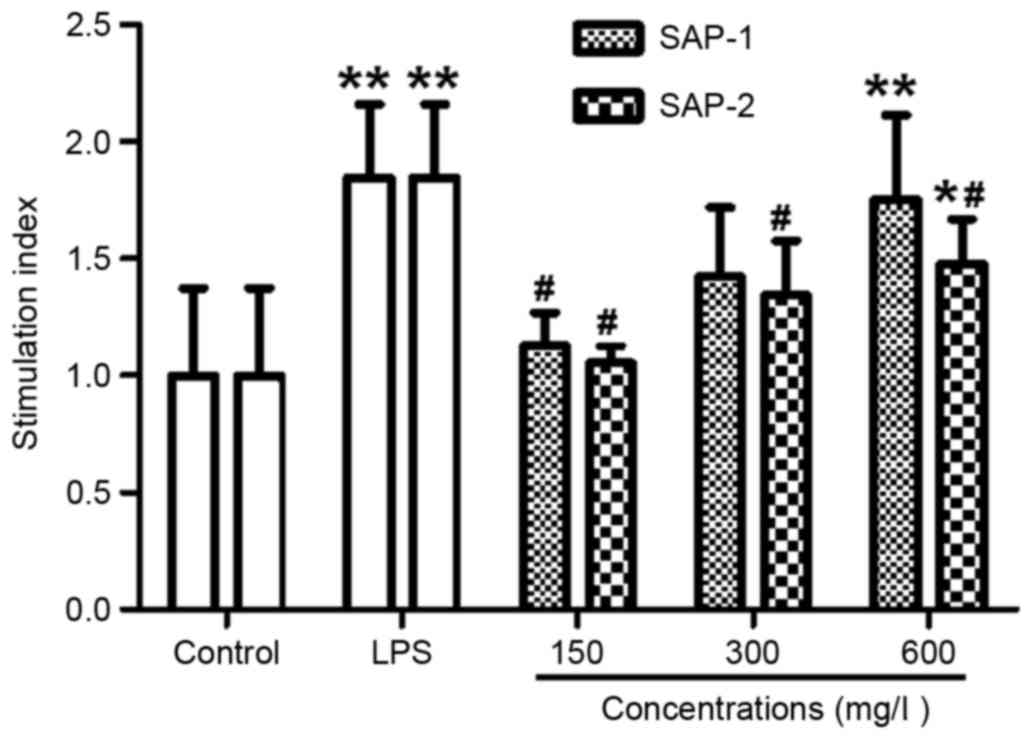
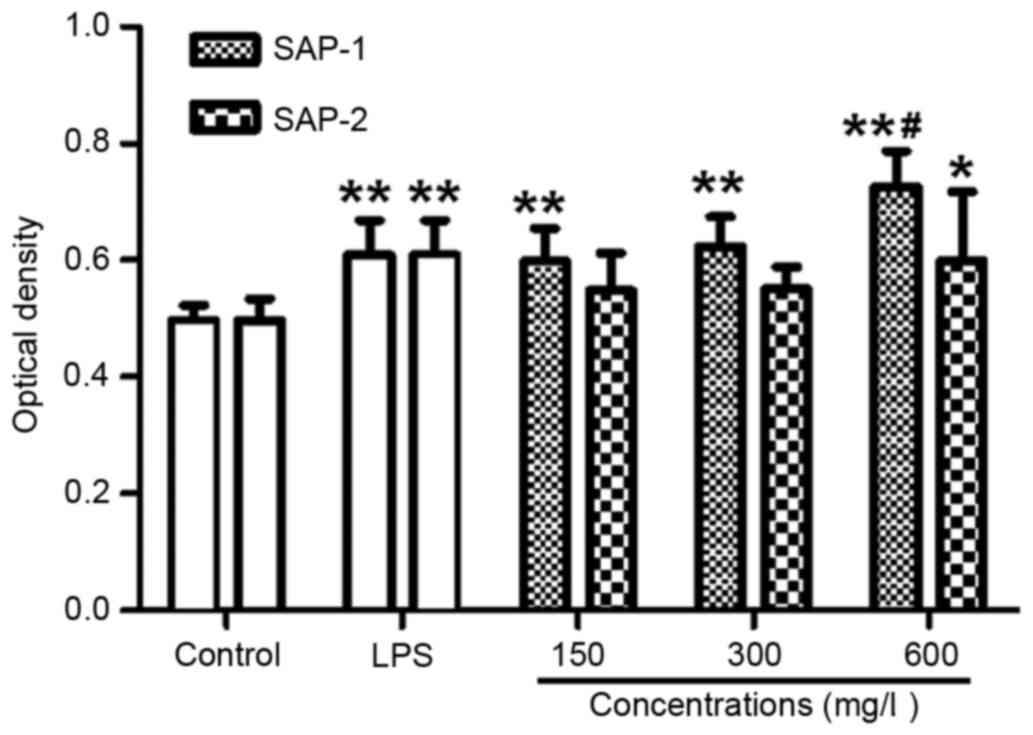
SAP-1 has a stronger effect than SAP-2
in promoting RAW264.7 cell proliferation
The number of macrophages was observed to increase
following SAP intervention when examined using a microscope. To
further study the effects of SAP-1 and SAP-2 on the proliferation
of RAW264.7 cells, an MTT assay was performed. The data revealed
that a high concentration of SAP-1 or SAP-2, or 10 mg/l LPS
resulted in a significantly higher SI than the control (P<0.05).
In addition, the SI in the presence of a medium or high
concentration of SAP-1 was not significantly different from that in
the LPS group (P>0.05), whereas the SI in all concentration
groups of SAP-2 was significantly lower compared with that of the
LPS group (P<0.05; Fig. 3). These
results indicate that SAP-1 had a stronger effect in promoting
RAW264.7 cell proliferation than did SAP-2.
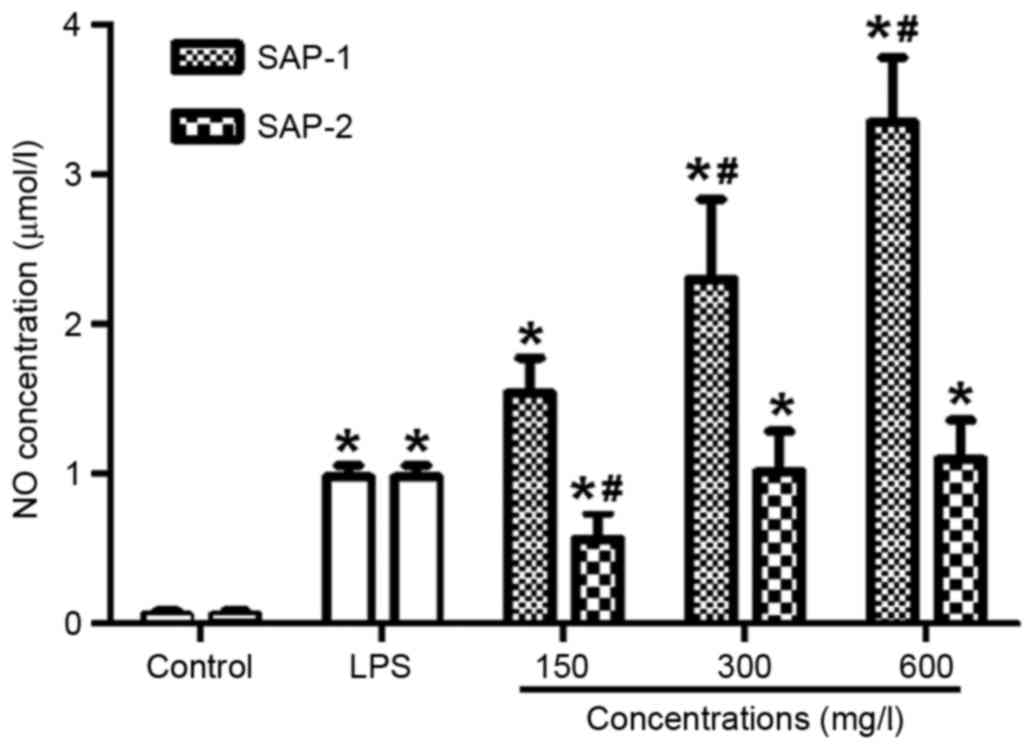
SAP-1 and SAP-2 significantly increase
the level of NO secreted by RAW264.7 cells, with SAP-1 having a
stronger effect than SAP-2
NO produced by activated macrophages is able to kill
or inhibit the growth of several types of microorganisms in the
body (23). It is an important index
with which to evaluate the immune activity of macrophages. To
measure the level of NO secreted by RAW264.7 cells, the Griess
method was used. Following treatment with different concentrations
of SAP-1, the levels of NO were significantly increased compared
with those in the control, in a dose-dependent manner (P<0.01).
In addition, the effect of medium and high concentrations of SAP-1
was significantly stronger than that of LPS (P<0.05). As the
concentrations of SAP-2 increased, the NO levels were significantly
increased compared with those of the control (P<0.01), but the
effect of SAP-2 appeared smaller than that of SAP-1. It is
noteworthy that the effect of a low concentration of SAP-2 was
significantly weaker than that of LPS (P<0.05; Fig. 4). These results indicate that SAP-1
and SAP-2 significantly increased the level of NO secreted by
RAW264.7 cells, with the effect of SAP-1 being stronger than that
of SAP-2.
SAP-1 increases the phagocytic
activity of RAW264.7 cells
The main function of macrophages in the immune
system is to serve a role in the phagocytosis of foreign materials
(24). Examination of phagocytosis
by RAW264.7 cells is an important means by which to investigate the
immune activity of these cells. A neutral red uptake assay was
employed to determine the phagocytic activity of the RAW264.7
cells. The data revealed that treatment with all concentrations of
SAP-1 increased the optical density compared with the control
(P<0.01). Furthermore, the optical density in the presence of a
low or medium concentration of SAP-1 was not significantly
different from that in the LPS group (P>0.05), but the optical
density of the high concentration SAP-1 group was significantly
higher compared with that of the LPS group (P<0.01). The effect
of SAP-2 was not as strong as that of SAP-1. Additionally, the
optical density in the presence of a low or medium concentration of
SAP-2 was not significantly different from that in the control
group (P>0.05), while the optical density in the high SAP-2
concentration group was significantly higher than that in the
control (P<0.05), but not significantly different from that in
the LPS group (P>0.05; Fig. 5).
These results indicate that SAP-1 increased the phagocytic activity
of RAW264.7 cells.
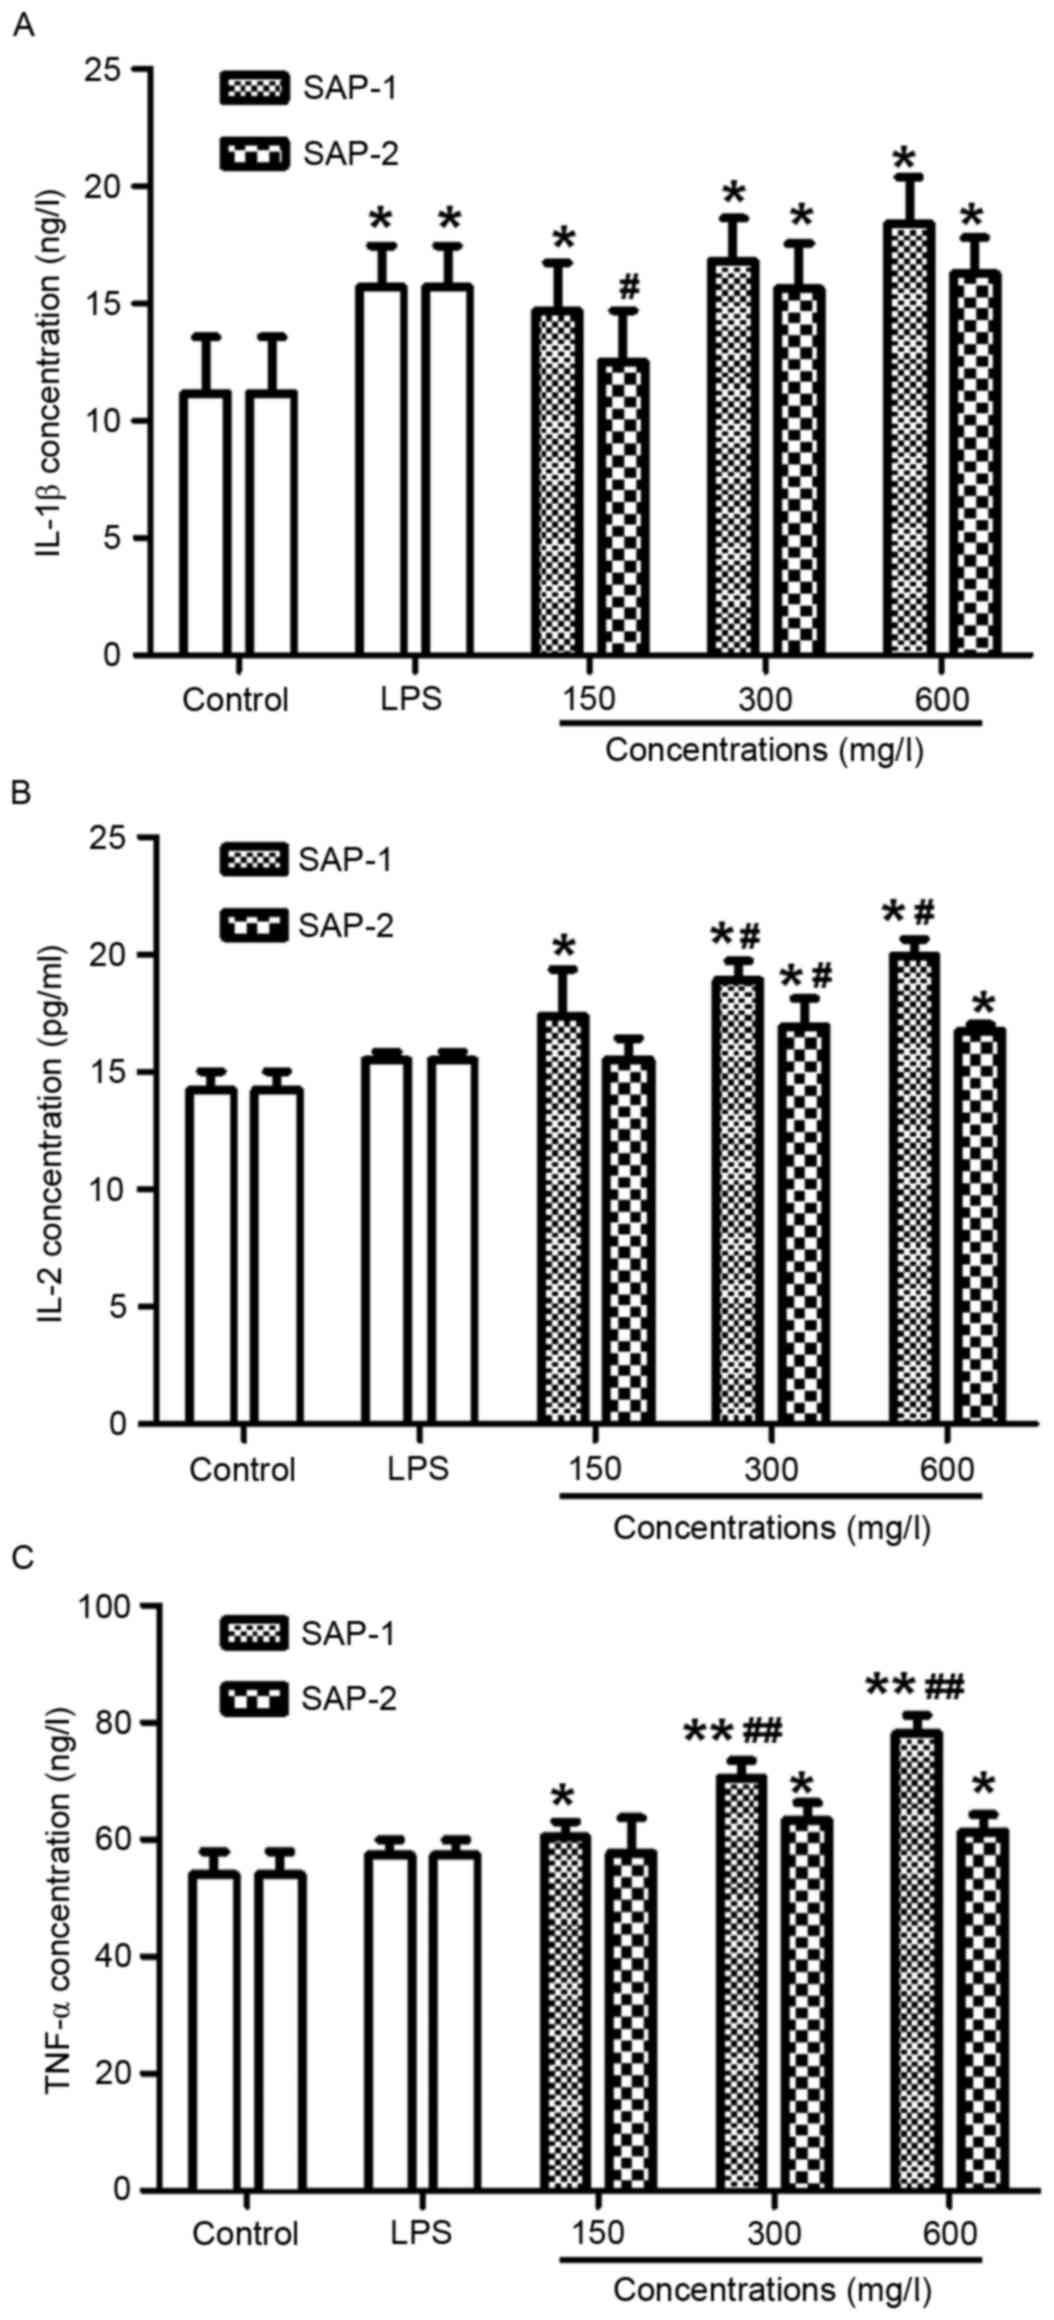
SAP-1 promotes the secretion of IL-1β,
IL-2 and TNF-α cytokines by RAW264.7 cells, with an effect that is
stronger than SAP-2
IL-1β, IL-2 and TNF-α are mainly produced by
activated macrophages, and can be involved in immune responses
(25). Notably, IL-1β can
significantly stimulate the secretion of antibodies by these cells
(26). To test how SAP-1 and SAP-2
affect the secretion of cytokines by RAW264.7 cells, ELISAs were
performed. The data demonstrated that the concentrations of IL-1β,
IL-2 and TNF-α following treatment with all concentrations of SAP-1
were significantly higher compared with those in the control
(P<0.05), with the effect of high concentration of SAP-1 being
the strongest (Fig. 6). A low
concentration of SAP-2 failed to significantly increase the
concentrations of IL-1β, IL-2 and TNF-α (P>0.05), but medium and
high concentrations of SAP-2 significantly elevated the
concentrations of IL-1β, IL-2 and TNF-α compared with the control
(P<0.05), to levels similar to those of the LPS group
(P>0.05; Fig. 6). These results
indicate that SAP-1 promoted the secretion of IL-1β, IL-2 and TNF-α
by RAW264.7 cells, with an effect that was stronger than that of
SAP-2.
Different concentrations of SAP-1 or
SAP-2 possess distinct effects in upregulating the expression of
TNF-α, IL-1β, NF-κB and iNOS mRNA
RT-qPCR was employed to measure the mRNA expression
of IFN-γ, TNF-α, IL-1β, NF-κB and iNOS. The data revealed that
treatment with all concentrations of SAP-1 or SAP-2 had no effect
on the IFN-γ mRNA level compared with the control (P>0.05), but
IFN-γ mRNA levels in all SAP-1 or SAP-2 concentration groups were
significantly lower than those in the LPS group (P<0.05;
Fig. 7A). The level of TNF-α mRNA in
the high SAP-1 concentration group was significantly higher
compared with those in the control and LPS groups (both P<0.05).
In addition, the level of TNF-α mRNA in the low SAP-2 concentration
group was significantly lower than those in the control and LPS
groups (both P<0.05). For other concentrations of SAP-1 or
SAP-2, the levels of TNF-α mRNA were not significantly different
from either control or LPS values (P>0.05; Fig. 7B).
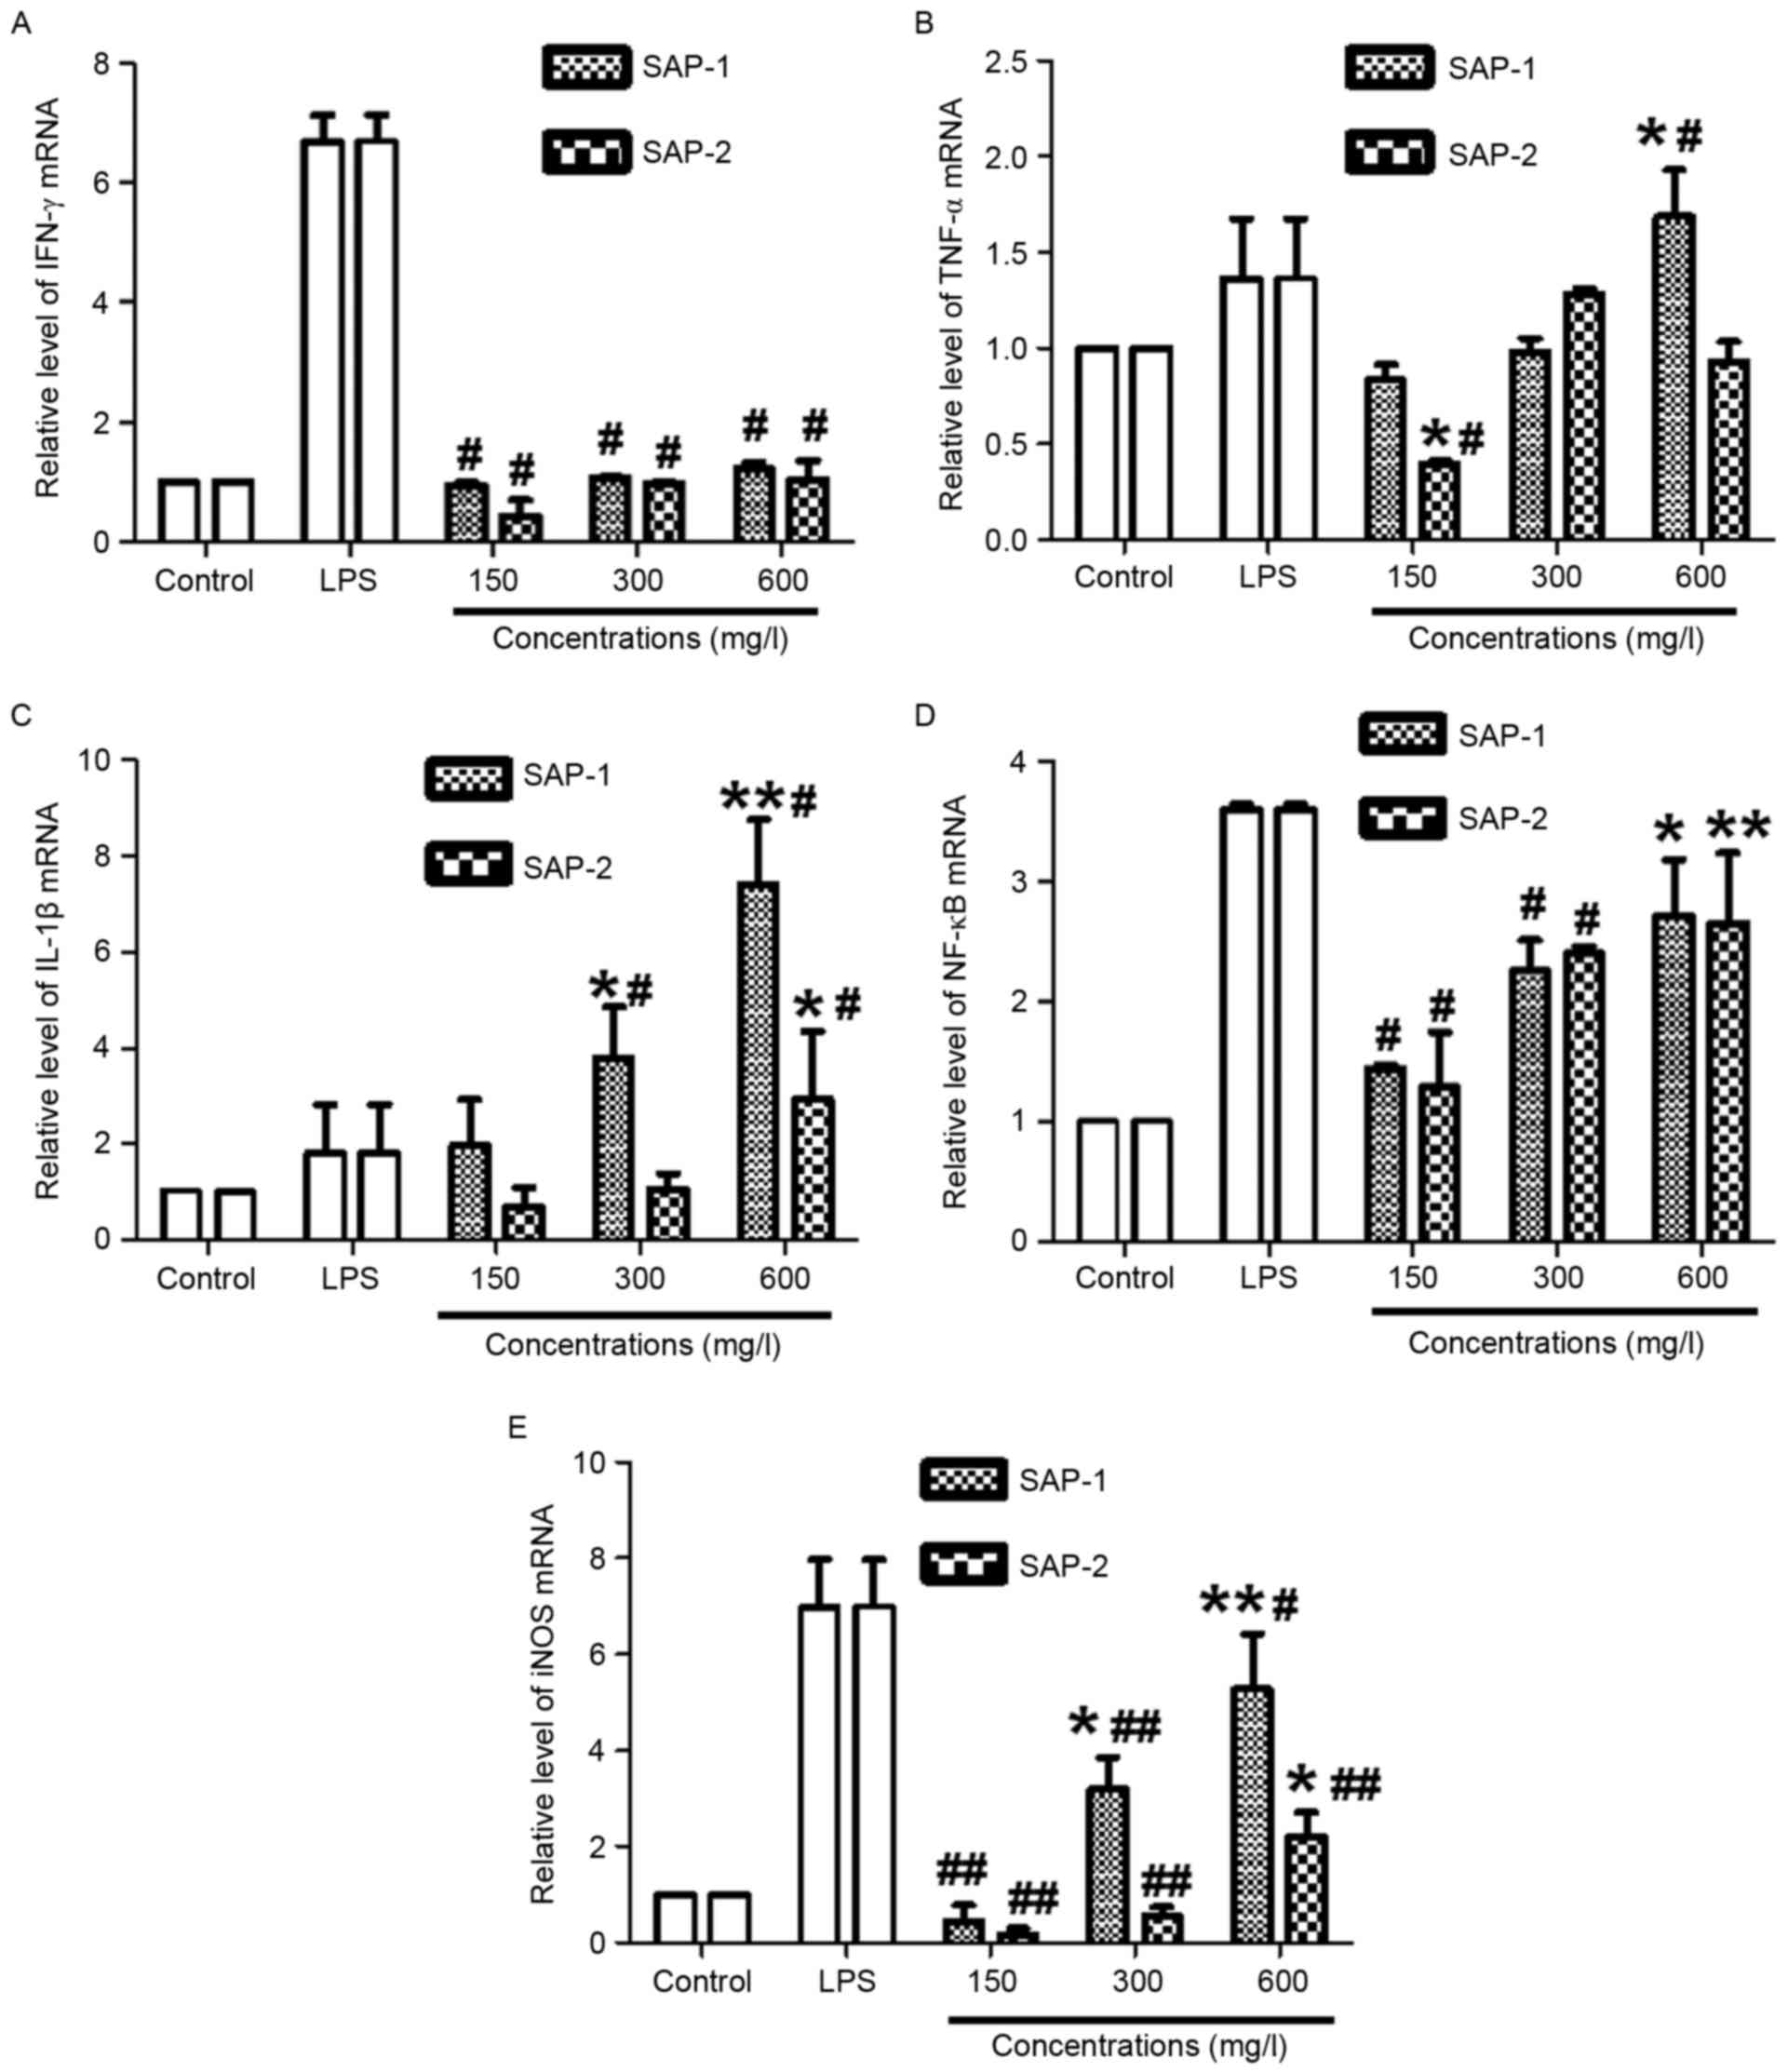 | Figure 7.Effect of treatment with SAP-1 or
SAP-2 on the mRNA expression of (A) IFN-γ, (B) TNF-α, (C) IL-1β,
(D) NF-κB and (E) iNOS in RAW264.7 cells. RAW264.7 cells
(5×10⁴ cells/ml) were treated with SAP-1, SAP-2 or 10
mg/l LPS and incubated at 37°C for 24 h. Expression of mRNA was
measured using reverse transcription-quantitative polymerase chain
reaction. *P<0.05 and **P<0.01 vs. the control;
#P<0.05 and ##P<0.01 vs. the LPS group.
SAP, Saccharum Alhagi polysaccharides; IFN-γ, interferon-γ; TNF-α,
tumor necrosis factor-α; IL-1β, interleukin-1β; NF-κB, nuclear
factor-κB; iNOS, inducible nitric oxide synthase; LPS,
lipopolysaccharide. |
The levels of IL-1β mRNA in the medium and high
SAP-1 concentration groups were significantly higher compared with
those in the control and LPS groups (all P<0.05). In addition,
the level of IL-1β mRNA in the high SAP-2 concentration group was
significantly higher than that in the control or LPS group (both
P<0.05). However, for the other concentrations of SAP-1 or
SAP-2, the levels of IL-1β mRNA were not significantly different
from those in the control and LPS groups (P>0.05; Fig. 7C). The level of NF-κB mRNA in the
high SAP-1 concentration group was significantly higher than that
in the control (P<0.05), while the levels of NF-κB mRNA in the
low and medium SAP-1 concentration groups were significantly lower
than that in the LPS group (P<0.05). In addition, the level of
NF-κB mRNA in the high SAP-2 concentration group was significantly
higher than that in the control (P<0.01), while the levels of
NF-κB mRNA in the low and medium SAP-2 concentration groups were
significantly lower than that in the LPS group (P<0.05; Fig. 7D). The level of iNOS mRNA in the
medium or high SAP-1 concentration group was significantly higher
than that in the control (P<0.05), while the levels of iNOS mRNA
in the low, medium or high SAP-1 concentration group was
significantly lower than that in the LPS group (P<0.05). In
addition, the level of iNOS mRNA in the high SAP-2 concentration
group was significantly higher than that in the control
(P<0.01), while the levels of iNOS mRNA in the low, medium or
high SAP-2 concentration group was significantly lower than that in
the LPS group (P<0.01; Fig. 7E).
These results indicate that the different concentrations of SAP-1
or SAP-2 exhibited distinct effects in upregulating the expression
of TNF-α, IL-1β, NF-κB and iNOS mRNA.
Discussion
Macrophages serve important roles in immunity,
protecting the body from pathogen invasion (16). The present study investigated the
effect of SAP on the activity of RAW264.7 macrophages. Hoechst
33528 staining and morphological examination revealed that SAP was
not toxic to RAW264.7 cells, and stimulated the proliferation
activity of RAW264.7 cells. SAP-1 and SAP-2 promoted the
proliferation of RAW264.7 cells in a dose-dependent manner, with
the effect of SAP-1 being stronger than that of SAP-2. Furthermore,
macrophages have strong phagocytic activity, which serves to defend
the body and to remove waste (24).
The present study demonstrated that SAP-1 enhanced the phagocytic
activity of RAW264.7 cells.
NO is an important macrophage immune effector
molecule that is involved in immune regulation and the defense
response, and its production is regulated by iNOS (23). When stimulated, Raw264.7 cells
produce abundant quantities of NO, which assists macrophages in the
immune response against pathogens (20). The results of the present study
demonstrate that SAP-1 increased the levels of iNOS gene expression
in RAW264.7 cells, and increased the production of NO by RAW264.7
cells. This indicates that SAP increases the immune activity of
RAW264.7 cells by enhancing the level of NO produced by iNOS.
Cytokines serve important roles in cellular immune
responses, and a variety of immune cell interactions are mediated
by cytokines (8). The present study
investigated the effects of SAP-1 and SAP-2 on the secretion and
expression of cytokines by RAW264.7 cells. Following treatment with
a high concentration of SAP-1, RAW264.7 cells strongly secreted
IL-1β, IL-2 and TNF-α, and the results of mRNA expression analysis
were consistent with this. By contrast, the effect of SAP-2 was
weaker. NF-κB is a key transcription factor in the regulation of
immune response (27). It promotes
the expression of genes encoding numerous cytokines, leading to
increased secretion of these cytokines; for example, NF-κB
activates TNF-α and IL-1β, and regulates the relevant immune
responses (12,21). The present study revealed that SAP-1
and SAP-2 upregulated the mRNA expression of NF-κB.
The molecular weight of SAP-1 is >14.5 kDa, and
that of SAP-2 is <8.4 kDa (11).
In the present study, SAP-1 exhibited a stronger effect on
cytokines than did SAP-2, indicating that SAP with the higher
molecular weight has a stronger immune activity on RAW264.7 cells.
In addition, the present study indicated that SAP-1 may activate
RAW264.7 cells by promoting the expression and secretion of TNF-α,
IL-1β and iNOS via the NF-κB signaling pathway.
In conclusion, the present study indicates that SAP
increases the immune activity of RAW264.7 macrophages, and promotes
the immune function of the body by increasing the expression of
cytokines and related genes. However, the exact pathway and
mechanism by which SAP exerts immune effects on immune cells
requires investigation in further studies.
Acknowledgements
The present study was supported by the National
Natural Science Foundation of China (grant no. 81460633).
Competing interests
The authors declare that they have no competing
interests.
References
|
1
|
Rukeyamu Shadike: Commonly used herbs in
Uygur medicine (Written in Uygur). Xinjiang Science and Technology
Press; Urumqi: pp. 2841993
|
|
2
|
Wu J, Li GR and Chang JM: Study on the
extraction technology of polysaccharides from Saccharum Alhagi.
Chin Traditional Patent Med. 33:9032011.(In Chinese).
|
|
3
|
Gong Y, Wu J and Li ST: Immuno-enhancement
effects of Lycium ruthenicum Murr. Polysaccharide on
cyclophamide-induced immunosuppression in mice. Int J Clin Exp Med.
8:20631–20637. 2015.PubMed/NCBI
|
|
4
|
Sun H, Zhang J, Chen F, Chen X, Zhou Z and
Wang H: Activation of RAW264.7 macrophages by the polysaccharide
from the roots of Actinidia eriantha and its molecular mechanisms.
Carbohydr Polym. 121:388–402. 2015. View Article : Google Scholar : PubMed/NCBI
|
|
5
|
Brynjolfsson SF, Henneken M, Bjarnarson
SP, Mori E, Del Giudice G and Jonsdottir I: Hyporesponsiveness
following booster immunization with bacterial polysaccharides is
caused by apoptosis of memory B cells. J Infect Dis. 205:422–430.
2012. View Article : Google Scholar : PubMed/NCBI
|
|
6
|
Yao L, Wang Z, Zhao H, Cheng C, Fu X, Liu
J and Yang X: Protective effects of polysaccharides from soybean
meal against X-ray radiation induced damage in mouse spllen
lymphocytes. Int J Mol Sci. 12:8096–8104. 2011. View Article : Google Scholar : PubMed/NCBI
|
|
7
|
Jin Y, Tachibana I, Takeda Y, He P, Kang
S, Suzuki M, Kuhara H, Tetsumoto S, Tsujino K, Minami T, et al:
Statins decrease lung inflammation in mice by upregulating
tetraspanin CD9 in macrophages. PLoS One. 8:e737062013. View Article : Google Scholar : PubMed/NCBI
|
|
8
|
Wu M, Luo X, Xu X, Wei W, Yu M, Jiang N,
Ye L, Yang Z and Fei X: Antioxidant and immunomodulatory activities
of a polysaccharide from Flammulina velutipes. J Tradit Chin Med.
34:733–740. 2014. View Article : Google Scholar : PubMed/NCBI
|
|
9
|
Zhao J, Li GR and Zheng J: Screening of
polysaccharides with antioxidant activities from Saccharum Alhagi.
J Xinjiang Med Univ. 38:1479–1481. 2015.(In Chinese).
|
|
10
|
Han Z, He J and Chang J: The influence of
polysaccharides from Saccharum Alhagi on the immune activity of
macrophage cell line RAW264.7. J Xinjiang Med Univ. 40:361–365.
2017.(In Chinese).
|
|
11
|
Jian L, Li G and Chang J: Determination of
monosaccharide composition in polysaccharide of alhagi-honey by
pre-column derivatization-high performance capillary
electrophoresis. Chin J N Drugs. 21:78–81. 2012.
|
|
12
|
Su KY, Yu CY, Chen YP, Hua KF and Chen YL:
3,4-dihydroxytoluene, a metabolite of rutin, inhibits inflammatory
responses in lipopolysaccharide-activated macrophages by reducing
the activation of NF-κB signaling. BMC Complement Altern Med.
14:212014. View Article : Google Scholar : PubMed/NCBI
|
|
13
|
Kim KS, Cui X, Lee DS, Sohn JH, Yim JH,
Kim YC and Oh H: Anti-inflammatory effect of neoechinulin a from
the marine fungus Eurotium sp.SF-5989 through the Suppression of
NF-кB and p38 MAPK pathways in lipopolysaccharide stimulated
RAW264.7 macrophages. Molecules. 18:13245–13259. 2013. View Article : Google Scholar : PubMed/NCBI
|
|
14
|
Etoh T, Kim YP, Ohsaki A, Komiyama K and
Hayashi M: Inhibitory effect of erythraline on Toll-like receptor
signaling pathway in RAW264.7 cells. Biol Pharm Bull. 36:1363–1369.
2013. View Article : Google Scholar : PubMed/NCBI
|
|
15
|
Gao Y, Liu F, Fang L, Cai R, Zong C and Qi
Y: Genkwanin inhibits proinflammatory mediators mainly through the
regulation of miR-101/MKP-1/MAPK pathway in LPS-activated
macrophages. PLoS One. 9:e967412014. View Article : Google Scholar : PubMed/NCBI
|
|
16
|
Zhao Q, Qian Y, Li R, Tan B, Han H, Liu M,
Qian M and Du B: Norcantharidin facilitates LPS-mediated immune
responses by up-regulation of AKT/NF-kB signaling in macrophages.
PLoS One. 7:e449562012. View Article : Google Scholar : PubMed/NCBI
|
|
17
|
Chen JL, Zhong WJ, Tang GH, Li J, Zhao ZM,
Yang DP and Jiang L: Norditerpenoids from Flickingeria fimbriata
and their inhibitory activities on nitric oxide and tumor necrosis
factor-α production in mouse macrophages. Molecules. 19:5863–5875.
2014. View Article : Google Scholar : PubMed/NCBI
|
|
18
|
O'Mahony C, Scully P, O'Mahony D, Murphy
S, O'Brien F, Lyons A, Sherlock G, MacSharry J, Kiely B, Shanahan F
and O'Mahony L: Commensal-induced regulatory T cells mediate
protection against pathogen-stimulated NF-kappaB activation. PLoS
Pathog. 4:e10001122008. View Article : Google Scholar : PubMed/NCBI
|
|
19
|
Nishitani Y, Zhang L, Yoshida M, Azuma T,
Kanazawa K, Hashimoto T and Mizuno M: Intestinal anti-inflammatory
activity of lentinan: Influence on IL-8 and TNFR1 expression in
intestinal epithelial cells. PLoS One. 8:e624412013. View Article : Google Scholar : PubMed/NCBI
|
|
20
|
Poormasjedi-Meibod MS, Jalili RB,
Hosseini-Tabatabaei A, Hartwell R and Ghahary A: Immuno-regulatory
function of indoleamine 2,3 dioxygenase through modulation of
innate immune responses. PLoS One. 8:e710442013. View Article : Google Scholar : PubMed/NCBI
|
|
21
|
Ohnishi T, Bandow K, Kakimoto K, Kusuyama
J and Matsuguchi T: Long-Time treatment by low-dose
N-Acetyl-L-Cysteine enhances proinflammatory cytokine expressions
in LPS-stimulated macrophages. PLoS One. 9:e872292014. View Article : Google Scholar : PubMed/NCBI
|
|
22
|
Livak KJ and Schmittgen TD: Analysis of
relative gene expression data using real-time quantitative PCR and
the 2(-Delta Delta C(T)) method. Methods. 25:402–408. 2001.
View Article : Google Scholar : PubMed/NCBI
|
|
23
|
Liang Z, Zeng Y, Huang X and Yang Z: The
effect of Apigenin on proliferation and No secretion and
phagocytosis of RAW264.7 cells. J Jinan Univ (Natural Sci).
29:95–98. 2008.(In Chinese).
|
|
24
|
Xie Y, Chen Q, Luo D and Zhong Z:
Anti-fatigue and immunoregulatory functions of high-purity
rubusoside. Lishizhen Med Materia Med Res. 21:1421–1422. 2010.(In
Chinese).
|
|
25
|
Huang F, Guo Y, Zhang R, Yi Y, Deng Y, Su
D and Zhang M: Effects of drying methods on physicochemical and
immunomodulatory properties of polysaccharide-protein complexes
from litchi pulp. Molecules. 19:12760–12776. 2014. View Article : Google Scholar : PubMed/NCBI
|
|
26
|
Luo J, Zhu R, Yi L Dong Y and Wang PX:
Effect of sinomenine on mouse RAW264.7 macrophage cells line
polarization induced by LPS or IL-4. Chin J Immunol. 31:56–60.
2015.
|
|
27
|
Byeon SE, Lee J, Kim JH, Yang WS, Kwak YS,
Kim SY, Choung ES, Rhee MH and Cho JY: Molecular mechanism of
macrophage activation by red ginseng acidic polysaccharide from
Korean red ginseng. Mediators Inflamm. 2012:1–7. 2012. View Article : Google Scholar
|