Introduction
Hepatocellular carcinoma (HCC) is the sixth most
common type of cancer with an increasing incidence worldwide
(1). Despite recent advances in
treatment and the understanding of its pathophysiology, HCC remains
a disease with a poor prognosis (1–2). HCC
typically develops following chronic inflammatory liver disease
caused by viral infection, which induces cirrhosis and exposure to
chemical carcinogens (1) Treatment
of advanced HCC disease is largely ineffective, primarily due to
therapy-resistance mechanisms (2).
At present surgical resection and liver transplantation are the
best treatment options (2). However,
a high rate of recurrence and metastasis post curative resection is
common and is one of the major causes of mortality in patients with
HCC (1–2). Liver oval cells (OCs) possess high
proliferative activity, which when disrupted may contribute to HCC
(3). The number of OCs may be used
to evaluate the degree of necroptosis during chemical
carcinogenesis as they are rarely isolated form a healthy liver
(3–5).
Following OC transformation into cancerous cells,
changes in apoptosis and necroptosis serve a key role in hastening
the neoplastic state (6–8). To the best of our knowledge, previous
studies of experimental hepatocarcinogenesis have only investigated
the effect of a failure in one of these programmed cell death
pathways (6,9). A number of previous studies have
highlighted the molecular basis of apoptosis resistance in
hepatocarcinogenesis, associated with changes to cell death
receptors (6,9,10). A
novel concept of programmed cell death known as necroptosis has
been identified as an alternative form of removing transformed
cells when p53-driven apoptosis is disturbed (7–11). In
addition, activating necroptosis may serve as a novel therapeutic
strategy against neoplastic states for which conventional therapy
remains ineffective (11).
The primary difference between apoptosis and
necroptosis are the molecules which make up the signalling
cascades; caspase for apoptosis and RIP1/RIP3 for necroptosis
(12,13). During necroptosis RIP1 and RIP3 form
a complex, which triggers the highly regulated process of cell
death. The RIP1/RIP3 cytoplasmic necroptotic protein complex is
called a necrosome and constitutes a key molecular platform of
necroptosis (7,10,14,15). A
number of factors may trigger nepoptosis, including tumour necrosis
factor (TNF), Fas ligand and TNF-related apoptosis inducing ligand
(8). The overproduction of reactive
oxygen species (ROS) damages different macromolecules, including
lipids, proteins and DNA and thereby may also contribute to the
execution of necroptosis (8).
The present study aimed to determine the association
between the two different programmed cell death signalling pathways
within a rat model of hepatocarcinogenesis, induced by partial
hepatectomy (PH) and diethilnitrosamine (DEN) treatment. The
present study investigated the hypothesis that necroptosis may have
the potential to destroy neoplastic oval cells following the
suppression of apoptosis.
Materials and methods
Experimental design
A total of 20 female Wistar rats (weight, 200–220 g)
were used in the present study. The rats were obtained from the
Centre of Experimental Medicine, The Medical University of
Bialystok (Bialystok, Poland). The rats were housed in pairs in
standard polysulfone cages (59×38×20 cm) containing wood-chip
bedding material in a temperature (22±1°C) and humidity-controlled
(50±10%) room with a 12-h light/dark cycle. The animals had ad
libitum access to standard rat pellet food and tap water. All
procedures were approved by the Ethics Committee for Animal
Experimentation at the University of Life Sciences (Lublin, Poland;
approval number 81/2015).
Following a 1-week period of acclimatisation the
10-week-old rats were divided into two groups for OC induction: i)
Non-neoplastic PH, PH was performed and PBS was administered in the
drinking water (n=10); and ii) neoplastic PH/DEN, a two-step rat
model of hepatocarcinogenesis was performed following the
Solt-Farber protocol (n=10) (16). A
PH (two-thirds) was performed to the rats in each group according
to the Higgins and Anderson method via excision of left lateral
(~38%) and right (~30% lobes as previously described (17). All surgical procedures were performed
under ketamine and xylazine anaesthesia (90 mg/kg and 10 mg/kg,
respectively) between 9.00 a.m. and 12.00 p.m. to minimise the
diurnal effect of liver regeneration. At 7 days following PH, DEN
(50 mg/l; Sigma Aldrich; Merck KGaA, Darmstadt, Germany) was added
to the drinking water of the neoplastic group of rats and supplied
ad libitum for a period of 10 weeks. The non-neoplastic
group were administered PBS. Following this 10-week period, an
exploratory laparotomy was performed in the PH/DEN rats and the
development of tumours on the liver surface was confirmed.
In vivo and in vitro experimental
design
After 10 weeks OCs were isolated from each group as
described previously (4). OC cells
were isolated during the exploratory laparotomy in the PH/DEN group
and during a regular laparotomy in the PH group. Prior to the
laparotomy, rats were anesthetised with intramuscular
administration of ketamine (90 mg/kg) and xylazine (10 mg/kg). The
liver was perfused in situ through the portal vein with a
Krebs-Ringer buffer (Sigma Aldrich; Merck KGaA) made up of three
parts as follows: i) Containing EGTA, ii) without Ca2+
and chelating agent and iii) with type IV collagenase. Following
perfusion, the liver was transferred to Ham's F-12/Dulbecco's
modified Eagle's medium (DMEM; 1:1 v/v; Sigma Aldrich; Merck KGaA),
minced, filtered through a double gauze and digested for 1 h at
37°C in PBS containing 0.1% collagenase, 0.25% trypsin, 0.004%
DNase I and 0.1% pronase E (all Sigma Aldrich; Merck KGaA), which
selectively digested mature hepatocytes into undetectable debris.
The mixture was subsequently decanted through a 70 µm-nylon mesh
followed by a 40 µm-nylon mesh and then loaded on a discontinuous
gradient of Percoll and centrifuged at 420 × g for 20 min at 4°C.
Density gradient centrifugation is an effective method of
separating OCs from the remaining liver cell fractions (12). In comparison with the other methods,
including flow cytometry and immunomagnetic sorting, density
gradient centrifugation in Percoll, followed by specific enzymatic
digestion leads to the isolation of pure OCs with a high viability
(18–19).
The collected cell suspension was washed with
antibiotic supplemented (100 U/ml penicillin, 0.1 mg/ml
streptomycin, 10 mg/ml gentamycin) Ham's F-12/DMEM medium
containing 10% fetal calf serum (Sigma Aldrich; Merck KGaA) and
plated at 250,000 cells/well in 1,000 µl Ham's F-12/DMEM (1:1 v/v)
medium in a 24-well plate at 37°C with 5% CO2. The
viability of the cells was estimated using the Trypan-blue
exclusion method and was between 75–85%. A total of 180 µl Trypan
blue (Sigma Aldrich; Merck KGaA) was mixed with 20 µl cell
suspension and 50 µl of the mixture was dropped on a Bürker
counting chamber. The number of viable cells (with a clear
cytoplasm) and dead cells (with a blue cytoplasm) was determined in
24 squares (0.25 mm2) of the Bürker chamber as
previously described (20). Adhered
OCs from the PH and PH/DEN groups were cultured in HAMS-12/DMEM
(v/v) medium at 37°C with 5% CO2. The medium and cells
were analysed at 24, 48 and 72 h, and the first and second week of
incubation.
Biochemical analysis
Serum levels of alanine aminotransferase (ALT; cat.
no. A11A01627), aspartate aminotransferase (AST; cat. no.
A11A01629), γ-glutamyl transferase (GGT; cat. no. A11A01630) and
alkaline phosphatase (AP; cat. no. A11A01626) were quantified using
a kinetic methods with an ABX Pentra 400 (HORIBA Ltd., Kyoto,
Japan) using commercially available tests from HORIBA Ltd. All
procedures were performed according manufacture's protocol.
Histopathological examination of the
liver tissue
Liver tissues were fixed for 24 h at room
temperature in 10% phosphate-buffered formalin, embedded in
paraffin and sectioned at 3–5 µm using a rotary microtome (Leica
SR-200; Leica Microsystems, Ltd., Milton Keynes, UK) prior to
histological examination. The sections were stained at room
temperature with haematoxylin (5 min) and eosin (5 min) for
histological observation. The histological analyses were performed
via light microscopy (Eclipse E-600; Nikon Corporation, Tokyo,
Japan) at magnification, ×200. The hepatic injures were assessed
according to the World Health Organisation Histological
Classification of Tumours (21).
Morphological characterisation of
isolated OCs
The OCs were cultured at 36°C for 2 weeks in Ham's
F-12/DMEM mixture (1:1 v/v). On each day of culture the OCs were
subjected to microscopic analysis of the morphology under a
phase-contrast microscope (Olympus CK40; Olympus Corporation,
Tokyo, Japan). The appearance of the cells, colony formation,
spread of cell culture and the construction or lack of a monolayer
was analysed.
Western blot analysis
At various time points (24, 48, 72 h and 1st and 2nd
week) the OCs were harvested in a lysis buffer composed of 0.2%
Nonidet-P40, 150 mmol/l NaCl, 20 mmol/l Tris, 2 mmol EDTA, 0.1%
glycerol, 10 mmol/l dithiothreitol and a cOmplete™
protease inhibitor cocktail (Roche; Sigma-Aldrich; Merck KGaA).
Concentration of obtained protein was analysed by Lowry method
(22). Equal amounts (30 µg/lane) of
protein were separated by 12% SDS-PAGE, transferred to
polyvinylidene difluoride membranes (Bio-Rad Laboratories, Inc.,
Hercules, CA, USA) and blocked for 1 h at 20°C with PBS containing
5% low-fat milk. Following washing with Tris-buffered saline and
0.1% Tween-20 (Sigma Aldrich; Merck KGaA), the membranes were
incubated overnight at 4°C with primary antibodies directed against
cytokeratine-19 (CK19; 1:200; cat. no. M0888), albumin (Alb;
1:1,000; cat. no. F0117; both Dako; Agilent Technologies, Inc.,
Santa Clara, CA, USA), α-fetoprotein (Afp; cat. no. ab46799), RIPK1
(cat. no. ab106393) and RIPK3 (cat. no. ab56164) (all 1:200; Abcam,
Cambridge, UK). The washed membranes were subsequently incubated
for 3 h at 4°C with alkaline phosphatase-labelled goat anti-mouse
(cat. no. P0447) or anti-rabbit (cat. no. P0448) (both 1:15,000;
Dako; Agilent Technologies, Inc.) secondary antibodies. The protein
bands were visualised using colorimetric detection (GelDog XR
system; Bio-Rad Laboratories, Inc.) and analysed using Quantity One
1-D analysis software version 4.6.3 (Bio-Rad Laboratories, Inc.)
(4).
Apoptosis detection using flow
cytometry (FCM)
Apoptosis detection was performed using an Annexin
V/FITC assay kit (Bio-Rad Laboratories, Inc.) according to the
manufacture's protocol. The OCs were washed in PBS and centrifuged
at 420 × g for 10 min at 4°C and the supernatant was discarded. The
cell pellet was suspended in the binding buffer and adjusted to a
concentration of 5×10⁵ cells/ml. A total of 5 µl Annexin
V-fluorescein isothiocyanate (FITC) solution was added and the
cells were incubated for 15 min at room temperature in the dark. A
total of 10 µl propidium iodide (PI) was subsequently added and the
probes were incubated for 15 min in the dark at room temperature.
The suspension was subsequently centrifuged at 300 × g for 5 min at
room temperature, re-suspended in 200 µl binding buffer and
analysed using System XL-II software with a Coulter Epics XL flow
cytometer (Beckman Coulter, Inc., Brea, CA, USA) (23).
Cell proliferation assay
To detect the proliferation rate of PH and PH/DEN
OCs, an ELISA-Bromodeoxyuridine (BrdU) kit (Abcam; cat. no.
ab126556) was used according to the manufacturer's protocol. This
test measures the BrdU incorporated into newly synthesised cellular
DNA. The cells were seeded in a 96-well plate at a density of
2×10⁵ cells/well in 100 µl Ham's F-12/DMEM (1:1 v/v)
culture medium. A total of 20 µl diluted 1:500 BrdU was added to
the OCs in the plates and incubated at 37°C for 4 h (BrdU
incorporation). Following removal of the culture medium the cells
were fixed for 30 min at room temperature with FixDenat (provided
with the test kit) followed by incubation with peroxide-conjugated
monoclonal antibodies to the thymidine-analogue
5-bromo-2deoxyuridine Fab fragments, which bind with the
incorporated DNA. Following the addition of substrate solution, the
immune complexes were detected at 450 nm using an
ELx800™ ELISA reader (BioTek Instruments, Inc.,
Winooski, VT, USA).
Superoxide anion assay
Superoxide anion production was measured as
previously described (23). OCs were
incubated with 0.1% nitroblue tetrazolium (Sigma-Aldrich; Merck
KGaA) solution at room temperature for 10 min and the absorbance
was read at 545 nm. Nanomoles of superoxide produced over the
incubation period were calculated using the extinction coefficient
of 21.1 nmol (24).
Statistical analysis
All experiments were repeated a minimum of three
times with different batches of cell samples. Data are presented as
the mean ± standard deviation. Data were analysed using one-way
analysis of variance (ANOVA) or Student's t-test as appropriate.
When ANOVA indicated significant differences within groups,
comparisons were made using Tukey's post hoc test. P<0.05 was
considered to indicate a statistically significant difference.
Statistical analyses were performed using STATISTICA version 13.1
software (StatSoft Ltd., Bedford, UK).
Results
Body weight and blood biochemical
analyses
Rats in the PH/DEN group had a slower growth rate
compared with the PH group. At the time of sacrifice the average
body weight was significantly (~20%) lower in the PH/DEN group
compared with the PH group (Table
I). Blood analyses indicated that AST, ALT, AP and GGT levels
were significantly higher in the PH/DEN group compared with the PH
group (Table I).
 | Table I.Body weight and serum levels of AST,
ALT, AP and GGT in a PH/DEN rat model of hepatocarcinogensis. |
Table I.
Body weight and serum levels of AST,
ALT, AP and GGT in a PH/DEN rat model of hepatocarcinogensis.
| Characteristic | PH rats | PH/DEN rats |
|---|
| Initial weight
(g) | 215.00±5.37 | 209.00±7.20 |
| Final weight
(g) | 300.00±6.63 |
266.00±10.80a |
| AST (U/l) | 107.00±6.68 |
204.25±23.04a |
| ALT (U/l) | 49.25±3.09 |
71.65±2.75a |
| AP (U/l) | 73.25±4.34 |
137.75±9.10a |
| GGT (U/l) |
5.47±0.25 |
59.25±9.57a |
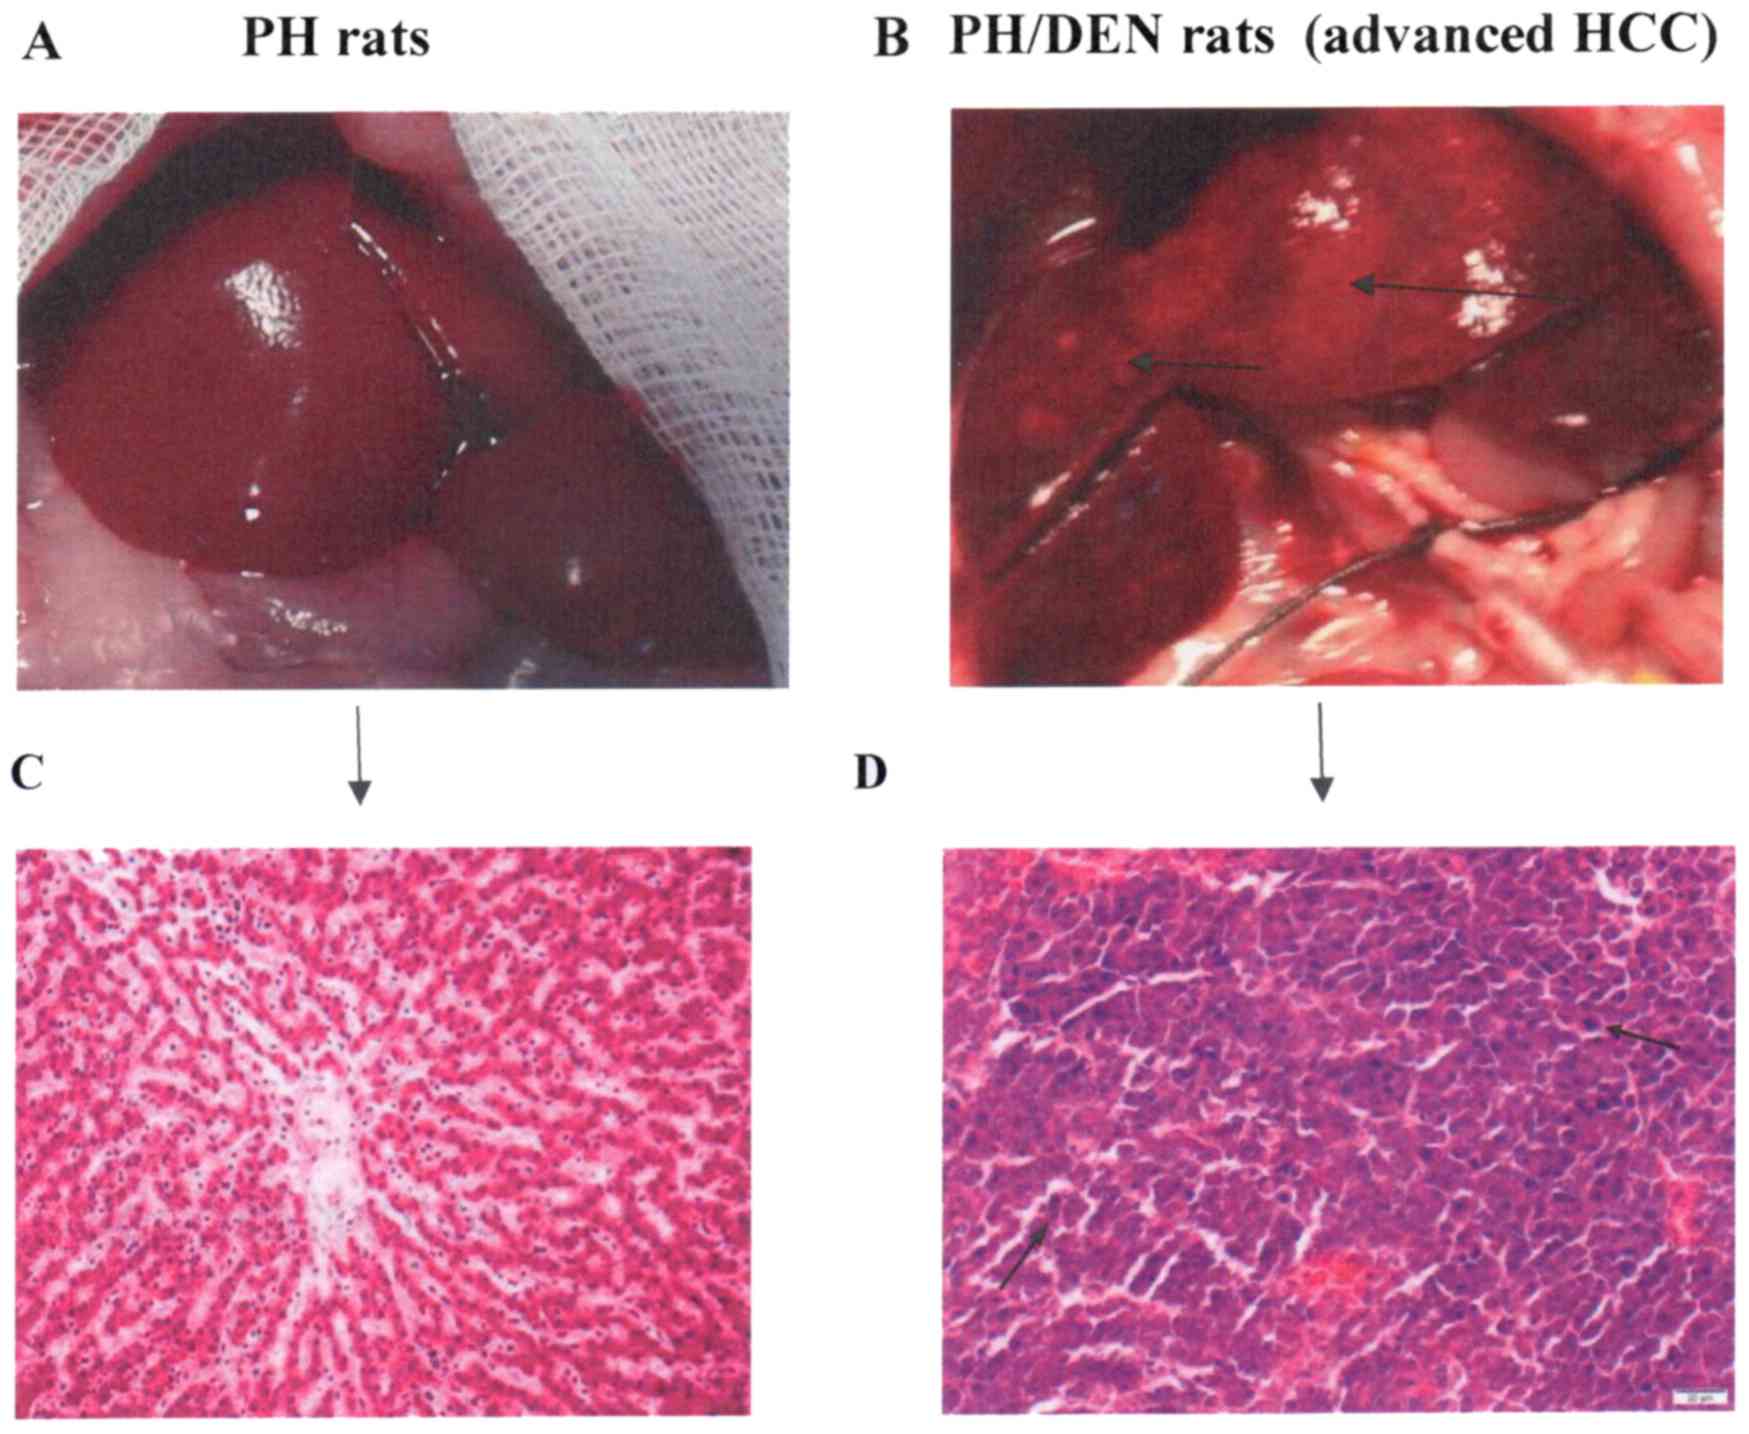
Histological examination
The livers of the PH (Fig. 1A) and PH/DEN (Fig. 1B) rats were examined. Normal liver
histology was observed in the PH group (Fig. 1C). The liver histology of animals in
the PH/DEN group was characterised by chronic damage and areas of
cellular atypia (black arrow; Fig.
1D). The signs included lymphocytic infiltration, cells with
enlarged nuclei and atypical hepatocytes.
Phenotype of primary PH and PH/DEN
OCs
Western blot analysis was performed to detect the
stem cell markers Afp, CK19 and Alb to determine whether rat OCs
were activated in each group (Fig.
2A). Each group was positive for Afp and CK19, the classical OC
markers immediately following isolation. The isolated OCs also
co-expressed Alb at a high level. One way of defining a cell
population as a progenitor OC is to clarify its ability to multiply
and differentiate into hepatocytes and cholangiocytes. The freshly
isolated cells expressed hepatocytic (Alb) and cholangiocytic
markers (CK19), indicating that they were bipotential hepatic stem
cells. Afp and CK19 were not detected in PH OCs following 2 weeks
of incubation (whereas Alb was detected at all time points of the
experiment), which indicates that PH OCs successively gave rise to
novel hepatocytes. By contrast, the expression of Alb by PH/DEN OCs
gradually disappeared throughout incubation.
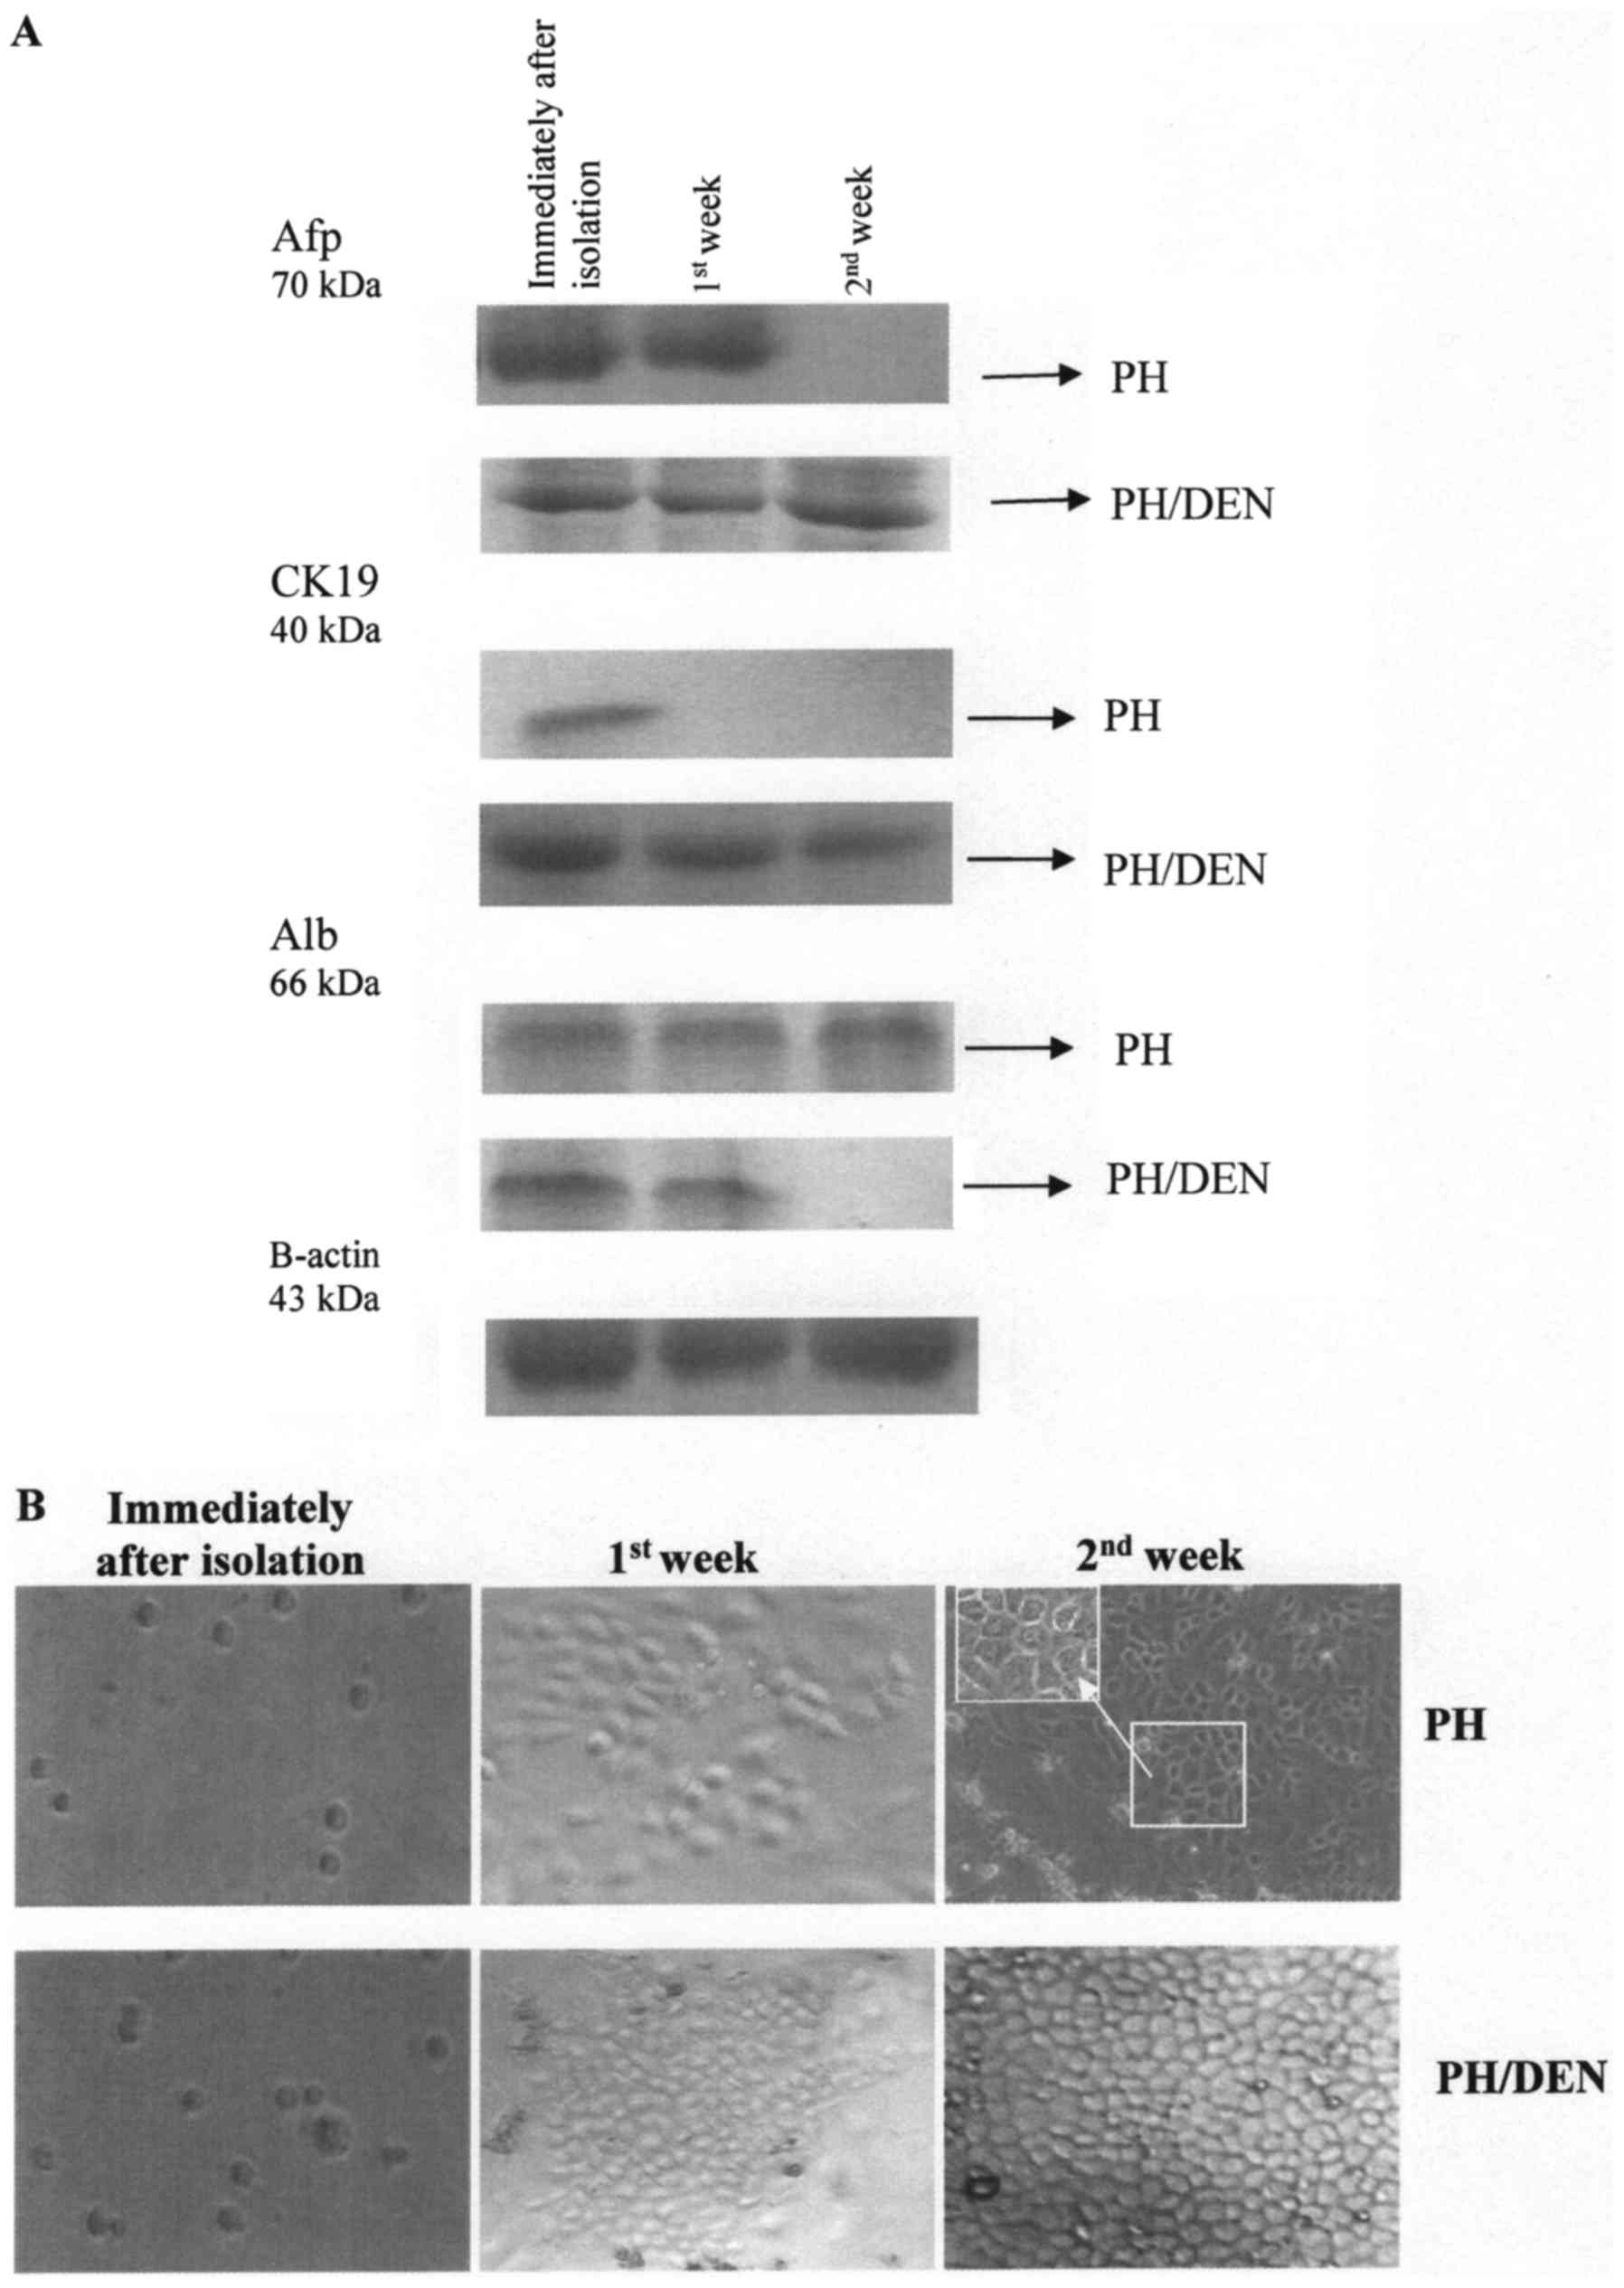 | Figure 2.Protein expression of Afp, CK19 and
Alb in PH and PH/DEN OCs. (A) Western blot analysis was performed
to determine the protein expression of Afp, CK19 and Alb in PH and
PH/DEN OCs. (B) Morphological phase-contrast characteristics of the
isolated and cultured OCs. Immediately following isolation the OCs
were small, with an oval-shaped nucleus and scant cytoplasm. Within
the first week of incubation PH/DEN cells formed colonies and
underwent clonal expansion with a high proliferative potential.
Neither of the groups' cells exhibited a hepatic myofibroblast-like
appearance. In the PH group following 2 weeks in culture, cells
with abundant cytoplasm and round nuclei typical of mature
hepatocytes were present. The polygonal shape of the PH OCs was
visible in the high magnification of the bracketed area (×400).
Magnification, ×200. PH, partial hepatectomy; DEN,
diethylnitrosamine; OC, oval cell; Alb, albumin; CK19,
cytokeratine-19; Afp, α-fetoprotein. |
Freshly isolated OCs were round in shape and had a
high nuclear to cytoplasmic ratio. PH OCs attached to the culture
dish within 24 h and grew to confluence within 72 h as
spindle-shaped cells (Fig. 2B). From
the first week of incubation, the PH cells composed a flat
monolayer and began to differentiate into cells of mature
morphology, which was clearly visible in the second week of
incubation (Fig. 2B). This
maturation of cells was additionally confirmed by a strong Alb
expression (Fig. 2A).
The PH/DEN group OCs expanded in the culture without
creating a regular monolayer. It was observed that some of the
cells were round mononuclear cells with an oval-like appearance,
however some were longitudinal. Following 1 week of culture, the
PH/DEN OCs aggregated and formed colonies. At 2 weeks incubation
there was intensive multiplying of the OCs.
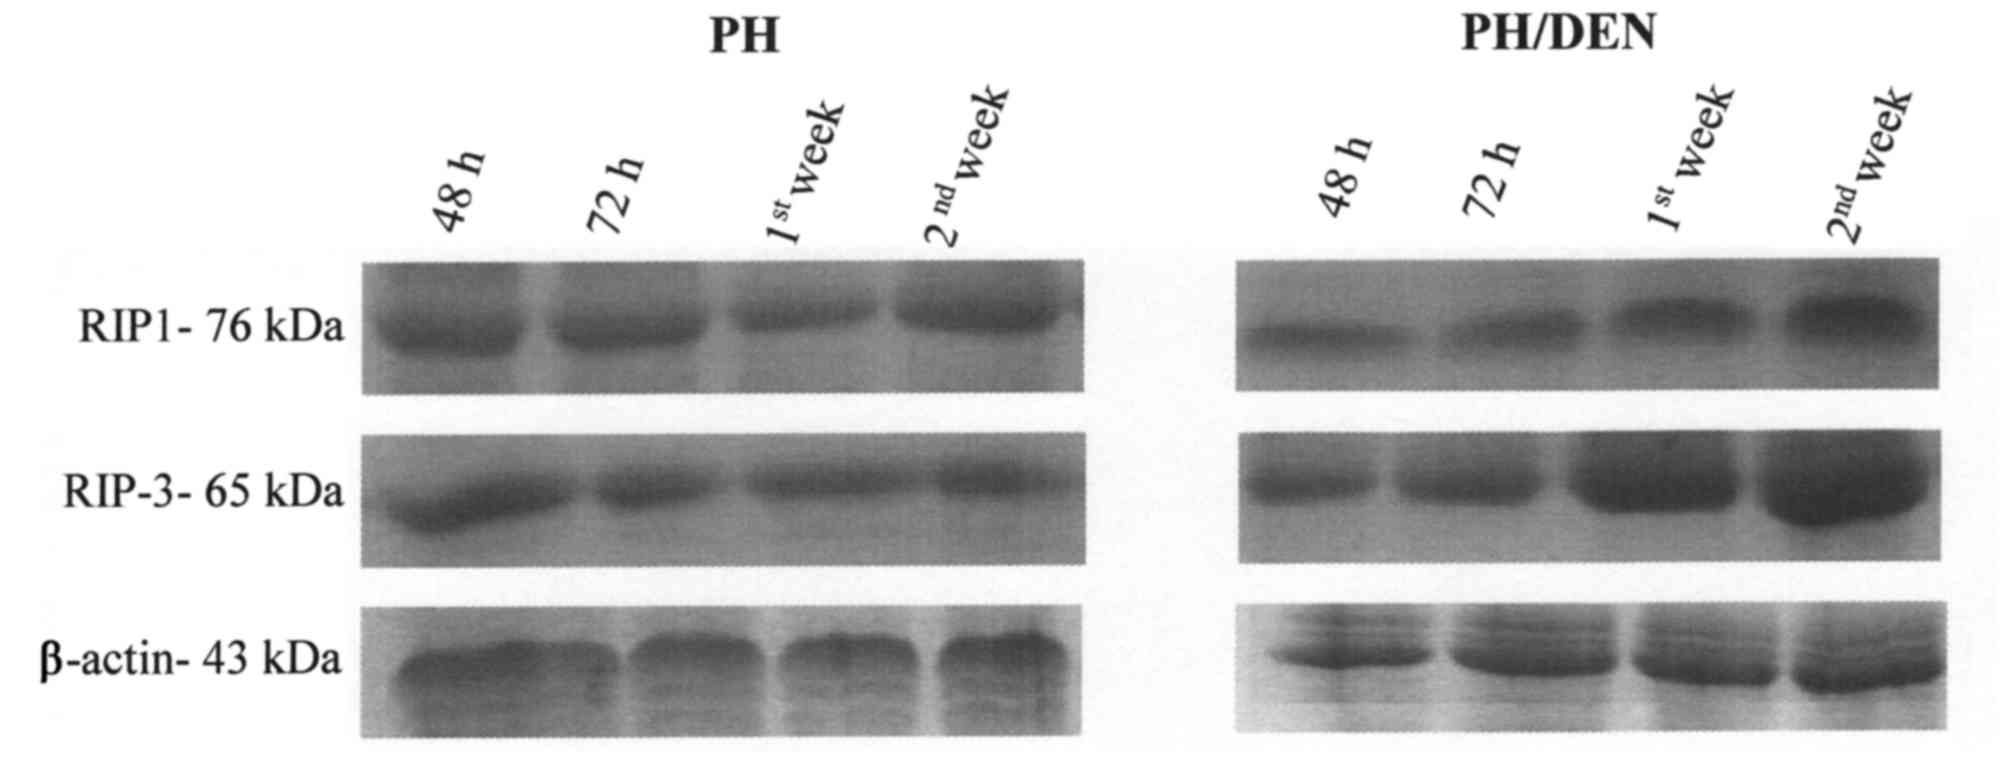
RIP1 and RIP3 protein expression
alters under non-neoplastic and neoplastic conditions
OCs isolated from PH and PH/DEN livers expressed
RIP1 and RIP3 protein throughout culture (Fig. 3). The expression of RIP1 and RIP3
proteins by OCs remained constant in the PH group, however, a
notable increase in RIP1 and RIP3 protein expression was observed
in the PH/DEN group following 72 h incubation (Table II). In addition, the bands density
of RIP1 and RIP3 obtained in the 1st and 2nd week of PH/DEN OCs
incubation, were significantly higher (P<0.05) compared with the
PH group at the same time points (Table
II). At the 2nd week the PH/DEN OCs exhibited the strongest
staining of RIP1 and RIP3 at 3.488,89 and 3.547,67
INT/mm2, respectively (Table
II). It appears that, conversely to non-neoplastic OCs, the
time of incubation intensifies RIP1- and RIP3-dependent necroptotic
death in neoplastic cells.
| Table II.Protein expression of RIP1 and
RIP3. |
Table II.
Protein expression of RIP1 and
RIP3.
|
|
| PH | PH/DEN |
|---|
|
|
|
|
|
|---|
| Protein | Time point | % Adj.Vol. | Density
(INT/mm2) | % Adj.Vol. | Density
(INT/mm2) |
|---|
| RIP1 | 48 h | 12.47 | 2,924.40 | 6.84 |
2,437.00a |
|
| 72 h | 10.92 | 2,879.56 | 10.89 | 2,868.11 |
|
| 1st week | 10.98 | 2,884.67 | 16.20 |
3,246.00a |
|
| 2nd week | 12.49 | 2,938.56 | 17.89 |
3,488.89a |
| RIP3 | 48 h | 14.57 | 3,163.56 | 12.43 | 2,914.89 |
|
| 72 h | 13.34 | 3,015.11 | 13.40 | 3,069.78 |
|
| 1st week | 9.95 | 2,833.11 | 16.28 |
3,360.89a |
|
| 2nd week | 9.20 | 2,812.56 | 18.20 |
3,547.67a |
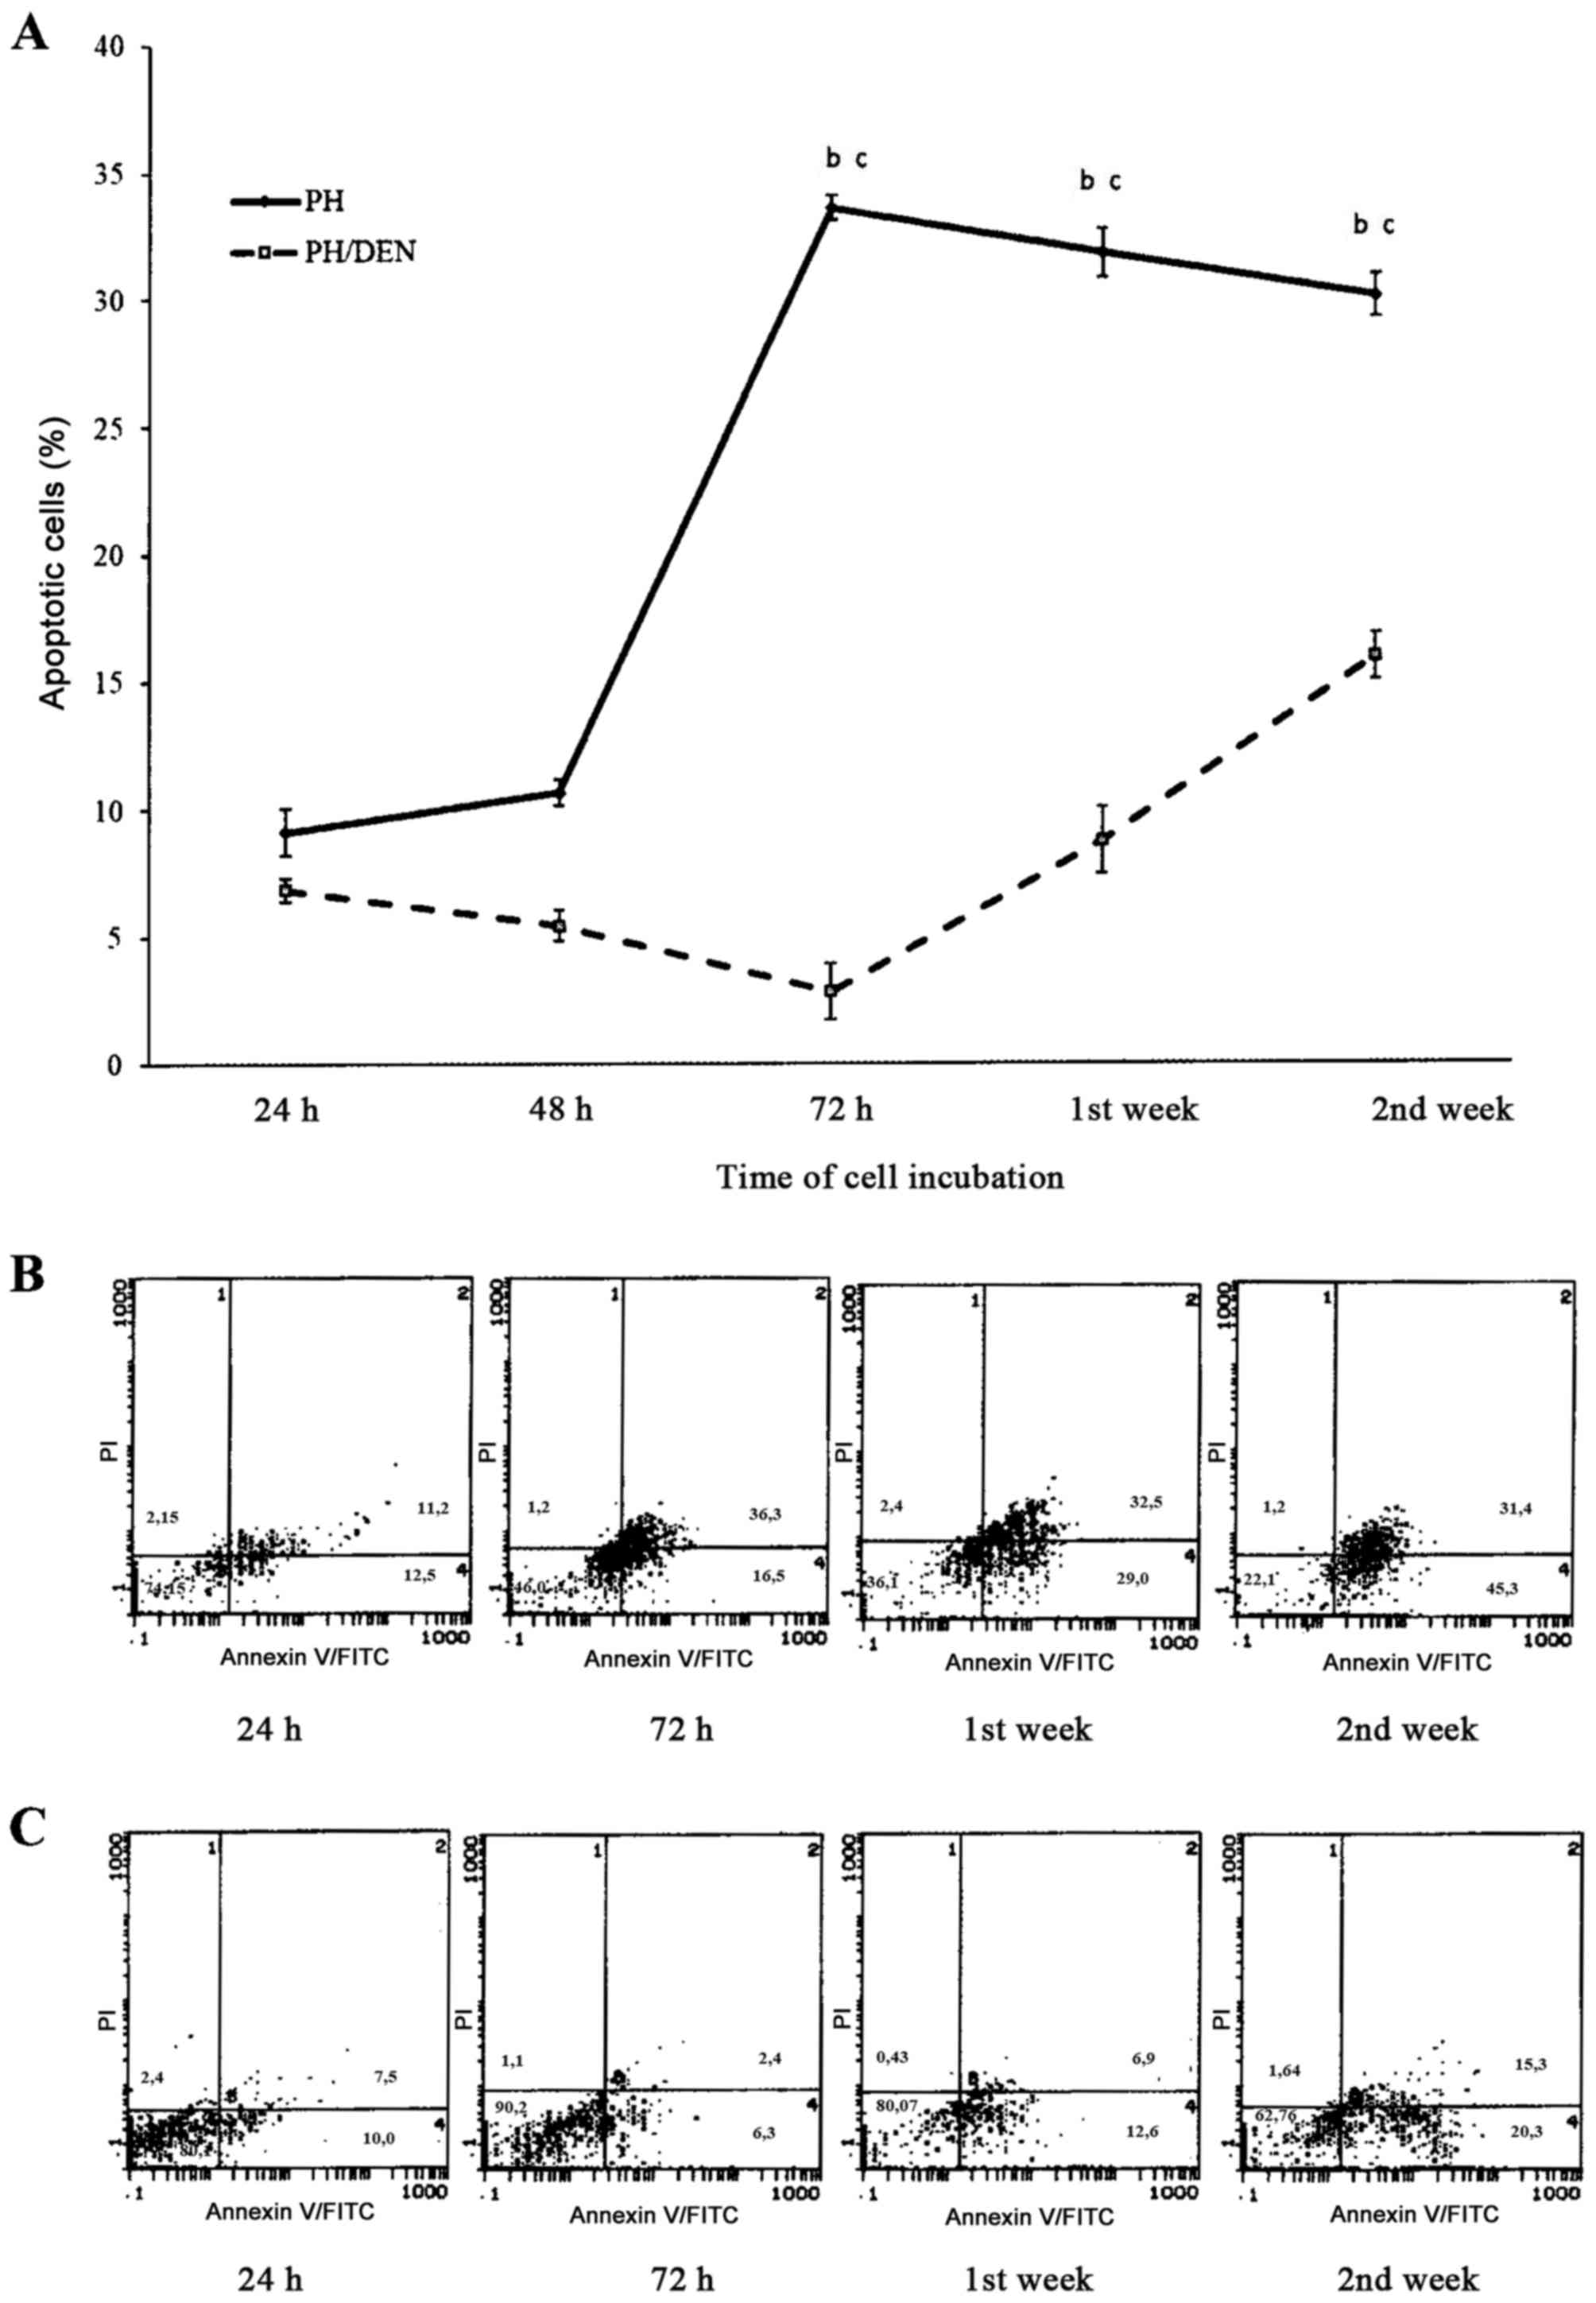
FITC-Annexin V/PI bivariate FCM
During the initial 48 h of OC incubation in the PH
group, the mean number of apoptotic cells was 10.56±0.5% (Fig. 4). At 72 h the percentage of apoptotic
cells significantly increased to 33.58±0.5%, which was markedly
decreased at 2 weeks (30.08±0.83%). Compared with the PH OCs, the
cells isolated from the PH/DEC group exhibited significantly less
apoptosis between 72 h and 2 weeks. There were particularly few
apoptotic cells (2.82±1.1%) in the PH/DEN group at 72 h. The level
of apoptosis in the PH/DEN group gradually increased and was
significantly increased at 2 weeks compared with 1 week, however at
no time point did it exceed 15.94±0.9% of all cultured cells.
Concurrent staining with Annexin V and PI revealed differences
between the percentage of apoptotic PH and PH/DEN OCs. Whereas in
PH-OCs apoptosis intensified concomitantly with the time of
incubation, (bottom and upper right quadrants) live neoplastic OCs
dominated independently of the time of cell culture (bottom left
quadrant).
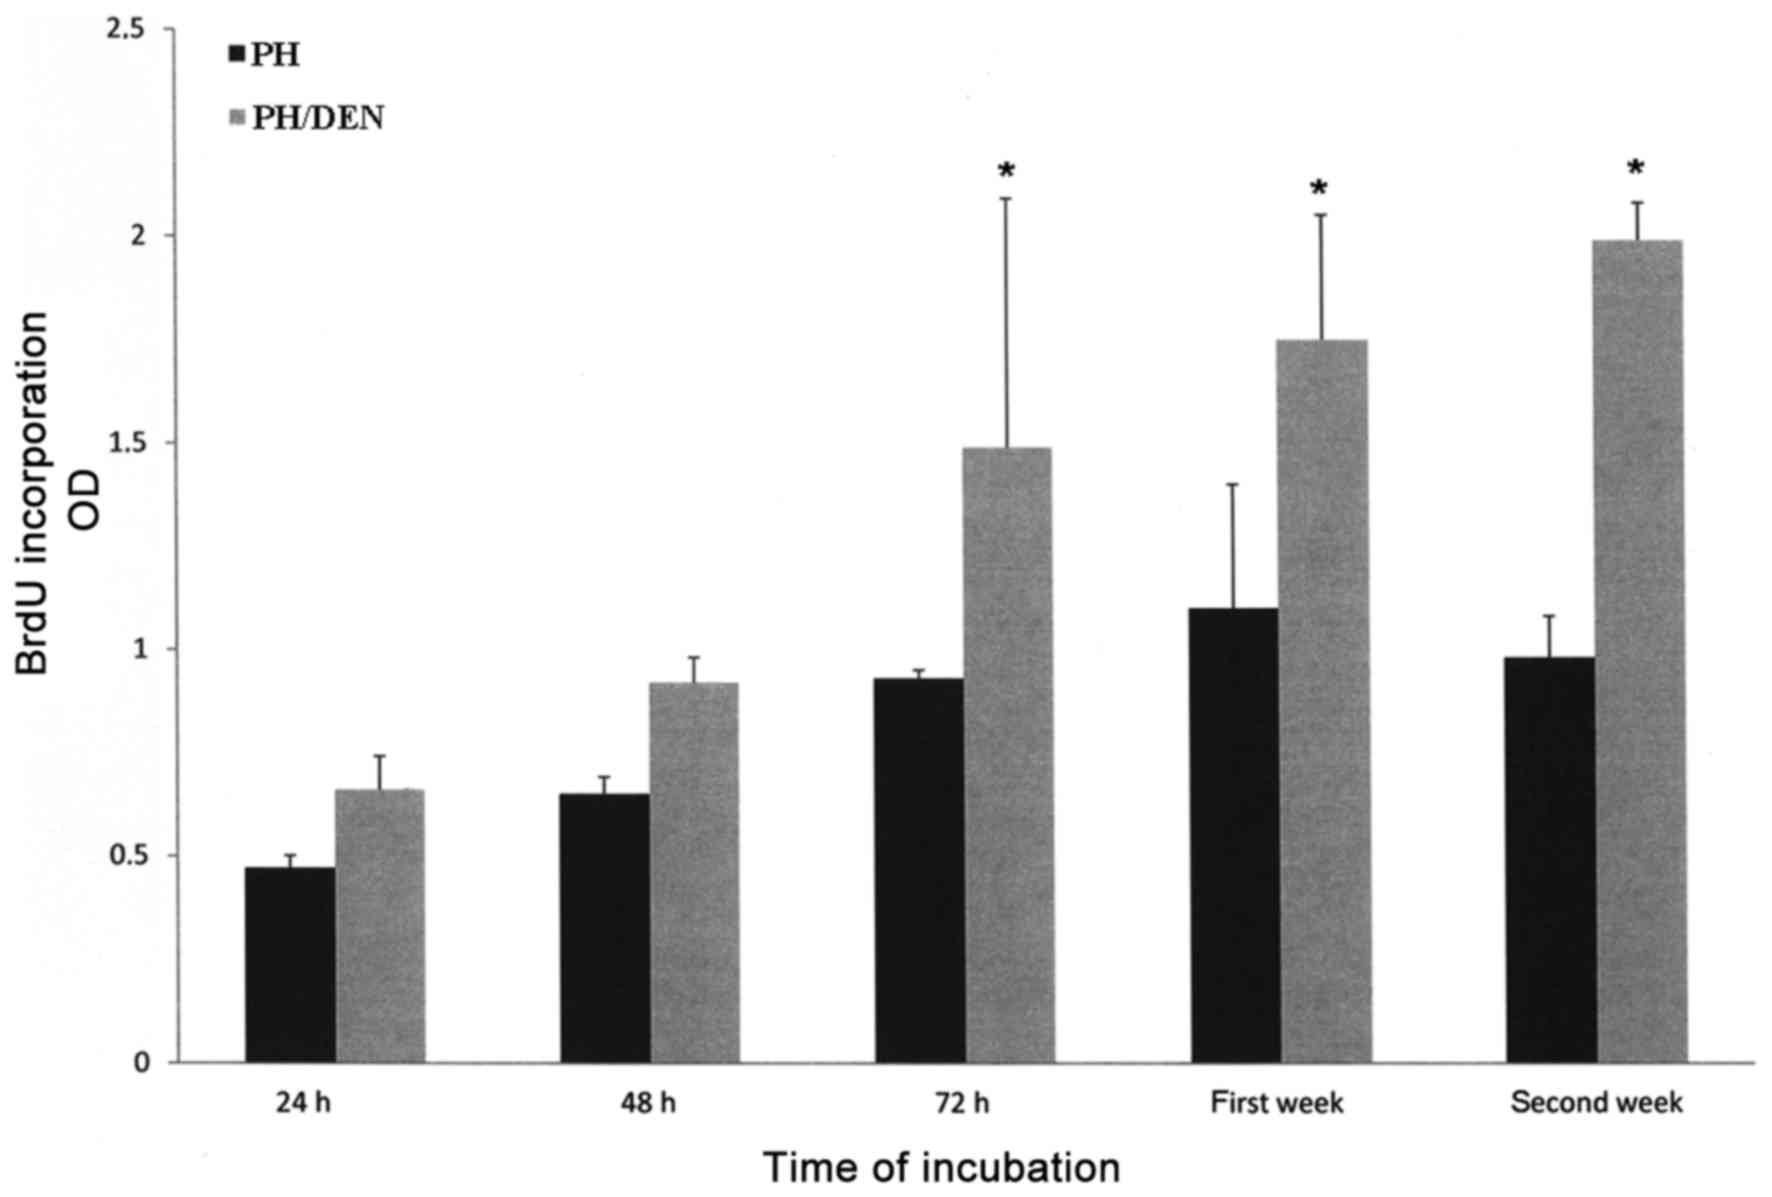
Proliferation activity of isolated PH
and PH/DEN OCs
The proliferative activity of PH OCs gradually
increased from 24 h (0.47±0.03) to the first week of incubation
(1.1±0.3), however at the second week there was a slight reduction
(0.98±0.1; Fig. 5). In contrast,
PH/DEN OCs demonstrated increased proliferative activity at each
time point, reaching the highest value at the second week
(1.99±0.09). The proliferative activity of PH/DEN OCs was
significantly increased compared with the PH OCs at the same time
point between 72 h and the second week.
ROS generation by PH and PH/DEN
OCs
ROS production by PH OCs increased gradually from
0.70±0.03 to 2.50±0.37 nM/25×104 cells from 24 h to the
first week of incubation (Table
III). PH/DEN OCs generated significantly increased amounts of
ROS at each time point compared with the PH group, The highest ROS
production occurred in the first week of cell incubation in each
group and reached 2.50±0.37 nM/2.5×104 cells in the PH
group and 3.70±0.27 nM/2.5×104 cells in the PH/DEN
group. Despite the slight decrease in ROS production (3.2±0.37
nM/2.5×104 cells) at the 2nd week in the PH/DEN group,
this value was still significantly increased compared with the PH
group.
| Table III.Superoxide generation by OCs isolated
from PH and DEN rats (nM/25×104). |
Table III.
Superoxide generation by OCs isolated
from PH and DEN rats (nM/25×104).
| Group | 24 h | 48 h | 72 h | 1st week | 2nd week |
|---|
| PH | 0.70±0.03 | 1.10±0.2 |
2.20±0.43a,b |
2.50±0.37a,b |
2.00±0.31a,b |
| PH/DEN |
1.67±0.36a | 1.89±0.5 |
3.20±0.58a,b |
3.70±0.27a,b |
3.20±0.37a,b |
Discussion
During the culture of PH OCs, RIP1 expression
fluctuated between 10.92 and 12.49%, while RIP3 expression steadily
decreased from 14.57–9.20%. At 48 h RIP1 and RIP3 expression was
notably lower in the PH/DEN group, however it steadily increased
over time and was significantly higher at 2 weeks compared with the
PH group. In addition, it was connected with a high percentage of
apoptotic cells, particularly after 48 h of PH OCs culture; it
appears that apoptosis dominates in isolated PC OCs. Conversely it
was observed that RIP1 and RIP3 expression increased concomitantly
with apoptosis suppression in OCs obtained from the PH/DEN group.
However, at all time points these cells exhibited a stronger RIP3
expression compared with RIP1. These slight but visible differences
in RIP1 and RIP3 expression in PH/DEN OCs indicated that RIP1 may
be dispensable for necroptosis induction and that RIP3 serves a
pivotal role during necroptosis induction. According to Kearney
et al (25) RIP1 knockdown
accelerated necroptosis induced by different stimuli and acts as an
inhibitor of the process rather than a stimulator. In addition,
Upton et al (26) reported
that necroptosis induced by murine cytomegaloviruses went
preferentially via the RIP3-dependent pathway as opposed to the
RIP1-dependent pathway. A number of previous studies have
demonstrated that RIP1 and RIP3 are essential mediators of
necroptosis, which interact via their RIP homotypic interaction
motif domains (13,27–30). In
this case execution of RIP1/RIP3 interaction involves an active
disintegration of mitochondrial, lysomal and plasma membranes
(13).
Previous studies have revealed that apoptotic
defects are the most frequent cause of cancer cell immortality and
drug resistance, which limits the efficacy of cancer chemotherapy
(10,14). In the present study, the percentage
of apoptotic PH/DEN OCs was lower than the percentage of apoptotic
PH OCs at every time point. There was a significant apoptosis
enhancement in the PH/DEN OCs at 2 weeks compared with 72 h and
strong RIP1 expression was observed. These results suggest that as
well as its association with necroptosis, RIP1 may be associated
with the regulation of apoptosis (12,29). In
response to death receptor activation, a mitochondrial apoptogenic
factor, such as Smac protein, induces the auto-degradation of
cellular inhibitor of apoptosis protein (cIAP) 1 and cIAP2, which
accelerates the formation of the RIP1-containing caspase-8
activating complex (12,28). Prolonged incubation of PH/DEN OCs
intensifies caspase-dependent cell death but not at the same level
as that obtained in PH OCs. Schattenberg et al (9) previously reported that the failure of
transformed neoplastic cells to undergo apoptosis severely disrupts
tissue homeostasis and allows proliferation of the resistant clone,
which is a phenomenon frequently observed in HCC. Similarly, the
PH/DEN OCs cultured in the present study exhibited significantly
increased proliferation activity compared with the PH OCs,
particularly in the final week of incubation. Declercq et al
(28) previously reported that when
apoptotic cell death is reduced or blocked by caspase inhibitors,
cells may use necroptosis as an alternative cell death pathway. The
results of the present study support this suggestion. A number of
previous studies have demonstrated that limited cancer necroptosis
may contribute to tumour formation and resistance to cancer
therapies (7,14,15,30). In
addition, it has been previously reported that the inhibition of
caspase activity, one of the hallmarks of apoptosis, enhances
necroptosis (7,14). The results of the present study
revealed that a low level of apoptosis PH/DEN OCs was associated
with higher RIP3 expression. The authors suggest that although this
response enhances necroptotic cell death, it is not enough to break
the highly proliferative activity of neoplastic OCs. The results
indicated an increased level of superoxide released by PH/DEN OCs,
which may participate in the regulation of necroptotic response.
The ROS may act as a stimuli of necroptosis (27). Christofferson and Yuan (27) demonstrated that ROS acts as an
effector of necroptosis in a cell-type-dependent manner, which was
reflected by the intensified proliferation of PH/DEN OCs under
experimental conditions in the present study.
The results of the present study indicated that
although PH/DEN OCs demonstrated high proliferative activity with
apoptosis suppression, their necroptosis potential was preserved.
This was reflected by the pronounced expression of RIP3 and
unchanged expression of RIP1. Optimal necroptosis may serve as an
effective treatment for hepatocarcinogenesis and these findings
clarify the importance of this alternative pathway of programmed
cell death.
Acknowledgements
Not applicable.
Funding
The present study was supported by a grant from the
National Science Centre in Poland (grant no.
DEC-2014/15/B/Nz5/01587).
Availability of data and materials
All data generated or analysed during this study are
included in this published article.
Authors' contributions
MW isolated and cultured the OCs, performed western
blot analysis, analysed cell proliferation and ROS generation and
prepared the manuscript. RB performed statistical analysis and
revised the manuscript prior to submission. UL determined apoptosis
in OCs by flow cytometry. AŚ performed histopathological
examination of the liver slides.
Ethics approval and consent to
participate
The present study was approved by the Ethics
Committee for Animal Experimentation at The University of Life
Sciences (Lublin, Poland; approval number 81/2015).
Consent for publication
Not applicable.
Competing interests
The authors confirm that they have no competing
interests.
References
|
1
|
Schlageter M, Terracciano LM, D'Angelo S
and Sorrentino P: Histopatholgy of hepatocellular carcinoma. World
J Gastroenterol. 20:15955–15964. 2014. View Article : Google Scholar : PubMed/NCBI
|
|
2
|
Zou C, Zhang H, Li Q, Xiao H, Yu L, Ke S,
Zhou L, Liu W, Wang W, Huang H, et al: Heme-oxygenase-1: A
molecular brake on hepatocellular carcinoma cell migration.
Carcinogenesis. 32:1840–1848. 2011. View Article : Google Scholar : PubMed/NCBI
|
|
3
|
Lee KP, Lee JH, Kim TS, Park HD, Byun JS,
Kim MC, Jeong WI, Calvisi DF, Kim JM and Lim DS: The Hippo-Salvador
pathway restrains hepatic oval cell proliferation, liver size, and
liver tumorigenesis. Proc Natl Acad Sci USA. 107:8248–8253. 2010.
View Article : Google Scholar : PubMed/NCBI
|
|
4
|
Wójcik M, Bobowiec R and Martelli F:
Effect of carotenoids on in vitro proliferation and differentiation
of oval cells during neoplastic and non-neoplastic liver injures in
rats. J Physiol Pharmacol. 59 Suppl 2:S203–S213. 2008.
|
|
5
|
Zheng T, Wang J, Jiang H and Liu L: Hippo
signalling in oval cells and hepatocarcinogenesis. Cancer Lett.
302:91–99. 2011. View Article : Google Scholar : PubMed/NCBI
|
|
6
|
Jin J, Jin X, Qian C, Ruan Y and Jiang H:
Signaling network of OSW-1-induced apoptosis and necroptosis in
hepatocellular carcinoma. Mol Med Rep. 7:1646–1650. 2013.
View Article : Google Scholar : PubMed/NCBI
|
|
7
|
Fulda S: The mechanism of necroptosis in
normal and cancer cell. Cancer Biol Ther. 14:999–1004. 2013.
View Article : Google Scholar : PubMed/NCBI
|
|
8
|
Jouan-Lanhouet S, Riquet F, Duprez L,
Vanden Berhe T, Takahashi N and Vandenabeele P: Necroptosis, in
vivo detection in experimental disease models. Semin Cell Devel
Biol. 35:2–13. 2014. View Article : Google Scholar
|
|
9
|
Schattenberg JM, Schumann M and Galle PR:
Cell death and hepatocarcinogenesis: Dysregulation of apoptosis
signaling pathways. J Gastroenterol Hepatol. 26 Suppl 1:S213–S219.
2011. View Article : Google Scholar
|
|
10
|
Hu X, Han W and Li L: Targeting the weak
point of cancer by induction of necroptosis. Autophagy. 3:490–492.
2007. View Article : Google Scholar : PubMed/NCBI
|
|
11
|
Jiang L, Kon N, Li T, Wang SJ, Su T,
Hibshoosh H, Baer R and Gu W: Ferroptosis as a p53-mediated
activity during tumor suppression. Nature. 520:57–62. 2015.
View Article : Google Scholar : PubMed/NCBI
|
|
12
|
He S, Wang L, Miao L, Wang T, Du F, Zhao L
and Wang X: Receptor interacting protein kinase-3 determines
cellular necrotic response to TNF-alpha. Cell. 137:1100–1111. 2009.
View Article : Google Scholar : PubMed/NCBI
|
|
13
|
Vandenabeele P, Galluzi L, Vanden Berghe T
and Kroemer G: Molecular mechanisms of necroptosis: An ordered
cellular explosion. Nat Rev Mol Cell Biol. 11:700–714. 2010.
View Article : Google Scholar : PubMed/NCBI
|
|
14
|
Fulda S: Therapeutic exploitation of
necroptosis for cancer therapy. Semin Cell Dev Biol. 35:51–56.
2014. View Article : Google Scholar : PubMed/NCBI
|
|
15
|
Saeed WK and Jun DW: Necroptosis: An
emerging type of cell death in liver diseases. World J
Gastroenterol. 20:12526–12532. 2014. View Article : Google Scholar : PubMed/NCBI
|
|
16
|
Solt D and Farber E: New principle for the
analysis of chemical carcinogenesis. Narure. 263:701–703. 1976.
|
|
17
|
Higgins G and Anderson G: Experimental
pathology of the liver restoration of the liver of the white rat
following partial surgical removal. Arch Pathol (Chic). 12:186–202.
1931.
|
|
18
|
Shupe TD, Piscaglia AC, Oh SH, Gasbarrini
A and Petersen BE: Isolation and characterization of hepatic stem
cells, or ‘oval cells,’ from rat livers. Method Mol Biol.
482:387–405. 2009. View Article : Google Scholar
|
|
19
|
He ZP, Tan WQ, Tang YF, Zhang HJ and Feng
MF: Activation, isolation, identification and in vitro
proliferation of oval cells from adult rat livers. Cell Prolif.
37:177–187. 2004. View Article : Google Scholar : PubMed/NCBI
|
|
20
|
Strober W: Trypan blue exclusion test of
cell viability. Curr Protoc Immunol. 21:3B:A.3B.1–A.3B.2. 2001.
|
|
21
|
Head KW, Cullen JM, Dubielzig RR, Else RW,
Misdorp W, Patnaik AK, Tateyama S and Van Der Gaag I: Histological
Classification of Tumors of the Alimentary System of Domestic
AnimalsSecond Series. WHO, Armed Forces Institute of Pathology;
Washington, DC: 2003
|
|
22
|
Lowry OH, Rosebrough NJ, Farr AL and
Randall RJ: Protein measurement with the Folin phenol reagent. J
Biol Chem. 193:265–275. 1951.PubMed/NCBI
|
|
23
|
Wójcik M, Bobowiec R, Lisiecka U and
Kostro K: Proliferation, differentiation and apoptosis of choline
deficient ethionine supplemented diet-rat oval cells under the
influence of 2-methoxyestradiol. J Physiol Pharmacol. 63:669–676.
2012.PubMed/NCBI
|
|
24
|
Wójcik M, Wessely-Szponder J and
Kosior-Korzecka U: Proliferative and oxidative response of
hepatocytes (Hep) and hepatic stellate cells (HSC) isolated from
rats exposed to ketogenic diet. Pol J Vet Sci. 17:703–711. 2014.
View Article : Google Scholar : PubMed/NCBI
|
|
25
|
Kearney CJ, Cullen SP, Clancy D and Martin
SJ: RIPK1 can function as an inhibitor rather than an initiator of
PIPK3-dependent necroptosis. FEBS J. 281:4921–4934. 2014.
View Article : Google Scholar : PubMed/NCBI
|
|
26
|
Upton JW, Kaiser WJ and Mocarski ES:
DAI/ZBP1/DLM-1 complexes with RIP3 to mediate virus-induced
programmed necrosis that is targeted by murine cytomegalovirus
VIRA. Cell Host Microbe. 15:290–297. 2012. View Article : Google Scholar
|
|
27
|
Christofferson DE and Yuan J: Necroptosis
as an alternative form of programmed cell death. Curr Opin Cell
Biol. 22:263–268. 2010. View Article : Google Scholar : PubMed/NCBI
|
|
28
|
Declercq W, Vanden Berghe T and
Vandenabeele P: RIP kinase at the crossroads of cell death and
survival. Cell. 138:229–232. 2009. View Article : Google Scholar : PubMed/NCBI
|
|
29
|
Newton K: RIPK1 and RIPK3: Critical
regulators of inflammation and cell death. Trends Cell Biol.
25:347–353. 2015. View Article : Google Scholar : PubMed/NCBI
|
|
30
|
Zhou W and Yuan J: Necroptosis in health
and diseases. Semin Cell Dev Biol. 35:14–23. 2014. View Article : Google Scholar : PubMed/NCBI
|