Introduction
China is one of the countries with a high incidence
rate of chronic viral hepatitis B (CHB). The infection of its
hepatitis B virus (HBV) can lead to the occurrence of a variety of
liver diseases, including liver fibrosis, severe hepatitis and
hepatocellular carcinoma developed from lesions in the terminal
stage (1–3). The main cause of liver fibrosis is that
the degradation of the extracellular matrix in the liver leads to
inadequate or excessive collagen synthesis, resulting in a large
number of collagen deposition near the hepatic lobule and finally
hindering the exchange of liver cells and blood substances, which
will lead to the liver cell necrosis and degeneration, followed by
liver fibrosis and connective tissue hyperplasia (4). Currently, CHB in about 25% of the
patients develops into cirrhosis that is the terminal stage of the
disease, and patients will not survive from it unless they receive
liver transplantation (5).
Therefore, it is hoped to accurately detect the occurrence of liver
fibrosis in the early stage and make corresponding treatment and
intervention, which can effectively reduce the patients' pain and
financial pressure. Now, liver biopsy still serves as the gold
standard for liver fibrosis; however, it is relatively difficult to
popularize and apply it in clinical practice.
Previous studies have shown that Fibroscan and
computer tomography (CT) perfusion imaging can accurately assess
and grade liver fibrosis (6,7). Fibroscan is a diagnostic tool for liver
fibrosis with no invasiveness, whose principle is to diagnose the
human body through low-frequency ultrasounds, and it is mainly used
to detect the degree of liver cirrhosis and give feedbacks through
the instantaneous elastic spectrums of the liver; when liver
fibrosis occurs in liver tissues, Fibroscan can be used for
quantitative grading for liver fibrosis at different degrees
(8). The main method of CT perfusion
imaging is to directly perfuse the human body so as to achieve
semi-quantitative or quantitative analysis of the human body
perfusion directly through CT imaging methods; CT perfusion is
characterized by short scanning time, high recognition rate and
simple technique, and changes in human blood flows can be observed
through it while the analysis is conducted (9,10).
However, there are few reports on the comparison between the two
methods. Therefore, values of the two methods in the diagnosis of
liver fibrosis were studied and explored, and the results of the
two methods were compared.
Materials and methods
Data of patients
In the present study, the clinical data of 320
patients with chronic liver disease examined and treated in Qingdao
Municipal Hospital (Qingdao, China) from April 2014 to May 2016
were retrospectively analyzed. Among them, there were 266 cases of
HBV, including 147 males and 119 females aged 29–60 years, with an
average of 47.4±12.5 years; there were 54 cases of hepatitis C
virus (HCV), including 27 males and 27 females aged 33–57 years,
with an average age of 44.4±10.2 years. Guidelines for prevention,
Care and Treatment of Persons with CHB (Version 2009) (11) and Guidelines for Prevention, Care and
Treatment of Persons with Hepatitis C (Version 2015) (12) were taken as the diagnostic criteria.
Clinical data of patients are shown in Table I. The relevant study was carried out
under the approval of the Ethics Committee of Qingdao Municipal
Hospital, and all patients were informed and signed a formal
written authorization.
 | Table I.Clinical data of patients. |
Table I.
Clinical data of patients.
| Clinical data | Groups n (%) |
|---|
| Sex | |
| Male | 174 (54.38) |
|
Female | 146 (45.62) |
| Age |
|
>50 | 166 (51.87) |
| ≤50 | 154 (48.13) |
| Place of
residence |
| City | 284 (88.75) |
|
Countryside | 36 (11.25) |
| Educational
level |
| <
Junior college | 230 (71.85) |
| ≥ Junior
college | 90 (28.15) |
| Eating habit |
| A spicy
diet | 66 (20.63) |
| A light
diet | 254 (79.37) |
| PT | 11.40±1.14 sec |
| WBC |
5.33±1.38×10⁹/l |
| PLT |
169.5±56.1×10⁹/l |
Inclusion and exclusion criteria
Inclusion criteria: Patients with the course of
disease of six months; receiving no drug treatment recently; with
no other genetic diseases; receiving no radiotherapy and
chemotherapy; and patients with autism, memory disorders and
hearing disorders. Exclusion criteria: Patients with respiratory
diseases; with hypertension or diabetes mellitus; with blood
relationship with other patients; receiving no blood transfusion
recently; and patients who did not cooperate with the follow-up or
had incomplete clinical data.
Detection methods
Tissue biopsy
All patients underwent liver tissue puncture
operation. Before the operation, blood routine examination and
blood clotting time detection were conducted for patients. Patients
were placed in the supine position, and the operation was conducted
under the guidance of ultrasounds. The size of liver tissues taken
by biopsy should not be less than 15 mm. Liver fibrosis staging: In
S1, the portal area of fibrosis in patients was enlarged; in S2,
fibrosis occurred around the portal area; in S3, the fibrous septum
was accompanied by lobular disorders with no liver cirrhosis; and
in S4, liver parenchyma was damaged with diffuse fibrosis and
lobular structure disorders.
Fibroscan detection method
Instantaneous elastic ultrasonic instrument is a
product of Echosens (Paris, France), and the testing method was
operated in strict accordance with Fibroscan instructions. Subjects
were placed in the supine position with right arms lifted behind
1/4 of the right brain, and the intercostal space in the lobe area
of patients was detected. The probe was dipped in a little
ultrasound coupling agent, which was applied perpendicularly to the
human skin; the probe was put closely near the skin and was used
for detection for conservative 10 times, and the median was taken
as the result.
CT perfusion detection
Under the state of solid and liquid fasting as
required, patients should sit quietly and keep eupnea at half an
hour before examination. In the experiment, a 16-slice spiral CT
scanner was used to scan patients. Patients underwent the first
abdominal plain scan at the voltage of 120 kV, the current of 260
mA and the scan thickness of 10 mm for 0.8 sec in total. The left
and right lobes of the liver and main portal veins were developed.
The scanning bed was then adjusted for enhanced scanning of the
selected area. The scan parameters were set at 0.8 sec/360°,
voltage (120 kV), current (260 mA), thickness (5´4 mm) and field of
view (360 mm). In this experiment, a total of 40 ml Omnipaque (350
mg/ml) was used as a contrast reagent, its flow rate was 3 ml/sec,
the duration was 5 sec, and the scanning time was 60 sec in total.
All the data obtained after scanning were uploaded to the
workstation. In the experiment, GEAW 4.2 was applied to analyze the
uploaded data.
Statistical methods
SPSS 22.0 (IBM Corp., Armonk, NY, USA) software
package was used in this experiment for statistical analyses of the
collected data of all patients. Receiver operating characteristic
(ROC) curves of patients detected by the two methods were plotted
using ROCR and pROC packages. Normality test was performed for the
experimental data. Comparison between groups was done using one-way
ANOVA test followed by post hoc test (Least Significant
Difference). Chi-square test was conducted for the non-normally
distributed data. The data in this experiment were expressed as
mean ± standard deviation (mean ± SD). P<0.05 was considered to
indicate a statistically significant difference.
Results
Biopsy results
All the patients received liver biopsy in this
experiment, and the results showed that 320 patients suffered from
liver fibrosis at different degrees. There were 85 cases (26.5%) in
S1, 98 (30.6%) in S2, 76 (23.7%) in S3 and 61 (19.1%) in S4.
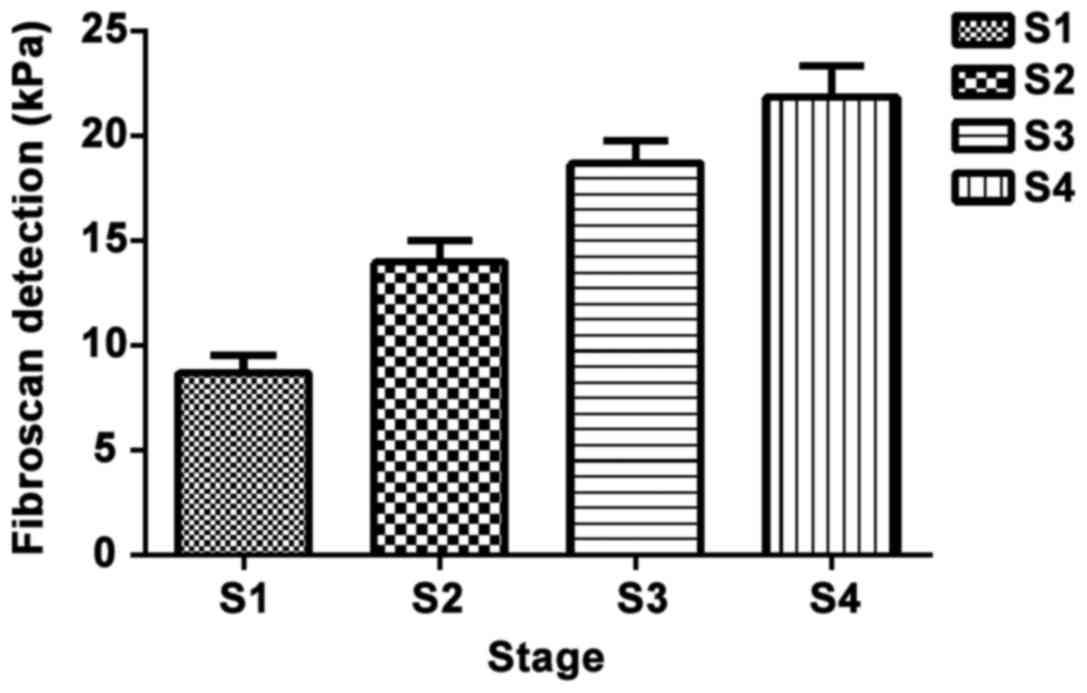
Fibroscan detection results of
patients
The detection results of liver cirrhosis for 320
patients: The average detection value of liver cirrhosis in
patients was (14.11±9.37) kPa, and there were 63 cases (8.67±6.67)
kPa in S1, 98 cases (13.97±10.41) kPa in S2, 74 cases (18.67±9.61)
kPa in S3 and 59 cases (21.84±11.67) pKa in S4. Liver cirrhosis was
detected in a total of 294 patients with a detection rate of 91.88%
(294/320) (Fig. 1).
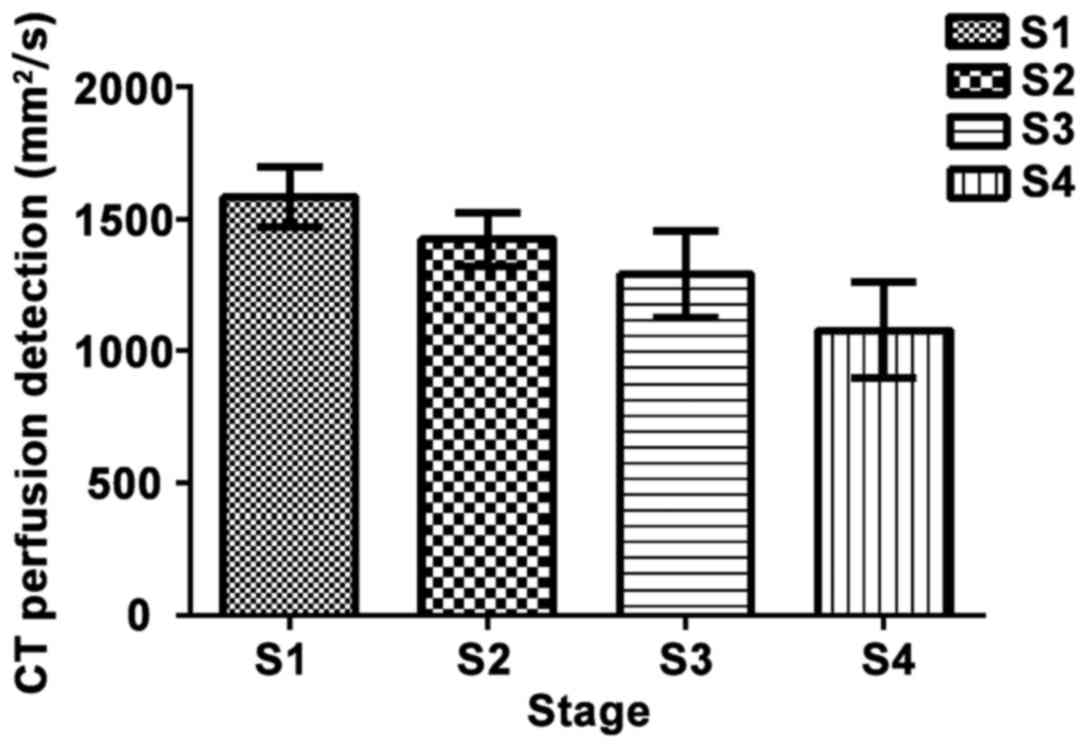
CT perfusion detection
The apparent diffusion coefficient value in each
group was detected via CT perfusion in 320 patients, which showed
that there were 72 cases (1,584.80±115.00) mm2/sec in
S1, 98 (1,421.80±103.00) mm2/sec in S2, 75
(1,288.60±162.80) mm2/sec in S3 and (1,079.00±179.30)
mm2/sec in S4. Liver fibrosis was detected in a total of
306 patients with a detection rate of 95.63% (306/320) (Fig. 2).
Comparison of the detection rate
between the two methods and ROC analyses
The detection rates of Fibroscan and CT perfusion in
patients were 91.88 and 95.63%, respectively, and there was no
statistically significant difference between the two methods
(P>0.05). ROC curves of the two methods in different stages were
plotted, respectively. It was found that the areas under the curve
(AUC) of ROC detected by CT perfusion imaging and ultrasound
elastography in the diagnosis of liver fibrosis were 0.833 and
0.857, respectively (P>0.05). The AUC values of patients
detected by the two methods were 0.841 and 0.865 in S1,
(P>0.05), 0.830 and 0.887 in S2, (P>0.05), 0.851 and 0.931 in
S3, (P>0.05), and 0.951 and 0.970 in S4, respectively
(P>0.05) (Fig. 3).
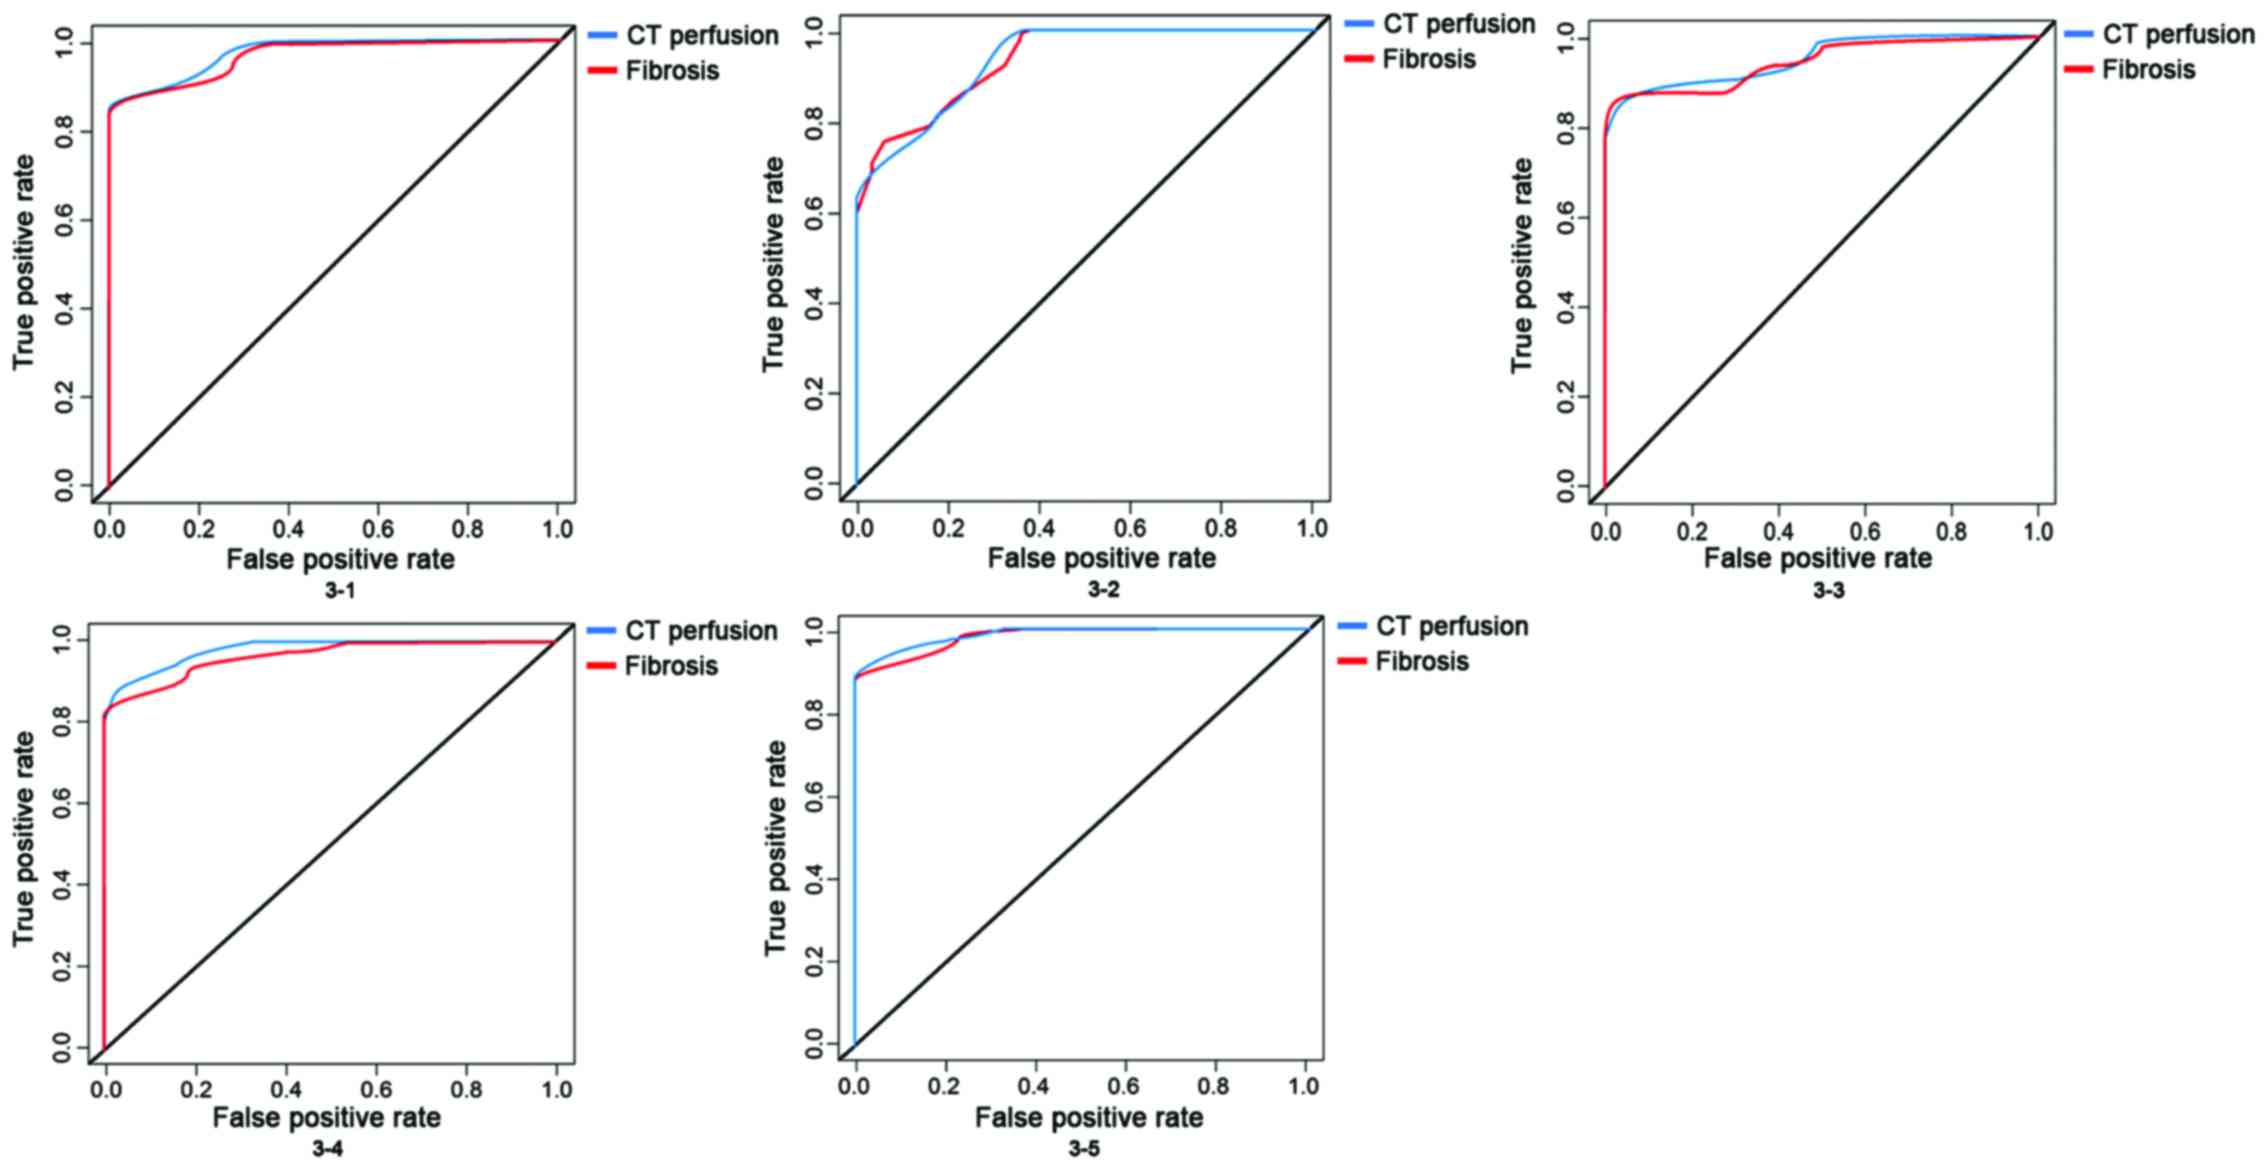 | Figure 3.ROC curves of Fibroscan detection and
CT perfusion detection. ROC curves are used to analyze the
detection results by two methods, which shows that there is no
difference between the two methods (P>0.05), but there is a good
specificity and sensitivity, and there are also no differences in
ROC curves among different analyses (P>0.05). 3–1: The detection
rates of Fibrosis and CT perfusion in patients were 0.919 and
0.956, (P>0.05). 3-2: The AUC values of patients detected by the
two methods were 0.841 and 0.865 in S1, (P>0.05); 3-3, were
0.830 and 0.887 in S2, (P>0.05); 3–4, were 0.851 and 0.931 in
S3, (P>0.05); and 3–5, were 0.951 and 0.970in S4, respectively
(P>0.05). CT, computed tomography; ROC receiver operating
characteristic; AUC, areas under the curve. |
Discussion
According to the statistics of the World Health
Organization (WHO), about 1/4 of the people in the world have ever
had HBV infection, 350 million people are diagnosed with chronic
HBV infection, and about 0.9–1 million people die of liver
cirrhosis or liver cancer due to HBV infection each year (13). CHB is a chronic liver disease caused
by persistent HBV infection; liver fibrosis is a function repairing
liver injury caused by CHB, and it is also an unavoidable process
of pathological changes of liver cirrhosis and liver cancer in
patients with CHB. Therefore, accurate judgment and assessment of
liver fibrosis can be very effective in the customization and
judgement of the prognosis of patients with liver fibrosis. As a
dynamic process of liver tissue injury repair, liver fibrosis needs
continuous testing and observation. At present, liver biopsy is one
of the gold standards of liver fibrosis, but it will produce wounds
to patients with shortcomings such as poor repeatability, so it is
not suitable to be widely promoted in clinical practice.
Non-invasive diagnosis of liver fibrosis has been a hot topic in
recent years, and the accuracies of serum protein electrophoresis,
fibrosis-4 (FIB-4) and other serum diagnostic methods are not ideal
compared with that of biopsy (14).
Clinically, CT measurement mainly focuses on
cirrhosis and liver cancer; CT perfusion directly reflects the
structure of tissues through the detection of the water molecular
flow within human tissues and blood flow perfusion, and it can also
be used to diagnose and identify liver lesions by observation of
the molecular level and provide information of clinical value
(7). At present, there are few
studies on CT perfusion of liver fibrosis. It has been reported
(15) that after the treatment by
multislice CT (MSCT) perfusion technique, the portal vein perfusion
volume of cirrhosis < that of chronic hepatitis < that of
normal control group, which proves that in the hepatitis-cirrhosis
process, blood perfusion is gradually varied. Fibroscan, as a new
type of noninvasive in vitro diagnostic instrument, is an
instrument for liver diseases, which can be used for real-time
monitoring of liver hardness through low-frequency pulses, so as to
determine the degree of liver cirrhosis. Many studies in China and
other countries have shown that Fibroscan can be used as a
relatively good diagnostic method for chronic liver fibrosis in
hepatitis C patients, and it has high diagnostic values in patients
with HBV, fatty liver and alcoholic liver disease (16,17). The
article of Roulot et al (18)
mentioned that the detection for 1,358 healthy people by Fibroscan
shows that the specificity and positive detection rate of Fibroscan
in the diagnosis of liver cirrhosis in people over 45-years-old are
up to 100%. This well illustrates that liver fibrosis can be
predicted by Fibroscan.
In the present study, it was confirmed through liver
biopsy that 320 patients suffered from liver fibrosis at varying
degrees; besides, CT perfusion and Fibroscan were used for
diagnostic research in 320 patients so as to explore the accuracy
rate of the two methods in the diagnosis of liver fibrosis. The
results revealed that both methods had high accuracy rate (95.63
and 91.88%) in the diagnosis of liver fibrosis, and there was no
statistical difference between them. Studies (19,20) have
shown that CT perfusion technique and Fibroscan produce good
diagnostic results in liver fibrosis. Wang et al (6) applied Fibroscan to detect the degree of
liver fibrosis in patients with chronic hepatitis, and the results
showed that the positive diagnostic rate reaches 90%, which is
basically the same as the rate in this experiment, thus well
proving the accuracy of the experiment. The article of Hashimoto
et al (21) indicated that CT
perfusion detection can be used to effectively detect the degree of
liver fibrosis and has great significance in prognosis evaluation
and diagnosis in patients. The clinical value of CT perfusion in
the diagnosis of liver fibrosis was further testified. Therewith,
ROC curve analysis was conducted for patients with liver fibrosis
at different degrees, and it was found that there were no
differences in AUC values measured by the two different methods.
However, compared with CT perfusion, Fibroscan is characterized by
high repeatability, simple operation and relatively low cost. Both
the two methods have disadvantages since they radiate the human
body; for example, they will affect the growth of the baby in
pregnant and lying-in women. Therefore, the treatment method needs
to be selected according to the actual situation of patients.
There are still shortcomings in this study. Lack of
subjects led to biased experimental results in the retrospective
analysis, so the sample size needs to be expanded; the two methods
were simply compared in the experiment, and randomized controlled
experiments can be conducted in the future to better prove the
experimental results. Besides, Fibroscan is popular in foreign
countries, and a certain degree of biases may be caused if Chinese
population is graded according to the reference range for foreign
populations. Chinese people are generally short in stature, and
their intercostal spaces are relatively narrow, which may affect
the experimental results, so there is a need to improve the
accuracy of the experimental results according to better standards
set for Chinese people.
In conclusion, patients with liver fibrosis were
diagnosed by two different methods in this study, both of which
have significantly relatively high accuracies and are worthy of
promotion.
Acknowledgements
Not applicable.
Funding
This work was supported by Qingdao Municipal
Hospital, (Shandong, China).
Availability of data and materials
All data generated or analyzed during this study are
included in this published article.
Authors' contributions
YL and QP designed the study, QP and HZ collected
the data, HZ and YL analyzed the data. YL was for preparation of
manuscript. All authors read and approved the final manuscript.
Ethics approval and consent to
participate
The relevant study was carried out under the
approval of the Ethics Committee of Qingdao Municipal Hospital
(Qingdao, China) and all patients were informed and signed a formal
written authorization. Research protocols were assessed and
accepted by the institutional.
Patient consent for publication
Not applicable.
Competing interests
All authors have no conflict of interest to
declare.
References
|
1
|
Rehermann B: Pathogenesis of chronic viral
hepatitis: Differential roles of T cells and NK cells. Nat Med.
19:859–868. 2013. View
Article : Google Scholar : PubMed/NCBI
|
|
2
|
Schweitzer A, Horn J, Mikolajczyk RT,
Krause G and Ott JJ: Estimations of worldwide prevalence of chronic
hepatitis B virus infection: A systematic review of data published
between 1965 and 2013. Lancet. 386:1546–1555. 2015. View Article : Google Scholar : PubMed/NCBI
|
|
3
|
Trépo C, Chan HLY and Lok A: Hepatitis B
virus infection. Lancet. 384:2053–2063. 2014. View Article : Google Scholar : PubMed/NCBI
|
|
4
|
Trautwein C, Friedman SL, Schuppan D and
Pinzani M: Hepatic fibrosis: Concept to treatment. J Hepatol.
62:15–24. 2015. View Article : Google Scholar : PubMed/NCBI
|
|
5
|
Gordon SC, Lamerato LE, Rupp LB, Li J,
Holmberg SD, Moorman AC, Spradling PR, Teshale EH, Vijayadeva V,
Boscarino JA, et al: CHeCS Investigators: Antiviral therapy for
chronic hepatitis B virus infection and development of
hepatocellular carcinoma in a US population. Clin Gastroenterol
Hepatol. 12:885–893. 2014. View Article : Google Scholar : PubMed/NCBI
|
|
6
|
Wang JH, Changchien CS, Hung CH, Eng HL,
Tung WC, Kee KM, Chen CH, Hu TH, Lee CM and Lu SN: FibroScan and
ultrasonography in the prediction of hepatic fibrosis in patients
with chronic viral hepatitis. J Gastroenterol. 44:439–446. 2009.
View Article : Google Scholar : PubMed/NCBI
|
|
7
|
Ronot M, Asselah T, Paradis V, Michoux N,
Dorvillius M, Baron G, Marcellin P, Van Beers BE and Vilgrain V:
Liver fibrosis in chronic hepatitis C virus infection:
Differentiating minimal from intermediate fibrosis with perfusion
CT. Radiology. 256:135–142. 2010. View Article : Google Scholar : PubMed/NCBI
|
|
8
|
Xu M, Wang X, Zou Y and Zhong Y: Key role
of liver sinusoidal endothelial cells in liver fibrosis. Biosci
Trends. 11:163–168. 2017. View Article : Google Scholar : PubMed/NCBI
|
|
9
|
Kim SH, Kamaya A and Willmann JK: CT
perfusion of the liver: Principles and applications in oncology.
Radiology. 272:322–344. 2014. View Article : Google Scholar : PubMed/NCBI
|
|
10
|
Lv WF, Han JK, Cheng DL, Zhou CZ, Ni M and
Lu D: CT perfusion imaging can predict patients' survival and early
response to transarterial chemo-lipiodol infusion for liver
metastases from colorectal cancers. Korean J Radiol. 16:810–820.
2015. View Article : Google Scholar : PubMed/NCBI
|
|
11
|
Lok ASF and McMahon BJ: Chronic hepatitis
B: Update 2009. Hepatology. 50:661–662. 2009. View Article : Google Scholar : PubMed/NCBI
|
|
12
|
Chen HS, Dou XG, Duan ZP, et al:
Guidelines for the prevention and treatment of hepatitis C (Updated
2015). Zhongguo Bingdubing Zazhi. 2015:425–447. 2015.(In
Chinese).
|
|
13
|
Liaw YF and Chu CM: Hepatitis B virus
infection. Lancet. 373:582–592. 2009. View Article : Google Scholar : PubMed/NCBI
|
|
14
|
Forlenza GP and Stewart MW: Diabetic
retinopathy in children. Pediatr Endocrinol Rev. 10:217–226.
2012.PubMed/NCBI
|
|
15
|
Nakashige A, Horiguchi J, Tamura A,
Asahara T, Shimamoto F and Ito K: Quantitative measurement of
hepatic portal perfusion by multidetector row CT with compensation
for respiratory misregistration. Br J Radiol. 77:728–734. 2004.
View Article : Google Scholar : PubMed/NCBI
|
|
16
|
Zayed BEM, Elsharkawy A, Abdou M, Al Fatah
Abd DS and El-Shabony TH: Assessment of hepatic fibrosis by
fibroscan in egyptian chronic hemodialysis patients with chronic
Hepatitis C (genotype 4): A single-center study. Saudi J Kidney Dis
Transpl. 28:764–773. 2017.PubMed/NCBI
|
|
17
|
Liu CH, Liu CJ, Su TH, Yang HC, Kao JH,
Chen DS and Chen PJ: THU-478-Noninvasive diagnosis of hepatic
fibrosis by biofibroscore in patients with chronic hepatitis C
virus infection. J Hepatol. 66:S233–S234. 2017. View Article : Google Scholar
|
|
18
|
Roulot D, Costes JL, Buyck JF, Warzocha U,
Gambier N, Czernichow S, Le Clesiau H and Beaugrand M: Transient
elastography as a screening tool for liver fibrosis and cirrhosis
in a community-based population aged over 45 years. Gut.
60:977–984. 2011. View Article : Google Scholar : PubMed/NCBI
|
|
19
|
Lamb P, Sahani DV, Fuentes-Orrego JM,
Patino M, Ghosh A and Mendonça PR: Stratification of patients with
liver fibrosis using dual-energy CT. IEEE Trans Med Imaging.
34:807–815. 2015. View Article : Google Scholar : PubMed/NCBI
|
|
20
|
Cassinotto C, Lapuyade B, Mouries A,
Hiriart JB, Vergniol J, Gaye D, Castain C, Le Bail B, Chermak F,
Foucher J, et al: Non-invasive assessment of liver fibrosis with
impulse elastography: Comparison of Supersonic Shear Imaging with
ARFI and FibroScan®. J Hepatol. 61:550–557. 2014.
View Article : Google Scholar : PubMed/NCBI
|
|
21
|
Hashimoto K, Murakami T, Dono K, Hori M,
Kim T, Kudo M, Marubashi S, Miyamoto A, Takeda Y, Nagano H, et al:
Assessment of the severity of liver disease and fibrotic change:
The usefulness of hepatic CT perfusion imaging. Oncol Rep.
16:677–683. 2006.PubMed/NCBI
|