Introduction
Pulmonary thromboembolism, or pulmonary embolism
(PE), is a clinical and pathophysiological syndrome resulting from
obstruction of a pulmonary artery or its branches by emboli from
the venous system or right heart, causing dysfunction of the
pulmonary circulation and respiratory system (1,2). The
incidence of PE in the USA and Europe is 60-75 per 100,000 persons
per year (3–6). The incidence of PE is thought to be
lower in Asia (7,8), but recent data suggest that the
incidence and causes of PE may be similar between Chinese and
Caucasian populations (9).
Hospitalization and childbirth (i.e., the postpartum period)
increase the risk of PE (10–12).
Nevertheless, PE is a dangerous condition (2) that leads to significant right heart
dysfunction (13), and the 30-day
all-cause mortality is 13% (14). A
major issue in the diagnosis of PE is that some symptoms (such as
dyspnea, chest pain, cough and/or fever) are not specific to PE and
may be obscured by symptoms caused by another condition (2,15–17).
At present, the main methods used for the diagnosis
of PE are laboratory investigations and imaging. Digital
subtraction angiography (DSA) of the pulmonary artery is considered
the most accurate (gold standard) method for diagnosing PE
(2,15–17).
Nevertheless, DSA is an invasive technique that is associated with
complications, cannot show emboli in the peripheral branches of a
pulmonary artery, and cannot be repeated many times because of its
invasiveness. Therefore, DSA is not the first choice method for
screening or diagnosing PE (2,16).
Recent developments in computed tomography (CT) have
led to multi-slice spiral CT being adopted in clinical practice for
the diagnosis of PE, and CT is now favored over DSA (2). Great improvements in temporal
resolution and scanning speed have resulted in CT pulmonary
angiography (CTPA) now being widely used in the diagnosis of PE
(18–23).
D-dimer is a fibrin degradation product generated
from blood clot degradation by fibrinolysis (24). Blood D-dimer levels can be used to
help diagnose thrombosis (24).
Previous studies reported that D-dimer levels in patients with
acute PE are increased significantly (25–27).
Nevertheless, some controversies still exist about the use of
D-Dimer for diagnosing PE, including the optimal threshold value
that should be used and issues relating to other causes of elevated
D-dimer levels (28,29). Some studies suggested that D-dimer
could be used alone for PE screening, avoiding unnecessary CTPA
scans (30,31). In addition, D-dimer levels correlate
with the extent of PE on CTPA (32).
Nevertheless, the use of D-dimer alone is still controversial, and
additional studies are still necessary to determine the cut-off
point of the D-dimer level that should be used in the diagnosis of
PE. Therefore, the aim of the present study was to conduct a
comparative analysis of plasma D-dimer levels and CTPA for the
diagnosis of PE and to determine the optimal threshold for D-dimer
level, using CTPA as the gold standard.
Materials and methods
Study design and subjects
This was a retrospective analysis of 32 consecutive
patients with suspected PE at the Affiliated Hospital of Yan'an
University between October 2010 and March 2011. This study was
approved by the ethics committee of the Affiliated Hospital of
Yan'an University. The need for individual consent was waived by
the committee because of the retrospective nature of the study.
The inclusion criteria were: Symptoms of acute chest
pain and dyspnea; and a suspected diagnosis of PE. The exclusion
criteria were: Past history of PE; anticoagulation therapy received
before blood sampling; known allergy to the contrast agent used for
CTPA; hepatic or renal dysfunction; unable to cooperate with the
examinations; and data required for the analysis were missing from
the medical records.
Plasma D-dimer levels
Blood sampling was done before any thrombolytic
therapy was administerd. Plasma D-dimer levels were measured using
a CA-7000 automatic coagulation instrument (Sysmex Corporation,
Kobe, Japan), and the assay was based on the latex agglutination
test. The positivity threshold was 1.3 µg/ml.
CTPA
CTPA was performed after blood sampling using a
Siemens Somatom Sensation 64 CT scanner (Siemens Healthineers,
Erlangen, Germany); the interval between the two examinations was
less than 48 h. Non-ionic water-soluble iodinated contrast agent
(Ultravist 370 mgI/mg) was injected at a dose of 1.2-1.5 ml/kg and
a rate of 3.5-4.0 ml/s using a Stellant D high pressure injector
(Medrad Inc., Warrendake, PA, USA). Each patient was placed in the
supine position on the examination bed with both arms above his/her
head. Scanning was performed from the bottom of the lungs to the
apex of the lungs during a single breath hold. The scanning
parameters were: 120 kV, 85-160 mA, rotation time 0.33 sec, pitch
1.0, and matrix 512×512. Time-density curves were obtained for all
patients.
Image post-processing
Standard reconstruction of the original images was
carried out for all included cases. The reconstructed images had a
layer thickness of 0.6 mm and an interval of 0.4 mm. The
mediastinal window (window width 350 HU, window level 50 HU), lung
window (window width 1,200 HU, window level −500 HU) and PE window
(window width 1,000 HU, window level 400 HU) were reconstructed
(33). All data were transmitted to
a Leonardo workstation (Siemens Healthineers), and 3D imaging
software was used for post-processing, which included multiple
planar reformation (MPR), maximum intensity projection (MIP) and
volume rendering (VR).
Image analysis
All images were analyzed using a Leonardo
workstation (Siemens Healthineers). The axial lung parenchyma,
mediastinum, great cardiac vessels, inferior phrenic artery,
posterior intercostal artery, bronchial artery and internal
thoracic artery were observed by two experienced radiologists, and
lesion site, shape, size, number and density were recorded. In the
case of discrepancy, consensus was reached through discussion with
a third party (an associate chief physician).
Statistical analysis
Continuous data were tested for a normal
distribution using the Kolmogorov-Smirnov test. Normally
distributed continuous data are presented as means ± standard
deviations. Categorical data are presented as frequencies.
Contingency tables were constructed to evaluate the accuracy of
using the D-dimer level to diagnose PE, with CTPA as the gold
standard. Receiver operating characteristics (ROC) curve analysis
was carried out to validate the results. Analyses were carried out
using SPSS v.13.0 (SPSS Inc., Chicago, IL, USA). P<0.05 was
considered to indicate a statistically significant difference.
Results
Clinical characteristics of the
subjects
The present study included 16 males and 16 females
with an average age of 58.5±16.6 years (range, 21 to 90 years). The
main symptoms were chest pain, with or without cough, shortness of
breath and dyspnea. Among the 32 patients, there were six patients
with deep vein thrombosis, seven patients with a recent surgical
history (four patients with a history of general surgery, two with
a history of orthopedic surgery and one with a history of urologic
surgery), two patients in the postpartum period, three patients
with a history of coronary heart disease, and 12 patients with a
history of smoking (Table I). CTPA
was used for the diagnosis of PE: Among the 32 patients, there were
26 patients with PE and six patients without obvious abnormality.
No patients had an allergic reaction to the contrast agent.
 | Table I.Characteristics of the 32 patients
with suspected PE. |
Table I.
Characteristics of the 32 patients
with suspected PE.
|
Characteristics | n |
|---|
| Deep vein
thrombosis | 6/32 |
| Recent surgery | 7/32 |
| Postpartum
period | 2/32 |
| Trauma | 2/32 |
| Bedridden | 1/32 |
| Chest pain | 5/32 |
| Dyspnea | 1/32 |
| Shortness of
breath | 13/32 |
| Hemoptysis | 2/32 |
| Fever | 2/32 |
| Cough and
expectoration | 4/32 |
| Incidental finding
in abdominal CT scan | 2/32 |
Sites of PE
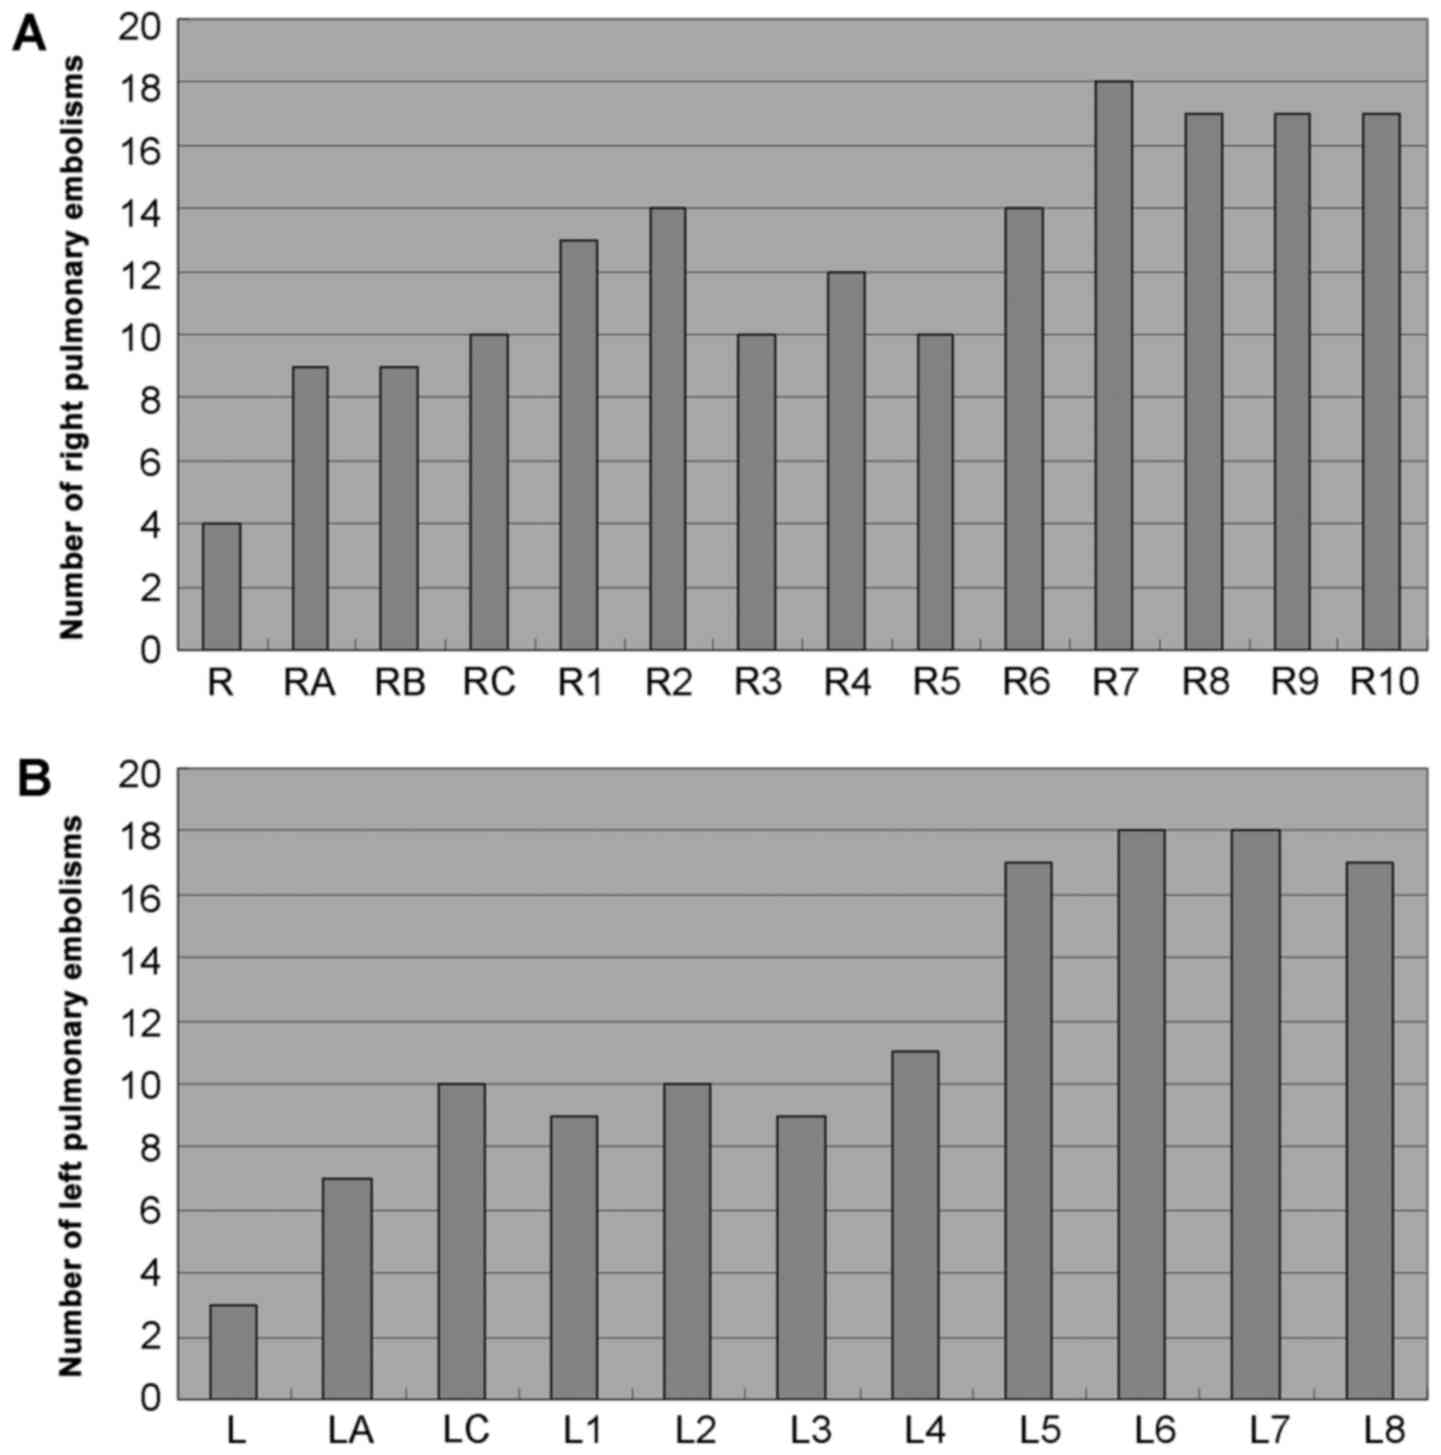
A total of 576 pulmonary arteries were examined in
the 32 patients. As seen in Fig. 1,
PE was most commonly observed in the medial, lateral, anterior and
posterior basal segmental arteries of the right lung, the anterior,
lateral and posterior basal segmental arteries of the left lung,
and the dorsal segmental artery of the left lung.
Comparison of D-dimer levels and CTPA
results
Table II presents a
comparison of the results of D-dimer level measurements (with a
positive result defined as a plasma D-dimer level >1.3 µg/ml)
and CTPA. There was no significant difference in the diagnosis of
PE between the D-dimer test and CTPA. Using CTPA as the gold
standard, D-dimer had a sensitivity of 96.2%, a specificity of
50.0%, a positive predictive value of 89.3%, a negative predictive
value of 75.0%, and an accuracy of 87.5% for the diagnosis of PE.
Plasma D-dimer level >1.3 µg/ml was defined as positive.
| Table II.Comparison of D-dimer levels and the
diagnostic results of CTPA. |
Table II.
Comparison of D-dimer levels and the
diagnostic results of CTPA.
|
| CTPA |
|---|
|
|
|
|---|
| D-dimer | + | – | Total |
|---|
| + | 25 | 3 | 28 |
| – | 1 | 3 | 4 |
| Total | 26 | 6 | 32 |
Comparison of plasma D-dimer levels
between patients positive and negative for PE on CTPA
Among the 32 patients, there were four patients with
D-dimer levels in the normal range (i.e., ≤1.3 µg/ml) and 28
patients whose D-dimer levels were >1.3 µg/ml. D-dimer levels
were significantly higher in patients with a positive CTPA
diagnosis of PE than in patients negative for PE on CTPA (9.85±7.14
vs. 2.82±2.65 µg/ml, P=0.001; Table
III).
| Table III.Differences in plasma D-dimer levels
between patients with positive and negative CTPA findings. |
Table III.
Differences in plasma D-dimer levels
between patients with positive and negative CTPA findings.
| CTPA | n | D-dimer
(µg/ml) | P |
|---|
| Positive | 26 | 9.85±7.14 | 0.001 |
| Negative | 6 | 2.82±2.65 |
|
Analysis of the correlation between
the maximal cross-sectional area of the obstructed blood vessel and
the D-dimer level
As shown in Table
IV, there was no correlation between plasma D-dimer level and
the maximal cross-sectional area of the obstructed blood
vessel.
| Table IV.Analysis of the correlation between
the maximal cross-sectional area of the obstructed blood vessel and
the plasma D-dimer level. |
Table IV.
Analysis of the correlation between
the maximal cross-sectional area of the obstructed blood vessel and
the plasma D-dimer level.
|
| Mean ± standard
deviation | r | P |
|---|
| S
(mm2) | 1.00±0.47 | 0.17 | 0.435 |
| D-dimer
(µg/ml) | 10.16±6.61 |
|
|
Methodological evaluation of D-dimer
concentration test in the diagnosis of PE
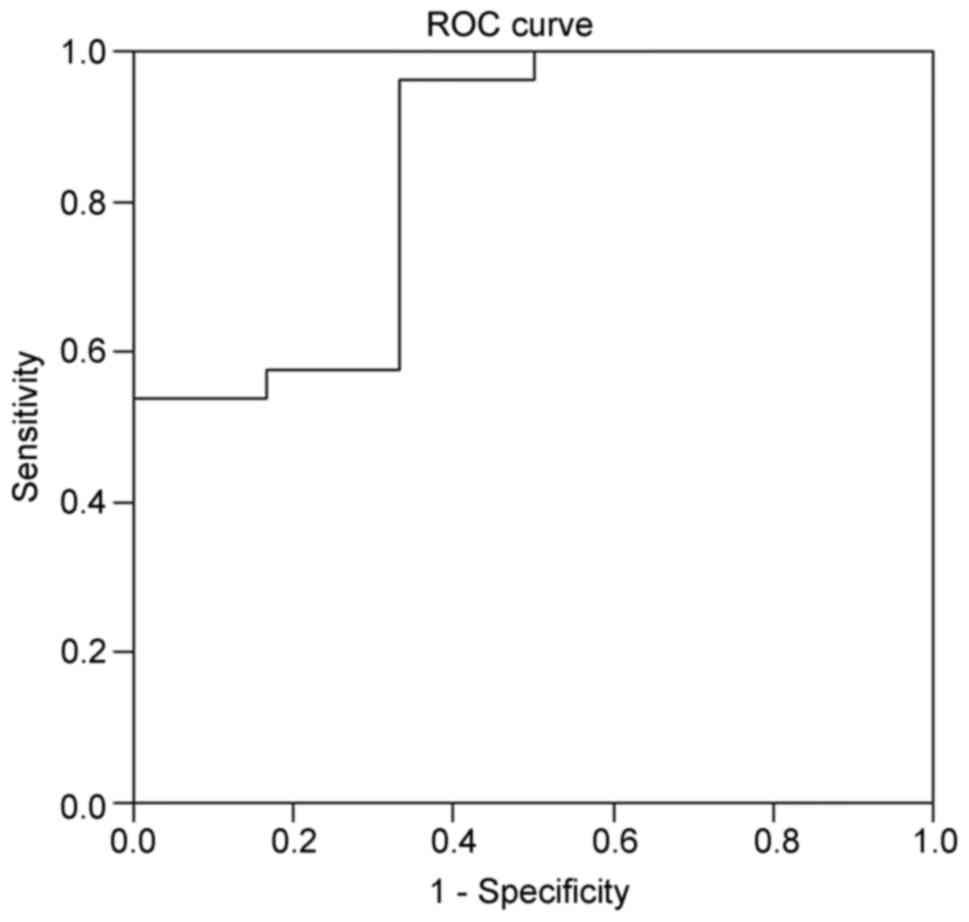
Based on the ROC curve analysis (Fig. 2), the best threshold value of D-dimer
was 1.9 µg/ml for the diagnosis of PE, with an area under the curve
(AUC) of 0.84. Using this threshold, the expected negative
predictive value was the highest, at 75%.
Representative CTPA images
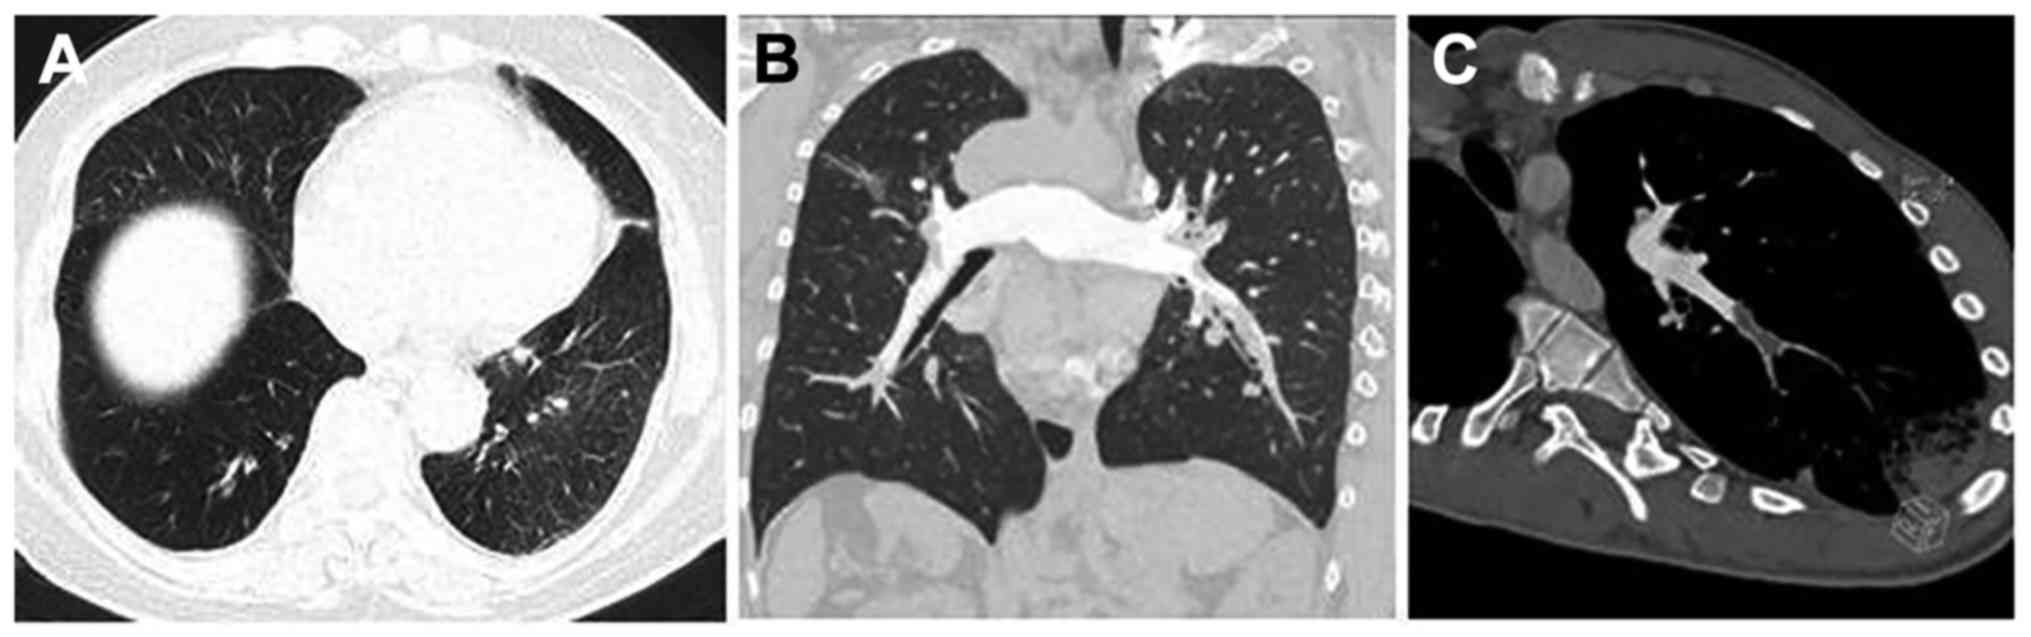
Representative CTPA images are shown in Fig. 3. In the present study, there were
four patients without obvious change in the lung parenchyma, two
with scar-like changes in the lung tissues, fifteen with pulmonary
infarction, one with non-pulmonary infarction exudation, one with
mosaic attenuation of the lung parenchyma, four with pleural
effusion, and two with pericardial effusion.
Discussion
D-dimer levels correlate with the extent of PE on
CTPA, but the use of D-dimer alone for the screening and diagnosis
of PE is still controversial (28,29).
Notably, there is a paucity of data regarding the utility of
D-dimer for the diagnosis of PE in the Chinese population, and the
optimal threshold value for Chinese individuals has yet to be
established. Therefore, this study aimed to conduct a comparative
analysis of plasma D-dimer levels and the results of CTPA (gold
standard) in a cohort of Chinese patients with suspected PE. Our
novel findings revealed that 1.9 µg/ml may be the optimal cut-off
value for D-dimer when screening for PE in the Chinese population.
Furthermore, the sensitivity of the D-dimer test for PE was very
high (approaching 100%). The results suggest that D-dimer could be
a simple, fast and inexpensive method for excluding a diagnosis of
PE.
PE is the third most common acute cardiovascular
disease, after myocardial infarction and stroke. Thousands of
people die of PE each year because they are not diagnosed and
treated in time. If they could be treated in time, the fatality
rate could be reduced (34). The
incidence of PE is thought to be lower in Asia than in western
countries (7,8), but recent data suggest that the
incidence and causes of PE are similar between Chinese and
Caucasian populations (9). A
previous study showed an increase in the incidence of PE from the
south to the north of China (11),
similar to a trend in the incidence of stroke and myocardial
infarction (11). This variation is
probably due to differences in the prevalence of hypertension,
dyslipidemia, obesity and diabetes between regions (35). In the northern Shaanxi Province of
China, the fatality rate and misdiagnosis rate of PE are much
higher than national levels due to cultural and economic
constraints. Clinical symptoms and laboratory investigations have
low sensitivity and specificity for the diagnosis of PE (2,15–17), and
often only the detection of plasma D-dimer levels is used (25–27).
Therefore, imaging remains a good method for the diagnosis of PE,
but access to imaging systems, costs, radiation exposure and the
invasiveness of angiography limit their use in developing countries
such as China. In addition, the sensitivity of CTPA is limited by
respiratory motion artifact, overweight resulting in low
signal-to-noise ratio, pulmonary artery catheterization artifact
and artifact caused by uneven mixing of contrast agent in the lumen
of the pulmonary artery. The scanning technique also has
limitations related to the settings used for window width and
position, superior vena cava artifact caused by the beam hardening
phenomenon, lung window algorithm artifact and stepladder artifact.
Anatomical factors (perivascular lymph nodes, illusion of vascular
bifurcation and unfilled pulmonary vein around the pulmonary
artery) and pathological factors (mucus plug in the trachea, edema
around the walls of blood vessels, localized increase in pulmonary
artery resistance, pulmonary artery stump thrombosis, primary
pulmonary artery sarcoma and other tumor thrombi) also affect CTPA
(21). Therefore, even if CTPA has
shown good diagnostic value for PE (18–23), it
remains imperfect; hence, more convenient and rapid approaches are
needed.
D-dimer is a small dimer produced by plasmin, and
the D-dimer content of normal human plasma is very low. A variety
of diseases associated with coagulation events can increase D-dimer
levels, and the plasma level of D-dimer is increased when
thromboembolism occurs (24), such
as PE (25–27). Perrier et al (25), reported that D-dimer had 99.5%
sensitivity and 41.0% specificity for PE when using CT or DSA as
the gold standard. A meta-analysis by Crawford et al
(26), showed that the estimated
sensitivity of D-dimer for PE ranged between 80-100%, while
specificity ranged between 23-63%. In addition, the diagnostic
thresholds may vary among different populations of patients
(26) and with age (36,37).
Schutgens et al (38), found
that D-dimer could be used as the preferred screening method for
PE, since its high sensitivity meant that negative results could
exclude PE. In the present study, using CTPA as the gold standard,
D-dimer had 96.2% sensitivity, 50.0% specificity and 87.5% accuracy
for the diagnosis of PE. The reported specificity of D-dimer has
varied somewhat between published studies, but in general ranged
from 23-63% in studies that used cut-off values of 0.5-1.2 µg/ml
(25,26,30).
Importantly, the specificity varies with the D-dimer cut-off value
chosen; for example, one study reported a specificity of 41% for a
threshold value of 0.5 µg/ml and 93% for a threshold value of 4
µg/ml (25). Therefore, our finding
of a specificity of 50% for a cut-off value of 1.3 µg/ml is
entirely consistent with these previous studies.
The exact D-dimer threshold for the diagnosis of PE
is still controversial (28,29). Indeed, as stated above, a
meta-analysis showed that the diagnostic thresholds may vary among
populations of patients (26). Our
center defines high D-dimer levels as >1.3 µg/ml, but the ROC
curve analysis suggested that 1.9 µg/ml was the optimal threshold
for the diagnosis of PE in our patient sample. The determination of
an optimal threshold value (1.9 µg/ml) that was lower than the
average plasma D-dimer level in patients negative for PE on CTPA
(2.82±2.65 µg/ml) reflects the wide range of D-dimer levels
measured both in patients positive for PE on CTPA and those
negative for PE on CTPA (as is evident from the standard deviations
for both groups). For example, although only one of the 26 patients
positive for PE on CTPA had a D-dimer level ≤1.3 µg/ml, three of
the six patients (50%) negative for PE on CTPA had a D-dimer level
>1.3 µg/ml (Table II). There
are, of course, many reasons why patients negative for PE on CTPA
might have an elevated D-dimer level, including the presence of
other medical conditions (such as deep vein thrombosis, malignancy,
sepsis, acute coronary syndrome, acute aortic syndrome, trauma,
recent surgery and pregnancy) (39)
and the failure of CTPA to detect PE in segmental branches (i.e., a
false negative CTPA diagnosis). Notably, deep vein thrombosis,
recent surgery, recent pregnancy and a history of coronary heart
disease were reported in some of the patients in the present study.
ROC curve analysis identifies the optimal threshold based on the
Youden index, thus the optimal cut-off point is where the sum of
the sensitivity and specificity is maximal. It so happens that this
threshold in our cohort is 1.9 µg/ml. The existence of numerous
causes of elevated D-dimer levels likely underlies the low
specificity of D-dimer for PE.
A previous study showed that D-dimer levels
correlate with the extent of PE on CTPA (32). In the present study, no correlation
was observed between the maximal surface area of the embolized
artery and D-dimer level. This discrepancy could be due to the
methods used to assess the extent of PE.
CTPA has been proposed as a first-line investigation
for the diagnosis of PE. MPR, MIP, VR and other post-processing
techniques are widely recognized as a valid alternative to the DSA
gold standard (40). The present
study found that CTPA had notable advantages in the diagnosis of
PE. Indeed, CTPA is able to visually display the number, location,
size, shape and other characteristics of the emboli as well as show
changes in the lung tissues after embolization. Moreover, for cases
without embolism, it is possible to obtain valuable information
about the clinical condition of the lungs and the presence of
macroangiopathy, which can explain the clinical symptoms and signs.
On the other hand, the detection of D-dimer is convenient, rapid
and inexpensive, making it a good PE screening tool (41). Nevertheless, because of its low
specificity (26), it cannot be used
to make a definitive diagnosis of PE. A previous study had reported
that the plasma D-dimer level was closely related to the position
and size of the embolism (42). In
addition, although CTPA could easily detect emboli in the main
pulmonary artery, it could miss emboli in segmental branches,
whereas the D-dimer level was elevated in both cases (42). Therefore, we believe that the
combination of CTPA and D-dimer can effectively improve the
accuracy of PE diagnosis and reduce the rate of misdiagnosis.
Certainly, there were some limitations. The sample
size was small and the number of patients with negative CTPA was
small. In addition, because most patients suffered from shortness
of breath and dyspnea, ECG-gated CTPA was not performed, and
observation of the pulmonary artery near the heart was affected by
the heartbeat. Moreover, X-ray exposure during CTPA scanning is an
important issue, and future studies should focus on avoiding high
radiation doses. Also, DSA was not performed to confirm the cases
of PE. Finally, the study was retrospective in design, so may have
been prone to selection bias and information bias; it also cannot
be excluded that unknown confounders influenced our results.
However, it should be noted that information regarding D-dimer
level and the diagnostic results of CTPA could be reliably obtained
from the medical records, hence information bias was likely
minimal. Furthermore, a retrospective design is often used a first
step in the determination of optimal cut-off values for a biomarker
(43). Additional studies are needed
to confirm the optimal cut-off value and validate the use of
D-dimer levels in the diagnosis of PE in the Chinese
population.
In conclusion, measurement of plasma D-dimer level
could be a simple, fast and inexpensive method for excluding a
diagnosis of PE. Detection of plasma D-dimer levels could avoid
unnecessary CTPA examinations and facilitate the early instigation
of treatment for PE, thus improving the prognosis of patients.
Acknowledgements
Not applicable.
Funding
No funding was received.
Availability of data and materials
All data generated or analyzed during this study are
included in this published article
Authors' contributions
HG conceived and coordinated the study, designed,
performed and analyzed the experiments and wrote the paper. HL and
YL performed the data collection, data analysis and revised the
paper. All authors reviewed the results and approved the final
version of the manuscript.
Ethics approval and consent to
participate
The present study was approved by the ethics
committee of the Affiliated Hospital of Yan'an University. All
procedures performed in studies involving human participants were
in accordance with the ethical standards of the institutional
and/or national research committee and with the 1964 Helsinki
declaration and its later amendments or comparable ethical
standards. The need for individual consent was waived because of
the retrospective nature of the study. However, all study
participants provided informed consent for the investigations and
treatment they received.
Consent for publication
Not applicable.
Competing interests
The authors declare that they have no competing
interests.
References
|
1
|
Kearon C: Diagnosis of pulmonary embolism.
CMAJ. 168:183–194. 2003.PubMed/NCBI
|
|
2
|
Konstantinides SV, Torbicki A, Agnelli G,
Danchin N, Fitzmaurice D, Galiè N, Gibbs JS, Huisman MV, Humbert M,
Kucher N, et al: 2014 ESC guidelines on the diagnosis and
management of acute pulmonary embolism. Eur Heart J. 35:3033–3069.
3069a–3069k. 2014. View Article : Google Scholar : PubMed/NCBI
|
|
3
|
Heit JA, Melton LJ III, Lohse CM,
Petterson TM, Silverstein MD, Mohr DN and O'Fallon WM: Incidence of
venous thromboembolism in hospitalized patients vs. community
residents. Mayo Clin Proc. 76:1102–1110. 2001. View Article : Google Scholar : PubMed/NCBI
|
|
4
|
Huerta C, Johansson S, Wallander MA and
García Rodríguez LA: Risk factors and short-term mortality of
venous thromboembolism diagnosed in the primary care setting in the
United Kingdom. Arch Intern Med. 167:935–943. 2007. View Article : Google Scholar : PubMed/NCBI
|
|
5
|
Silverstein MD, Heit JA, Mohr DN,
Petterson TM, O'Fallon WM and Melton LJ III: Trends in the
incidence of deep vein thrombosis and pulmonary embolism: A 25-year
population-based study. Arch Intern Med. 158:585–593. 1998.
View Article : Google Scholar : PubMed/NCBI
|
|
6
|
Oger E: Incidence of venous
thromboembolism: A community-based study in Western France.
EPI-GETBP Study Group. Groupe d'Etude de la Thrombose de Bretagne
Occidentale. Thromb Haemost. 83:657–660. 2000.
|
|
7
|
Jang MJ, Bang SM and Oh D: Incidence of
venous thromboembolism in Korea: From the health insurance review
and assessment service database. J Thromb Haemost. 9:85–91. 2011.
View Article : Google Scholar : PubMed/NCBI
|
|
8
|
Molina JA, Jiang ZG, Heng BH and Ong BK:
Venous thromboembolism at the National Healthcare Group, Singapore.
Ann Acad Med Singapore. 38:470–478. 2009.PubMed/NCBI
|
|
9
|
Gong JN and Yang YH: Current clinical
management status of pulmonary embolism in China. Chin Med J
(Engl). 130:379–381. 2017. View Article : Google Scholar : PubMed/NCBI
|
|
10
|
Stein PD, Beemath A and Olson RE: Trends
in the incidence of pulmonary embolism and deep venous thrombosis
in hospitalized patients. Am J Cardiol. 95:1525–1526. 2005.
View Article : Google Scholar : PubMed/NCBI
|
|
11
|
Yang Y, Liang L, Zhai Z, He H, Xie W, Peng
X and Wang C: Investigators for National Cooperative Project for
Prevention, Treatment of PTE-DVT, Pulmonary embolism incidence and
fatality trends in Chinese hospitals from 1997 to 2008: A
multicenter registration study. PLoS One. 6:e268612011. View Article : Google Scholar : PubMed/NCBI
|
|
12
|
Tepper NK, Boulet SL, Whiteman MK, Monsour
M, Marchbanks PA, Hooper WC and Curtis KM: Postpartum venous
thromboembolism: Incidence and risk factors. Obstet Gynecol.
123:987–996. 2014. View Article : Google Scholar : PubMed/NCBI
|
|
13
|
Shopp JD, Stewart LK, Emmett TW and Kline
JA: Findings from 12-lead electrocardiography that predict
circulatory shock from pulmonary embolism: Systematic review and
meta-analysis. Acad Emerg Med. 22:1127–1137. 2015. View Article : Google Scholar : PubMed/NCBI
|
|
14
|
Spencer FA, Gore JM, Lessard D, Douketis
JD, Emery C and Goldberg RJ: Patient outcomes after deep vein
thrombosis and pulmonary embolism: The worcester venous
thromboembolism study. Arch Intern Med. 168:425–430. 2008.
View Article : Google Scholar : PubMed/NCBI
|
|
15
|
Jaff MR, McMurtry MS, Archer SL, Cushman
M, Goldenberg N, Goldhaber SZ, Jenkins JS, Kline JA, Michaels AD,
Thistlethwaite P, et al: Management of massive and submassive
pulmonary embolism, iliofemoral deep vein thrombosis, and chronic
thromboembolic pulmonary hypertension: A scientific statement from
the American Heart Association. Circulation. 123:1788–1830. 2011.
View Article : Google Scholar : PubMed/NCBI
|
|
16
|
Goldhaber SZ and Bounameaux H: Pulmonary
embolism and deep vein thrombosis. Lancet. 379:1835–1846. 2012.
View Article : Google Scholar : PubMed/NCBI
|
|
17
|
Busse LW and Vourlekis JS: Submassive
pulmonary embolism. Crit Care Clin. 30:447–473. 2014. View Article : Google Scholar : PubMed/NCBI
|
|
18
|
Hayashino Y, Goto M, Noguchi Y and Fukui
T: Ventilation-perfusion scanning and helical CT in suspected
pulmonary embolism: Meta-analysis of diagnostic performance.
Radiology. 234:740–748. 2005. View Article : Google Scholar : PubMed/NCBI
|
|
19
|
Anderson DR, Kahn SR, Rodger MA, Kovacs
MJ, Morris T, Hirsch A, Lang E, Stiell I, Kovacs G, Dreyer J, et
al: Computed tomographic pulmonary angiography vs.
ventilation-perfusion lung scanning in patients with suspected
pulmonary embolism: A randomized controlled trial. JAMA.
298:2743–2753. 2007.
|
|
20
|
Quiroz R, Kucher N, Zou KH, Kipfmueller F,
Costello P, Goldhaber SZ and Schoepf UJ: Clinical validity of a
negative computed tomography scan in patients with suspected
pulmonary embolism: A systematic review. JAMA. 293:2012–2017. 2005.
View Article : Google Scholar : PubMed/NCBI
|
|
21
|
Wittram C, Maher MM, Yoo AJ, Kalra MK,
Shepard JA and McLoud TC: CT angiography of pulmonary embolism:
Diagnostic criteria and causes of misdiagnosis. Radiographics.
24:1219–1238. 2004. View Article : Google Scholar : PubMed/NCBI
|
|
22
|
Wittram C, Waltman AC, Shepard JA, Halpern
E and Goodman LR: Discordance between CT and angiography in the
PIOPED II study. Radiology. 244:883–889. 2007. View Article : Google Scholar : PubMed/NCBI
|
|
23
|
Stein PD, Fowler SE, Goodman LR,
Gottschalk A, Hales CA, Hull RD, Leeper KV Jr, Popovich J Jr, Quinn
DA, Sos TA, et al: Multidetector computed tomography for acute
pulmonary embolism. N Engl J Med. 354:2317–2327. 2006. View Article : Google Scholar : PubMed/NCBI
|
|
24
|
Adam SS, Key NS and Greenberg CS: D-dimer
antigen: Current concepts and future prospects. Blood.
113:2878–2887. 2009. View Article : Google Scholar : PubMed/NCBI
|
|
25
|
Perrier A, Desmarais S, Goehring C, de
Moerloose P, Morabia A, Unger PF, Slosman D, Junod A and Bounameaux
H: D-dimer testing for suspected pulmonary embolism in outpatients.
Am J Respir Crit Care Med. 156:492–496. 1997. View Article : Google Scholar : PubMed/NCBI
|
|
26
|
Crawford F, Andras A, Welch K, Sheares K,
Keeling D and Chappell FM: D-dimer test for excluding the diagnosis
of pulmonary embolism. Cochrane Database Syst Rev.
CD0108642016.PubMed/NCBI
|
|
27
|
Le Gal G, Righini M and Wells PS: D-dimer
for pulmonary embolism. JAMA. 313:1668–1669. 2015. View Article : Google Scholar : PubMed/NCBI
|
|
28
|
Pathak VP, Rendon ISH and Mthyala P:
Elevated D-dimer is not always pulmonary embolism. Resp Med CME.
4:91–92. 2011. View Article : Google Scholar
|
|
29
|
Righini M, Van Es J, Den Exter PL, Roy PM,
Verschuren F, Ghuysen A, Rutschmann OT, Sanchez O, Jaffrelot M,
Trinh-Duc A, et al: Age-adjusted D-dimer cutoff levels to rule out
pulmonary embolism: The ADJUST-PE study. JAMA. 311:1117–1124. 2014.
View Article : Google Scholar : PubMed/NCBI
|
|
30
|
Eng CW, Wansaicheong G, Goh SK, Earnest A
and Sum C: Exclusion of acute pulmonary embolism: Computed
tomography pulmonary angiogram or D-dimer? Singapore Med J.
50:403–406. 2009.PubMed/NCBI
|
|
31
|
Subramaniam RM, Chou T, Swarbrick M and
Karalus N: Pulmonary embolism: Accuracy and safety of a negative CT
pulmonary angiogram and value of a negative D-dimer assay to
exclude CT pulmonary angiogram-detectable pulmonary embolism.
Australas Radiol. 50:424–428. 2006. View Article : Google Scholar : PubMed/NCBI
|
|
32
|
Ji Y, Sun B, Juggessur-Mungur KS, Li Z and
Zhang Z: Correlation of D-dimer level with the radiological
severity indexes of pulmonary embolism on computed tomography
pulmonary angiography. Chin Med J (Engl). 127:2025–2029.
2014.PubMed/NCBI
|
|
33
|
Storto ML, Di Credico A, Guido F, Larici
AR and Bonomo L: Incidental detection of pulmonary emboli on
routine MDCT of the chest. AJR Am J Roentgenol. 184:264–267. 2005.
View Article : Google Scholar : PubMed/NCBI
|
|
34
|
Nanchal R, Kumar G, Taneja A, Patel J,
Deshmukh A, Tarima S, Jacobs ER and Whittle J: from the Milwaukee
Initiative in Critical Care Outcomes Research (MICCOR) Group of
Investigators, Pulmonary embolism: The weekend effect. Chest.
142:690–696. 2012. View Article : Google Scholar : PubMed/NCBI
|
|
35
|
Tsai AW, Cushman M, Rosamond WD, Heckbert
SR, Polak JF and Folsom AR: Cardiovascular risk factors and venous
thromboembolism incidence: The longitudinal investigation of
thromboembolism etiology. Arch Intern Med. 162:1182–1189. 2002.
View Article : Google Scholar : PubMed/NCBI
|
|
36
|
Gupta A, Raja AS, Ip IK and Khorasani R:
Assessing 2 D-dimer age-adjustment strategies to optimize computed
tomographic use in ED evaluation of pulmonary embolism. Am J Emerg
Med. 32:1499–1502. 2014. View Article : Google Scholar : PubMed/NCBI
|
|
37
|
Woller SC, Stevens SM, Adams DM, Evans RS,
Lloyd JF, Snow GL, Bledsoe JR, Gay DZ, Patten RM, Aston VT and
Elliott CG: Assessment of the safety and efficiency of using an
age-adjusted D-dimer threshold to exclude suspected pulmonary
embolism. Chest. 146:1444–1451. 2014. View Article : Google Scholar : PubMed/NCBI
|
|
38
|
Schutgens RE, Ackermark P, Haas FJ,
Nieuwenhuis HK, Peltenburg HG, Pijlman AH, Pruijm M, Oltmans R,
Kelder JC and Biesma DH: Combination of a normal D-dimer
concentration and a non-high pretest clinical probability score is
a safe strategy to exclude deep venous thrombosis. Circulation.
107:593–597. 2003. View Article : Google Scholar : PubMed/NCBI
|
|
39
|
Schutte T, Thijs A and Smulders YM: Never
ignore extremely elevated D-dimer levels: They are specific for
serious illness. Neth J Med. 74:443–448. 2016.PubMed/NCBI
|
|
40
|
British Thoracic Society Standards of Care
Committee Pulmonary Embolism Guideline Development Group, British
thoracic society guidelines for the management of suspected acute
pulmonary embolism. Thorax. 58:470–483. 2003. View Article : Google Scholar : PubMed/NCBI
|
|
41
|
Castañer E, Gallardo X, Ballesteros E,
Andreu M, Pallardó Y, Mata JM and Riera L: CT diagnosis of chronic
pulmonary thromboembolism. Radiographics. 29:31–53. 2009.
View Article : Google Scholar : PubMed/NCBI
|
|
42
|
De Monyé W, Sanson BJ, Mac Gillavry MR,
Pattynama PM, Büller HR, van den Berg-Huysmans AA and Huisman MV:
ANTELOPE-Study Group, Embolus location affects the sensitivity of a
rapid quantitative D-dimer assay in the diagnosis of pulmonary
embolism. Am J Respir Crit Care Med. 165:345–348. 2002. View Article : Google Scholar : PubMed/NCBI
|
|
43
|
Pepe MS, Etzioni R, Feng Z, Potter JD,
Thompson ML, Thornquist M, Winget M and Yasui Y: Phases of
biomarker development for early detection of cancer. J Natl Cancer
Inst. 93:1054–1061. 2001. View Article : Google Scholar : PubMed/NCBI
|